. 2023 Jan 4:13:1081576.
doi: 10.3389/fmicb.2022.1081576. eCollection 2022.

Effect of disease severity on the structure and diversity of the phyllosphere microbial community in tobacco

Affiliations

Effect of disease severity on the structure and diversity of the phyllosphere microbial community in tobacco

Meili Sun et al. Front Microbiol. .

Abstract

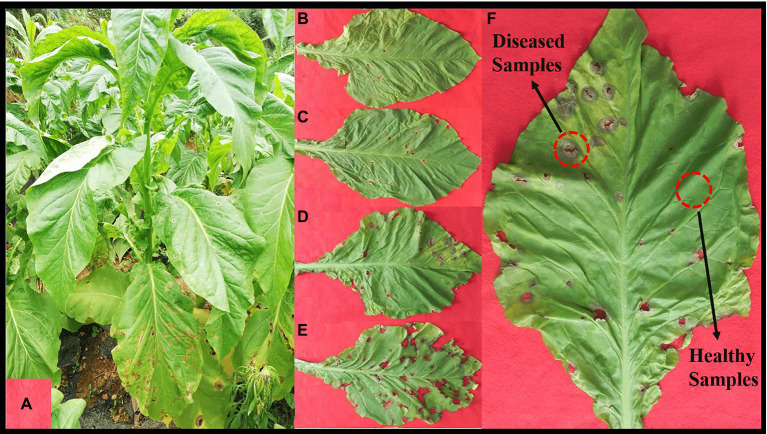
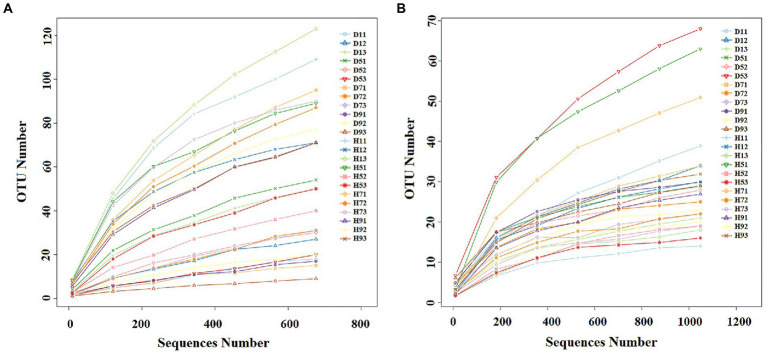
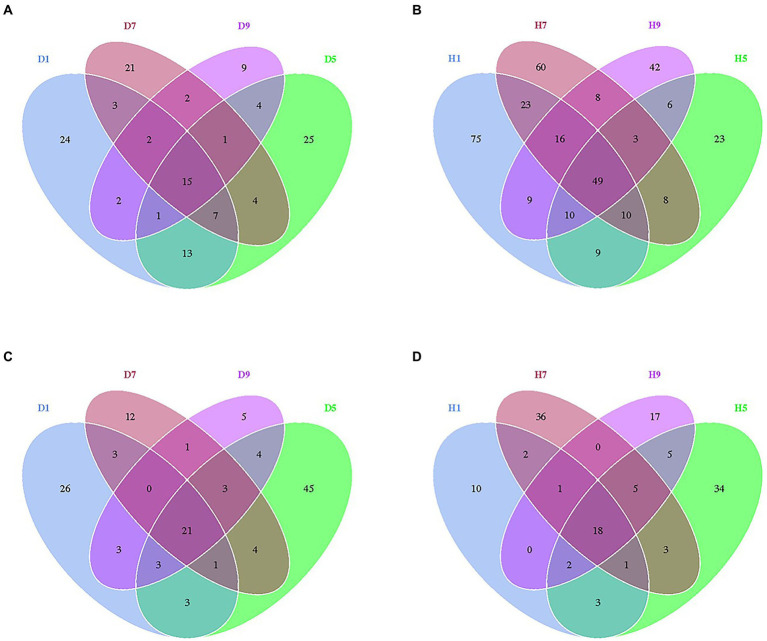
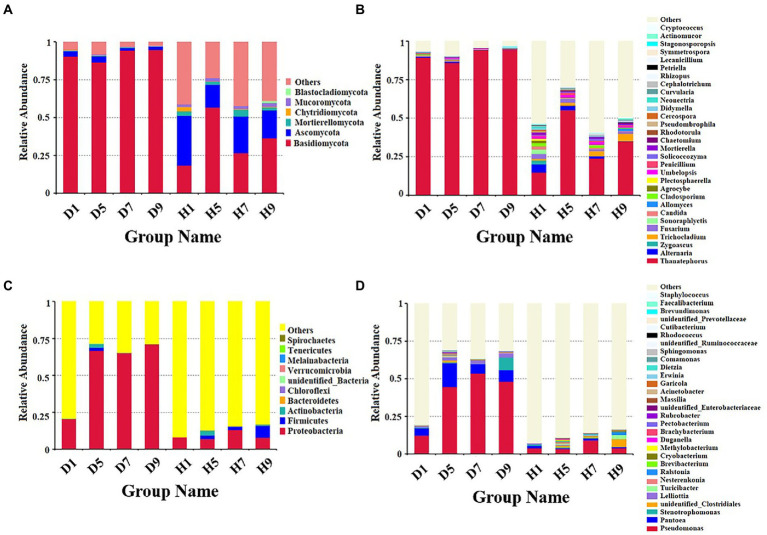
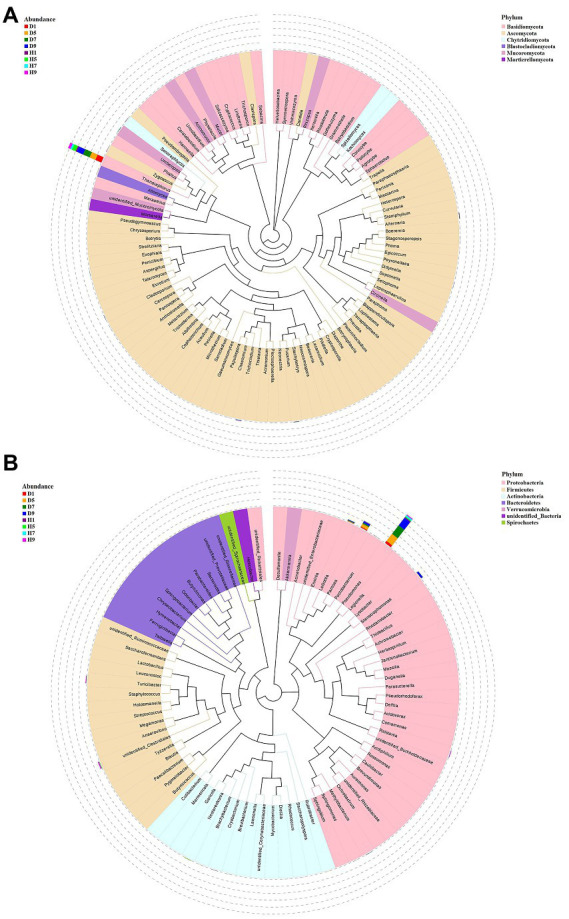
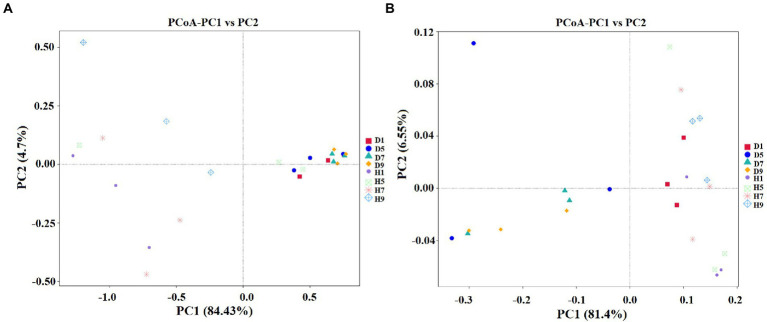
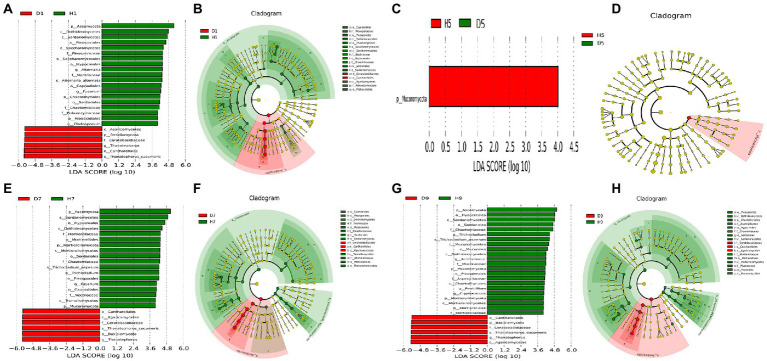
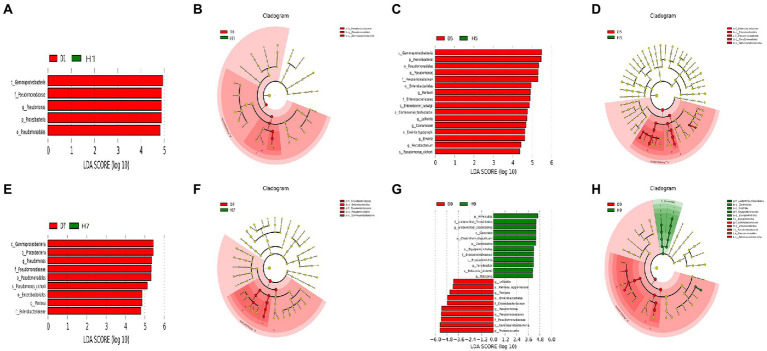
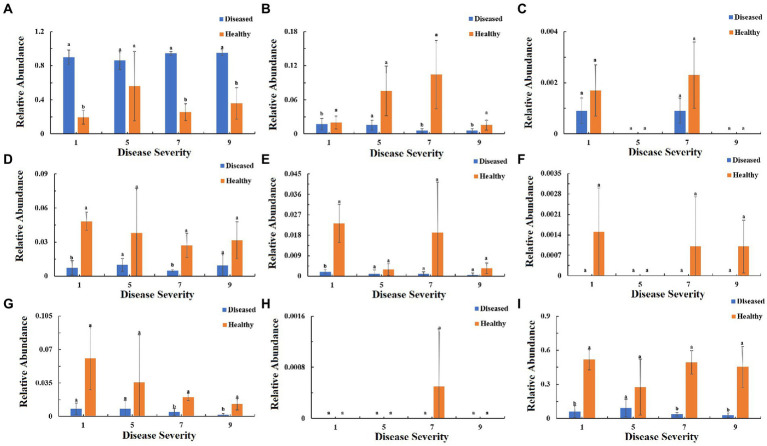
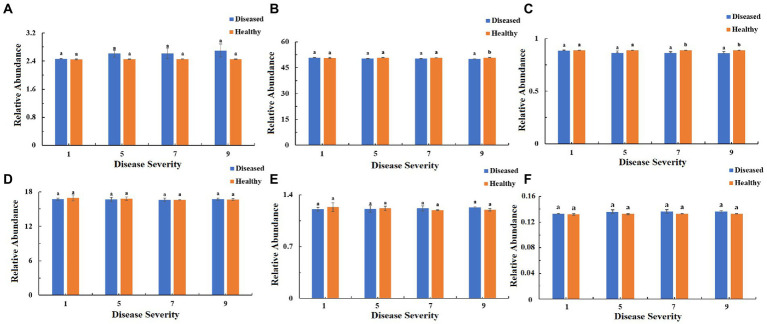
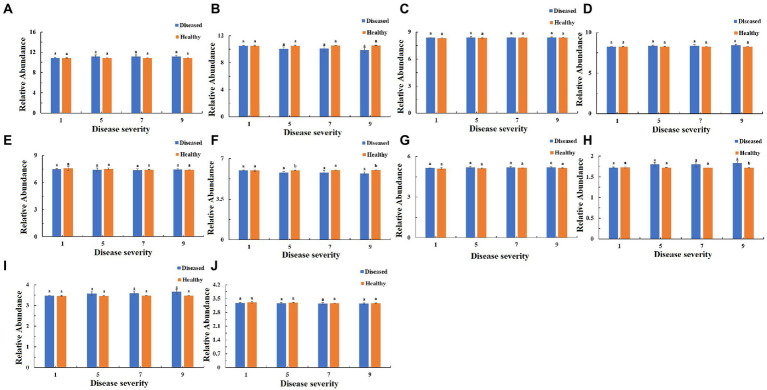
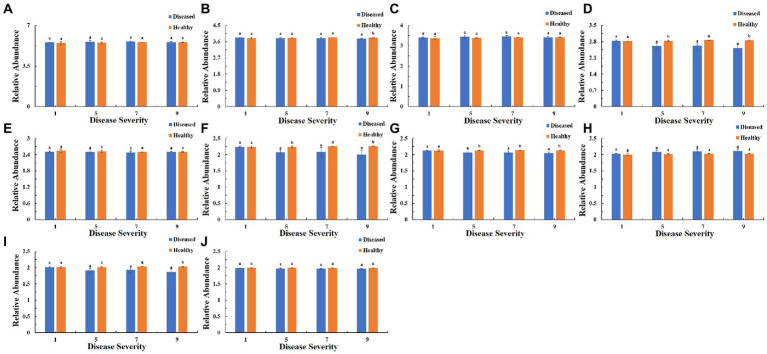
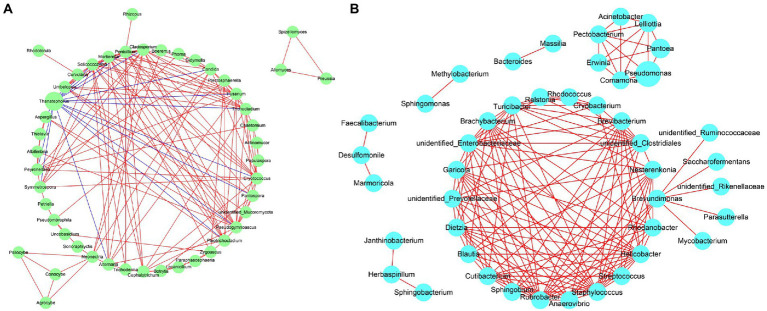
Tobacco target spot is a serious fungal disease and it is important to study the similarities and differences between fungal and bacterial community under different disease severities to provide guidance for the biological control of tobacco target spot. In this study, tobacco leaves at disease severity level of 1, 5, 7 and 9 (S1, S5, S7, and S9) were collected, both healthy and diseased leaf tissues for each level were sampled. The community structure and diversity of fungi and bacteria in tobacco leaves with different disease severities were compared using high-throughput sequencing technology. The results indicated that there was a significant differences in the community structure of fungi and bacteria for both healthy and diseased samples depending on the disease severity. In both healthy and diseased tobacco leaves for all four different disease severities, the most dominant fungal phylum was Basidiomycota with a high prevalence of genus Thanatephorus. The relative abundance of Thanatephorus was most found at S9 diseased samples. Proteobacteria represent the most prominent bacterial phylum, with Pseudomonas as predominant genus, followed by Pantoea. The relative abundance of Pseudomonas was most found at S7 healthy samples. In fungal community, the Alpha-diversity of healthy samples was higher than that of diseased samples. In contrast, in bacterial community, the Alpha-diversity of healthy samples was lower than that of diseased samples. LEfSe analysis showed that the most enrich fungal biomarker was Thanatephorus cucumeris in diseased samples. Clostridium disporicum and Ralstonia pickettii were the most enrich bacterial biomarker in healthy samples. FUNGuild analysis showed that the pathotroph mode was the most abundant trophic modes. The relative abundance of pathotroph mode in diseased samples changes insignificantly, but a peak at S5 was observed for healthy samples. PICRUSt analysis showed that most bacterial gene sequences seem to be independent of the disease severity. The results of this study provide scientific references for future studies on tobacco phyllosphere microecology aiming at prevention and control of tobacco target spot.

Keywords: disease severity; high-throughput sequencing; microbial composition; phyllosphere; tobacco target spot.


Conflict of interest statement

The authors declare that the research was conducted in the absence of any commercial or financial relationships that could be construed as a potential conflict of interest.

Figures

Figure 1
Figure 1
Whole plant (A) and leaves displaying disease severity at (B) S1, (C) S5, (D) S7, and (E) S9, respectively. (F), sampling parts display of diseased and healthy samples on tobacco leaves.
Figure 2
Figure 2
Rarefaction curves of fungal (A) and bacterial (B) OTUs across different tobacco leaf samples.
Figure 3
Figure 3
Venn diagram showing the number of fungal and bacterial OTUs observed in different groups at four different disease severity. Fungal Venn diagram in diseased (A) and healthy (B) groups at four different disease severities. Bacterial Venn diagram in diseased (C) and healthy (D) groups at four different disease severities. Numbers in the overlapping region indicated unique OTUs for two or three samples. Numbers in the non-overlapping regions indicated unique OTUs for the group.
Figure 4
Figure 4
Microbial community composition of different groups at the phyla and genus levels. Fungal community composition of different groups at the phyla (A) and genus (B) levels. Bacterial community composition of different groups at the phyla (C) and genus (D) levels.
Figure 5
Figure 5
Maxium likelihood tree of the 100 most abundant fungal (A) and bacterial (B) genera in the eight group samples from tobacco target spot leaves. A color-coded bar plot shows the distribution of each fungal and bacterial genus in different groups.
Figure 6
Figure 6
Principal Co-ordinate Analysis (PCoA) of the fungal (A) and bacterial (B) communities in the different group sample.
Figure 7
Figure 7
LEfSe analysis of fungi abundance between diseased and healthy samples of different disease severities. (A), (C), (E), (G) are LDA score identified the size of differentiation between diseased and healthy groups of 1, 5, 7, 9 disease severity, respectively, with a threshold value of 4. (B), (D), (F), (H) are the cladogram of microbial communities of 1, 5, 7, 9 disease severity, respectively.
Figure 8
Figure 8
LEfSe analysis of bacteria abundance between diseased and healthy samples of different disease severities. (A), (C), (E), (G) are LDA score identified the size of differentiation between diseased and healthy groups of S1, S5, S7, S9, respectively, with a threshold value of 4. (B), (D), (F), (H) are the cladogram of microbial communities of S1, S5, S7, S9, respectively.
Figure 9
Figure 9
Relative abundance of fungal functional groups (modes) based on OTU annotation table with disturbance frequency level. (A) Pathotroph, (B) Saprotroph, (C) Symbiotroph, (D) Pathotroph-Saprotroph, (E) Pathotroph-Symbiotroph, (F) Pathogen-Saprotroph-Symbiotroph, (G) Pathotroph-Saprotroph-Symbiotroph, (H) Saprotroph-Symbiotroph, (I) Unassigned.
Figure 10
Figure 10
PICRUSt analyses of the changes in the KEGG level 1 functional categories of bacteria in tobacco leaf samples. (A) Cellular Processes, (B) Metabolism, (C) Organismal Systems, (D) Genetic Information Processing, (E) Human Diseases, (F) Environmental Information Processing.
Figure 11
Figure 11
PICRUSt analyses of the changes in the KEGG level 2 functional categories of bacteria in tobacco leaf samples. (A) Membrane Transport, (B) Energy Metabolism, (C) Carbohydrate Metabolism, (D) Amino Acid Metabolism, (E) Replication and Repair, (F) Metabolism of Cofactors and Vitamins, (G) Poorly Characterized, (H) Translation, (I) Cellular Processes and Signaling, (J) Nucleotide Metabolism.
Figure 12
Figure 12
PICRUSt analyses of the changes in the KEGG level 3 functional categories of bacteria in tobacco leaf samples. (A) Transporters Ribosome, (B) General function prediction only, (C) ABC transporters, (D) Photosynthesis proteins, (E) DNA repair and recombination proteins, (F) Photosynthesis, (G) Peptidases, (H) Two component system, (I) Porphyrin and chlorophyll metabolism, (J) Purine metabolism.
Figure 13
Figure 13
Network analysis of fungal (A) and bacterial (B) taxa showing significant positive or negative co-occurrences based on Spearman’s rank correlations. Red lines represent positive correlations and blue lines represent negative correlations.

Similar articles

Cited by

References

    1. Agler M. T., Ruhe J., Kroll S., Morhenn C., Kim S. T., Weigel D., et al. (2016). Microbial hub taxa link host and abiotic factors to plant microbiome variation. PLoS Biol. 14:e1002352. doi: 10.1371/journal.pbio.1002352, PMID: - DOI - PMC - PubMed
    1. Arnold A., Mejia L., Kyllo D., Rojas E., Maynard Z., Robbins N., et al. (2003). Fungal endophytes limit pathogen damage in a tropical tree. Proceedings Nat. Acad. Sci. 100, 15649–15654. doi: 10.1073/pnas.2533483100, PMID: - DOI - PMC - PubMed
    1. Baker C. M., Chitrakar R., Obulareddy N., Panchal S., Williams P., Melotto M. (2010). Melecular battles between plant and pathogenic bacteria in the phyllosphere. Rev. Bras. Pesqui. Med. Biol. 43, 698–704. doi: 10.1590/S0100-879X2010007500060 - DOI - PMC - PubMed
    1. Bertelsen J. R., Neergaard E., Smedegaard P. V. (2001). Fungicidal effects of azoxystrobin and epoxiconazole on phyllosphere fungi, senescence and yield of winter wheat. Plant Pathol. 50, 190–205. doi: 10.1046/j.1365-3059.2001.00545.x - DOI
    1. Busby P., Peay K., Newcomb C. (2016). Common foliar fungi of Populus trichocarpa modify melampsora rust disease severity. New Phytol. 209, 1681–1692. doi: 10.1111/nph.13742, PMID: - DOI - PubMed

LinkOut - more resources