

Alterations and correlations of gut microbiota, fecal, and serum metabolome characteristics in a rat model of alcohol use disorder
- PMID: 36687619
- PMCID: PMC9846065
- DOI: 10.3389/fmicb.2022.1068825
Alterations and correlations of gut microbiota, fecal, and serum metabolome characteristics in a rat model of alcohol use disorder
Abstract
Background: Growing evidence suggests the gut microbiota and metabolites in serum or fecal may play a key role in the process of alcohol use disorder (AUD). However, the correlations of gut microbiota and metabolites in both feces and serum in AUD subjects are not well understood.
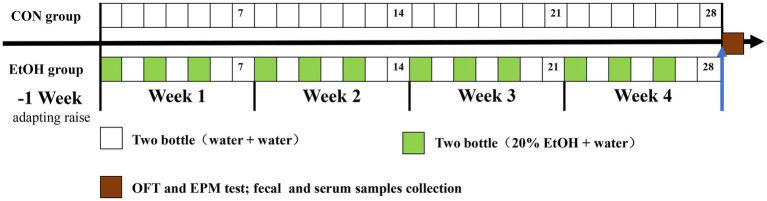
Methods: We established a rat model of AUD by a chronic intermittent ethanol voluntary drinking procedure, then the AUD syndromes, the gut microbiota, metabolomic profiling in feces and serum of the rats were examined, and correlations between gut microbiota and metabolites were analyzed.
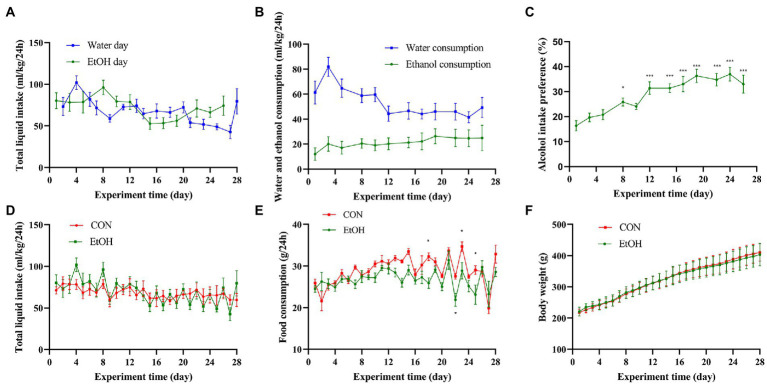
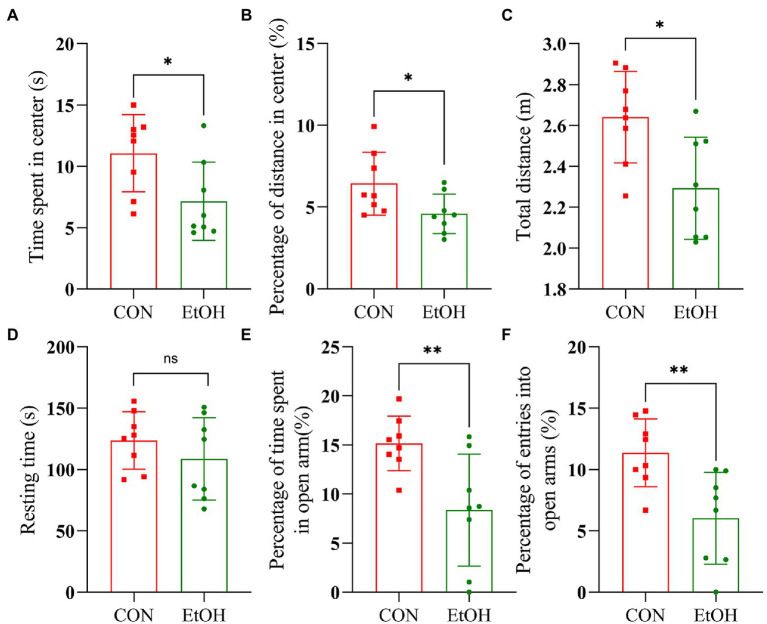
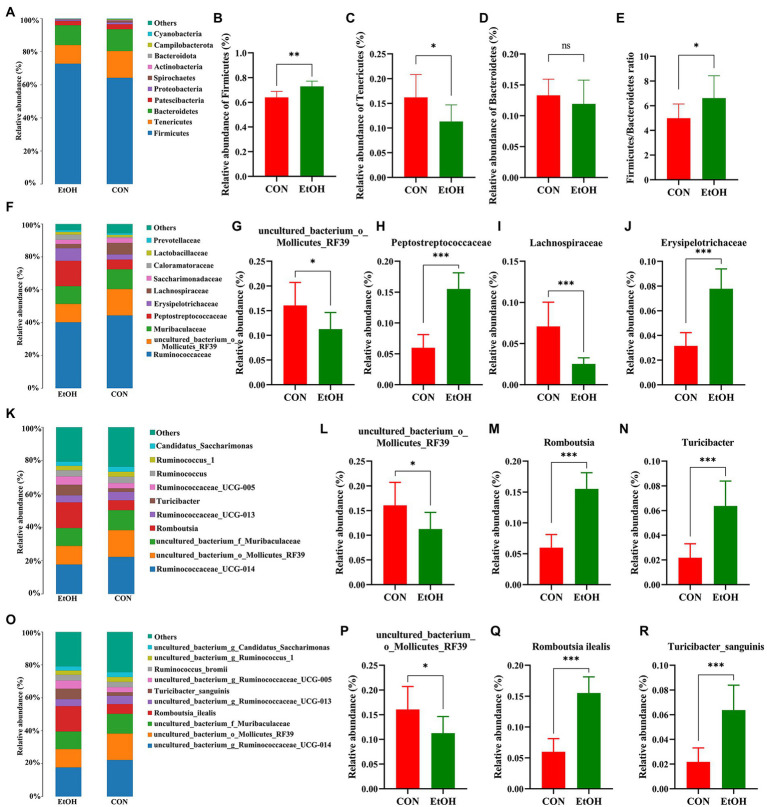
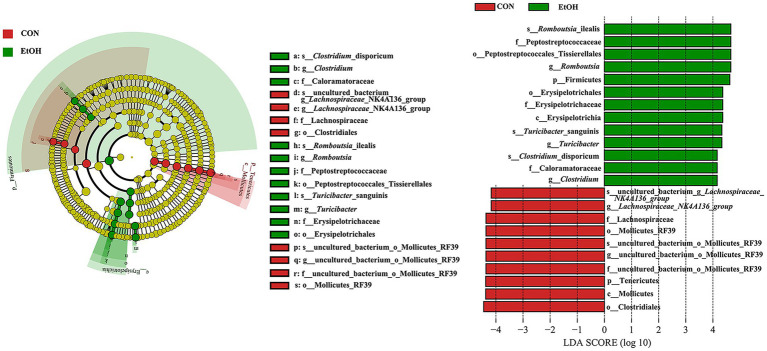
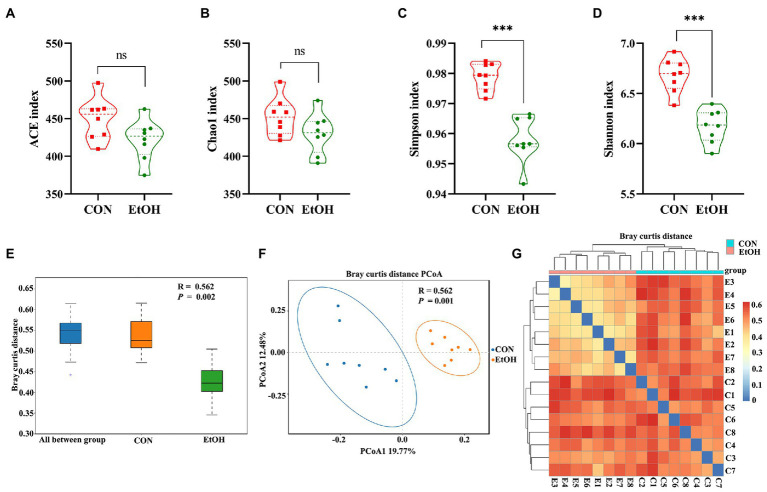
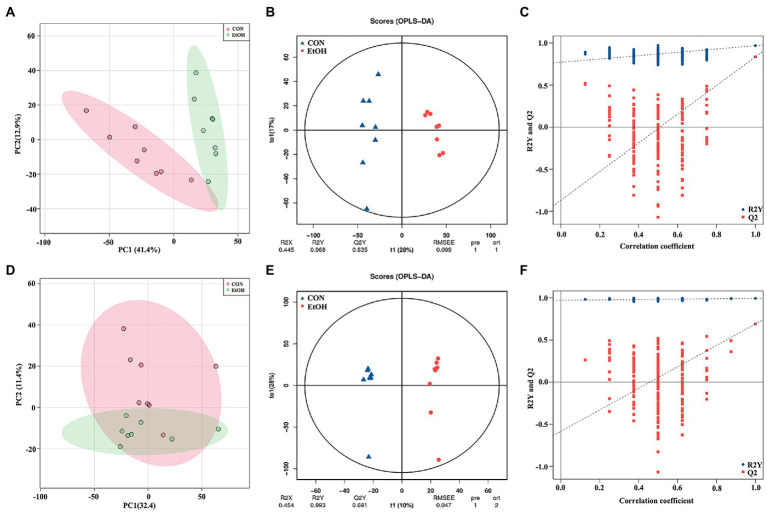
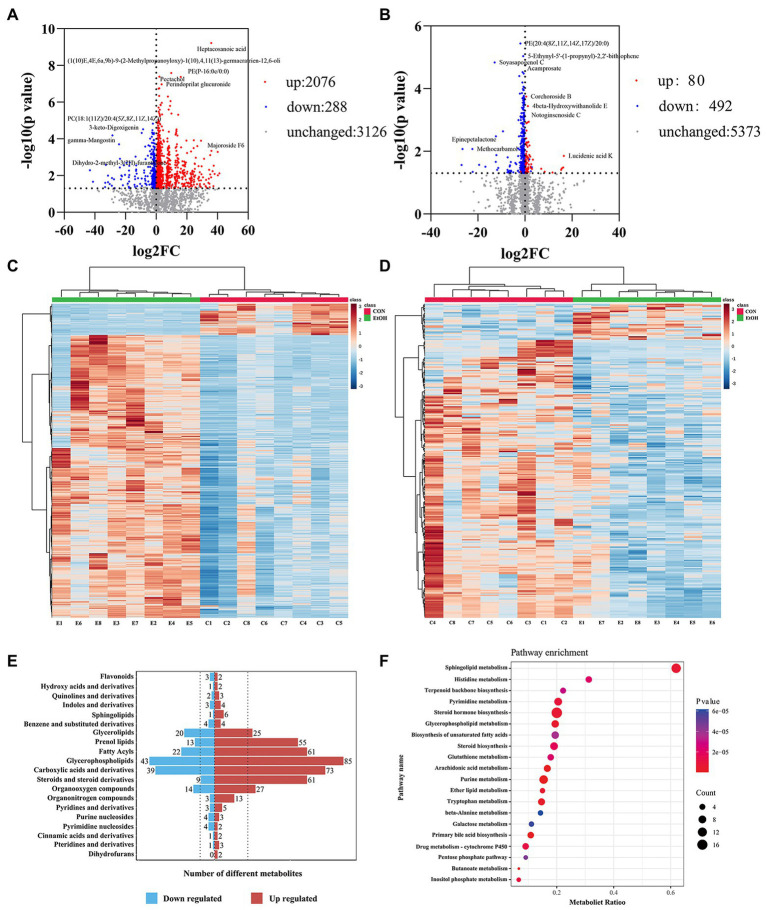
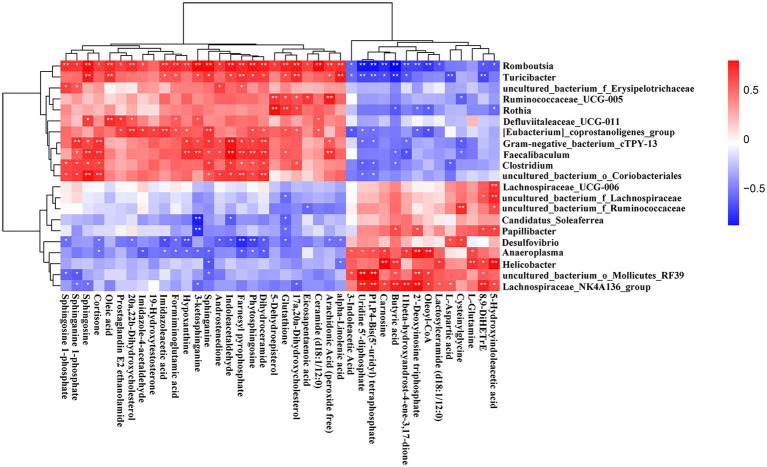
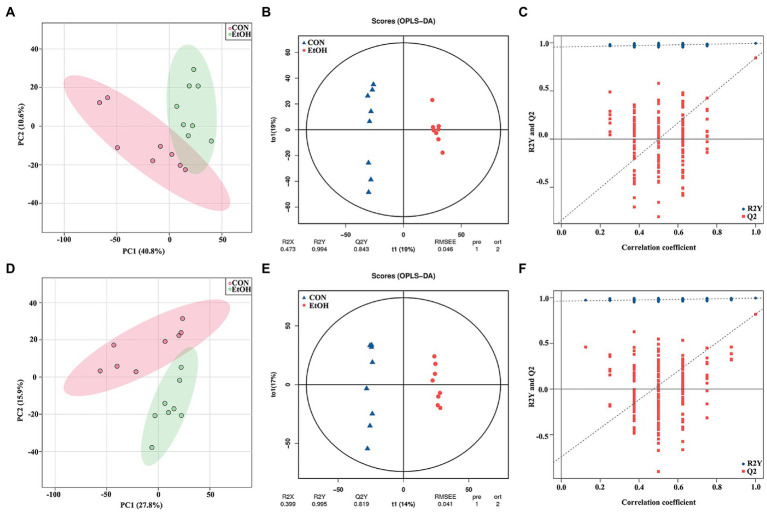
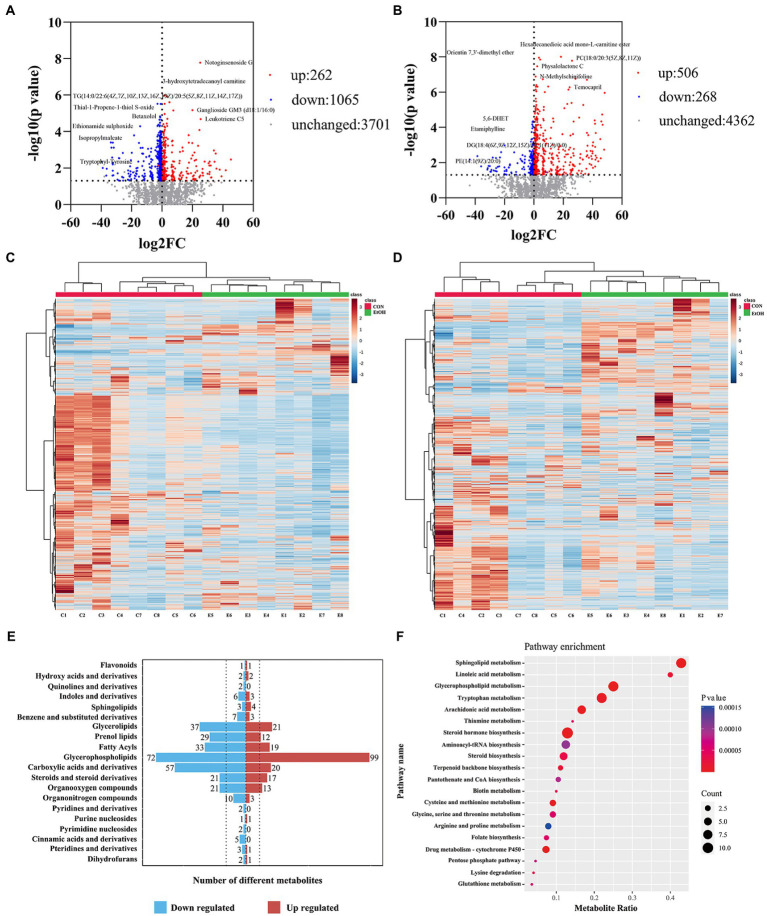
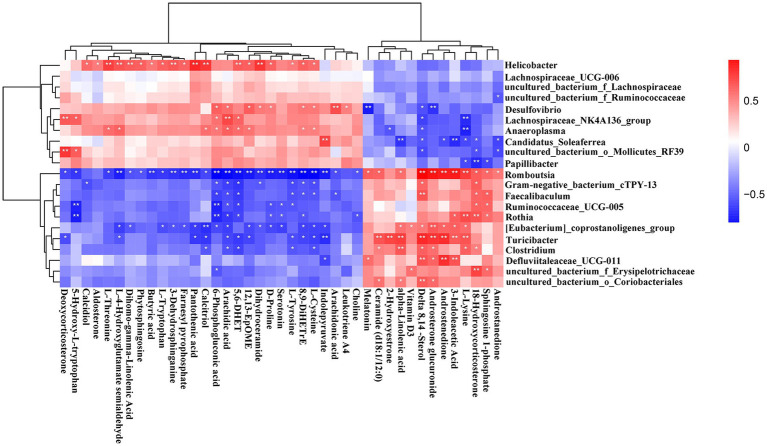
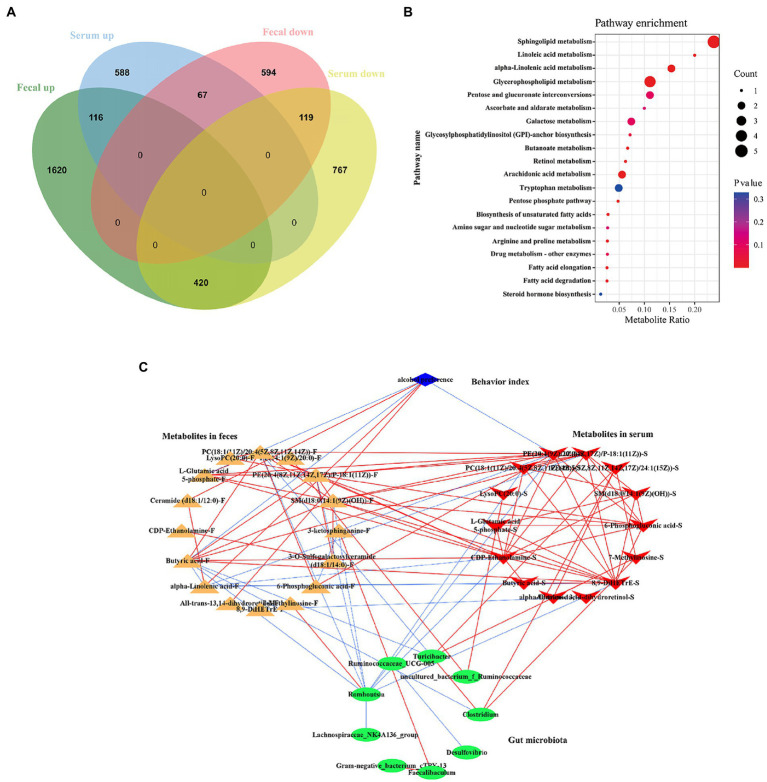
Results: Ethanol intake preference increased and maintained at a high level in experimental rats. Anxiety-like behaviors was observed by open field test and elevated plus maze test after ethanol withdraw, indicating that the AUD rat model was successfully developed. The full length 16S rRNA gene sequencing showed AUD significantly changed the β-diversity of gut microbial communities, and significantly decreased the microbial diversity but did not distinctly impact the microbial richness. Microbiota composition significantly changed in AUD rats, such as the abundance of Romboutsia and Turicibacter were significantly increased, whereas uncultured_bacterium_o_Mollicutes_RF39 was decreased. In addition, the untargeted metabolome analysis revealed that many metabolites in both feces and serum were altered in the AUD rats, especially involved in sphingolipid metabolism and glycerophospholipid metabolism pathways. Finally, multiple correlations among AUD behavior, gut microbiota and co-changed metabolites were identified, and the metabolites were directly correlated with the gut microbiota and alcohol preference.
Conclusion: The altered metabolites in feces and serum are important links between the gut microbiota dysbiosis and alcohol preference in AUD rats, and the altered gut microbiota and metabolites can be potentially new targets for treating AUD.
Keywords: alcohol preference; alcohol use disorder; fecal metabolites; gut microbiota; serum metabolites.
Copyright © 2023 Wang, Li, Bian, Bai, Yu, Gao, Zhao, Zhang and Zhao.
Conflict of interest statement
The authors declare that the research was conducted in the absence of any commercial or financial relationships that could be construed as a potential conflict of interest.
Figures
Similar articles
-
Fecal metabonomics combined with 16S rRNA gene sequencing to analyze the changes of gut microbiota in rats with kidney-yang deficiency syndrome and the intervention effect of You-gui pill.J Ethnopharmacol. 2019 Nov 15;244:112139. doi: 10.1016/j.jep.2019.112139. Epub 2019 Aug 8. J Ethnopharmacol. 2019. PMID: 31401318
-
Gut Microbial Dysbiosis and Changes in Fecal Metabolic Phenotype in Precancerous Lesions of Gastric Cancer Induced With N-Methyl-N'-Nitro-N-Nitrosoguanidine, Sodium Salicylate, Ranitidine, and Irregular Diet.Front Physiol. 2021 Nov 4;12:733979. doi: 10.3389/fphys.2021.733979. eCollection 2021. Front Physiol. 2021. PMID: 34803728 Free PMC article.
-
Comparative analysis of gut microbiota and fecal metabolome features among multiple depressive animal models.J Affect Disord. 2022 Oct 1;314:103-111. doi: 10.1016/j.jad.2022.06.088. Epub 2022 Jul 1. J Affect Disord. 2022. PMID: 35780963
-
Gut microbiota dysbiosis: The potential mechanisms by which alcohol disrupts gut and brain functions.Front Microbiol. 2022 Jul 29;13:916765. doi: 10.3389/fmicb.2022.916765. eCollection 2022. Front Microbiol. 2022. PMID: 35966709 Free PMC article. Review.
-
Gut microbiome in alcohol use disorder: Implications for health outcomes and therapeutic strategies-a literature review.World J Methodol. 2024 Mar 20;14(1):88519. doi: 10.5662/wjm.v14.i1.88519. eCollection 2024 Mar 20. World J Methodol. 2024. PMID: 38577203 Free PMC article. Review.
Cited by
-
Protection of Inonotus hispidus (Bull.) P. Karst. against Chronic Alcohol-Induced Liver Injury in Mice via Its Relieving Inflammation Response.Nutrients. 2023 Aug 10;15(16):3530. doi: 10.3390/nu15163530. Nutrients. 2023. PMID: 37630721 Free PMC article.
-
Salidroside ameliorates memory impairment following long-term ethanol intake in rats by modulating the altered intestinal microbiota content and hippocampal gene expression.Front Microbiol. 2023 Jun 9;14:1172936. doi: 10.3389/fmicb.2023.1172936. eCollection 2023. Front Microbiol. 2023. PMID: 37362918 Free PMC article.
-
Ferroptosis and gut microbiota: A new horizon in alcohol-associated liver disease management.Cell Mol Life Sci. 2025 Jul 19;82(1):282. doi: 10.1007/s00018-025-05815-5. Cell Mol Life Sci. 2025. PMID: 40682668 Free PMC article. Review.
-
Gut Microbiota Diversity of Local Egyptian Cattle Managed in Different Ecosystems.Animals (Basel). 2024 Sep 23;14(18):2752. doi: 10.3390/ani14182752. Animals (Basel). 2024. PMID: 39335341 Free PMC article.
-
Metagenomic comparison of intestinal microbiota between normal and liver fibrotic rhesus macaques (Macaca mulatta).Sci Rep. 2024 Jul 8;14(1):15677. doi: 10.1038/s41598-024-64397-7. Sci Rep. 2024. PMID: 38977718 Free PMC article.
References
LinkOut - more resources
Full Text Sources