

Video frame prediction of microbial growth with a recurrent neural network
- PMID: 36687639
- PMCID: PMC9850103
- DOI: 10.3389/fmicb.2022.1034586
Video frame prediction of microbial growth with a recurrent neural network
Abstract
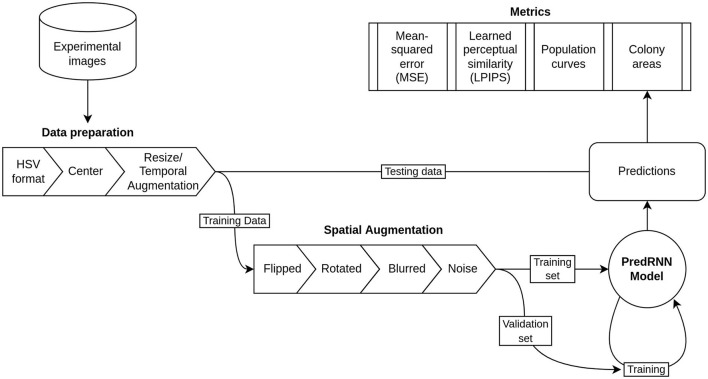
The recent explosion of interest and advances in machine learning technologies has opened the door to new analytical capabilities in microbiology. Using experimental data such as images or videos, machine learning, in particular deep learning with neural networks, can be harnessed to provide insights and predictions for microbial populations. This paper presents such an application in which a Recurrent Neural Network (RNN) was used to perform prediction of microbial growth for a population of two Pseudomonas aeruginosa mutants. The RNN was trained on videos that were acquired previously using fluorescence microscopy and microfluidics. Of the 20 frames that make up each video, 10 were used as inputs to the network which outputs a prediction for the next 10 frames of the video. The accuracy of the network was evaluated by comparing the predicted frames to the original frames, as well as population curves and the number and size of individual colonies extracted from these frames. Overall, the growth predictions are found to be accurate in metrics such as image comparison, colony size, and total population. Yet, limitations exist due to the scarcity of available and comparable data in the literature, indicating a need for more studies. Both the successes and challenges of our approach are discussed.
Keywords: Recurrent Neural Network; deep learning; machine learning; microbial growth; population growth; video frame prediction.
Copyright © 2023 Robertson, Wilmoth, Retterer and Fuentes-Cabrera.
Conflict of interest statement
MF-C and SR are employees of Oak Ridge National Lab which is managed by UT-Batelle. The remaining authors declare that the research was conducted in the absence of any commercial or financial relationships that could be construed as a potential conflict of interest.
Figures


Similar articles
-
Designing Interpretable Recurrent Neural Networks for Video Reconstruction via Deep Unfolding.IEEE Trans Image Process. 2021;30:4099-4113. doi: 10.1109/TIP.2021.3069296. Epub 2021 Apr 8. IEEE Trans Image Process. 2021. PMID: 33798083
-
Assessment of Automated Identification of Phases in Videos of Cataract Surgery Using Machine Learning and Deep Learning Techniques.JAMA Netw Open. 2019 Apr 5;2(4):e191860. doi: 10.1001/jamanetworkopen.2019.1860. JAMA Netw Open. 2019. PMID: 30951163 Free PMC article.
-
Deepfake attack prevention using steganography GANs.PeerJ Comput Sci. 2022 Oct 20;8:e1125. doi: 10.7717/peerj-cs.1125. eCollection 2022. PeerJ Comput Sci. 2022. PMID: 36426246 Free PMC article.
-
Data Integration Using Advances in Machine Learning in Drug Discovery and Molecular Biology.Methods Mol Biol. 2021;2190:167-184. doi: 10.1007/978-1-0716-0826-5_7. Methods Mol Biol. 2021. PMID: 32804365 Review.
-
Deep Learning with Microfluidics for Biotechnology.Trends Biotechnol. 2019 Mar;37(3):310-324. doi: 10.1016/j.tibtech.2018.08.005. Epub 2018 Oct 6. Trends Biotechnol. 2019. PMID: 30301571 Review.
References
-
- Bradski G. (2000). The opencv library. Dr. Dobbs J. 25, 120–123.
-
- Halsted M., Wilmoth J. L., Briggs P. A., Hansen R. R., Briggs D. P., Timm A. C., et al. . (2016). Development of transparent microwell arrays for optical monitoring and dissection of microbial communities. J. Vacuum Sci. Technol. B 34, e06KI03. 10.1116/1.4962739 - DOI
LinkOut - more resources
Full Text Sources