. 2023 Jan 4:9:1068350.
doi: 10.3389/fnut.2022.1068350. eCollection 2022.

Consumption of a high-fat diet alters transcriptional rhythmicity in liver from pubertal mice

Affiliations

Consumption of a high-fat diet alters transcriptional rhythmicity in liver from pubertal mice

Lin Yan et al. Front Nutr. .

Abstract

Introduction: Childhood obesity is associated with adult obesity, which is a risk factor for chronic diseases. Obesity, as an environmental cue, alters circadian rhythms. The hypothesis of this study was that consumption of a high-fat diet alters metabolic rhythms in pubertal mice.

Methods: Weanling female C57BL/6NHsd mice were fed a standard AIN93G diet or a high-fat diet (HFD) for 3 weeks. Livers were collected from six-week-old mice every 4 h over a period of 48 h for transcriptome analysis.

Results and discussion: The HFD altered rhythmicity of differentially rhythmic transcripts in liver. Specifically, the HFD elevated expression of circadian genes Clock, Per1, and Cry1 and genes encoding lipid metabolism Fads1 and Fads2, while decreased expression of circadian genes Bmal1 and Per2 and lipid metabolism genes Acaca, Fasn, and Scd1. Hierarchical clustering analysis of differential expression genes showed that the HFD-mediated metabolic disturbance was most active in the dark phase, ranging from Zeitgeber time 16 to 20. The Kyoto Encyclopedia of Genes and Genomes enrichment analysis of differentially expressed genes showed that the HFD up-regulated signaling pathways related to fatty acid and lipid metabolism, steroid and steroid hormone biosynthesis, amino acid metabolism and protein processing in the endoplasmic reticulum, glutathione metabolism, and ascorbate and aldarate metabolism in the dark phase. Down-regulations included MAPK pathway, lipolysis in adipocytes, Ras and Rap1 pathways, and pathways related to focal adhesion, cell adhesion molecules, and extracellular matrix-receptor interaction. In summary, the HFD altered metabolic rhythms in pubertal mice with the greatest alterations in the dark phase. These alterations may disrupt metabolic homeostasis in puberty and lead to metabolic disorders.

Keywords: circadian rhythms; diet; metabolism; mice; puberty.


Conflict of interest statement

The authors declare that the research was conducted in the absence of any commercial or financial relationships that could be construed as a potential conflict of interest.

Figures
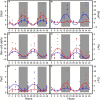
FIGURE 1
FIGURE 1
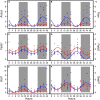
Hepatic expression of Clock (A), Bmal1 (B), Rev-erbα (C), Per1 (D), Per2 (E), and Cry1 (F) in pubertal mice fed the AIN93G or high-fat diet (n = 5 per time point per group). Values from mice terminated in the light phase are fold changes to the AIN93G group at ZT 0 and that from mice terminated in the dark phase are fold changes to AIN93G group at ZT 12. Open background: light phase; gray background: dark phase; blue: AIN93G diet; red: high-fat diet. The rhythm curves were generated by using the Cosinor model y = Mesor + amplitude × Cos [2π/24 × (t–acrophase)].
FIGURE 2
FIGURE 2
Hepatic expression of Acaca (A), Fasn (B), Fads1 (C), Fads2 (D), Scd1 (E), and Srebf1 (F) in pubertal mice fed the AIN93G or high-fat diet (n = 5 per time point per group). Values from mice terminated in the light phase are fold changes to the AIN93G group at ZT 0 and that from mice terminated in the dark phase are fold changes to AIN93G group at ZT 12. Open background: light phase; gray background: dark phase; blue: AIN93G diet; red: high-fat diet. The rhythm curves were generated by using the Cosinor model y = Mesor + amplitude × Cos [2π/24 × (t–acrophase)].
FIGURE 3
FIGURE 3
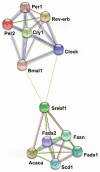
Protein-protein interaction network analysis of circadian genes and genes encoding lipid metabolism in liver from pubertal mice fed the AIN93G or high-fat diet. formula image from curated databases; formula image from expirermentally determined; formula image from text mining; formula image from protein homology; formula image from co-expression; formula image from gene neighborhood; formula image from gene fusions. The analysis was performed by using the STRING database (http://string-db.org).
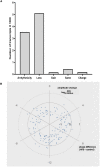
FIGURE 4
FIGURE 4
(A) Categorization of differentially rhythmic transcripts identified in this study: Arrhythmicity, Loss: loss of rhythms, Gain: gain of rhythms, Same: same rhythms, and Change: change of rhythms. (B) Circular plot representing the amplitude and phase changes in differentially rhythmic transcripts between the AIN93G and HFD groups.
FIGURE 5
FIGURE 5
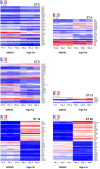
Hierarchical clustering heatmap of differentially expressed genes in liver from pubertal mice that are significantly altered by the high-fat diet. The 40 most differentially expressed genes are reported for ZT 0, 8, 16, and 20. Data not shown for ZT 24 (no significant differences in differentially expressed genes between the two groups). The color ranging from red to blue indicates that log2(FPKM+1) values are from large to small (n = 3 from each time point per group).
FIGURE 6
FIGURE 6
The upregulated and downregulated pathways and biological functions by the KEGG enrichment analysis of differentially expressed genes that are significantly altered by the high-fat diet in liver from pubertal mice for ZT 0, 4, 8, and 12 (adjusted p ≤ 0.05, n = 3 from each timepoint per group). Data not shown for downregulations at ZT 12 (no significant differences in KEGG terms between the two groups). Up: upregulated; Down: downregulated. Numbers in paratheses are numbers of differentially expressed genes identified. ABC transporters: ATP binding cassette transporters; ER: endoplasmic reticulum; PPAR: peroxisome proliferator-activated receptors; UFA: unsaturated fatty acids.
FIGURE 7
FIGURE 7
The upregulated and downregulated pathways and biological functions by the KEGG enrichment analysis of differentially expressed genes that are significantly altered by the high-fat diet in liver from pubertal mice for ZT 16, 20, and 24 (adjusted p ≤ 0.05, n = 3 from each timepoint per group). The 20 most upregulated and 20 most downregulated KEGG terms are reported for ZT 16 and 20. Data not shown for downregulations at ZT 24 (no significant differences in KEGG terms between the two groups). Up: upregulated; Down: downregulated. Numbers in paratheses are numbers of differentially expressed genes identified. AGE-RAGE signaling pathway: advanced glycation endproducts-receptors for advanced glycation endproducts signaling pathway in diabetic complications; cGMP-PKG: cGMP-protein kinase G; CYP: cytochrome P450; ECM: extracellular matrix; ER: endoplasmic reticulum; MAPK: mitogen-activated protein kinase; PI3K-AKT: Phosphatidylinositol 3-kinase-protein kinase B; Th1 and Th2 cell differentiation: type 1 T helper and type 2 T helper cell differentiation.

Similar articles

Cited by

References

    1. GBD Obesity Collaborators, Afshin A, Forouzanfar M, Reitsma M, Sur P, Estep K, et al. Health effects of overweight and obesity in 195 countries over 25 years. N Engl J Med. (2017) 377:13–27. 10.1056/NEJMoa1614362 - DOI - PMC - PubMed
    1. Fryar C, Carroll M, Afful J. Division of HEalth and NUtrition Examination Surveys. Prevalence of Overweight, Obesity, and Severe Obesity among Children and Adolescents Aged 2-19 Years: United States, 1963-1965 through 2017-2018. NCHS Health E-Stats. (2020). Available online at: https://www.cdc.gov/nchs/products/index.htm (accessed April 16, 2022).
    1. Simmonds M, Llewellyn A, Owen C, Woolacott N. Predicting adult obesity from childhood obesity: a systematic review and meta-analysis. Obes Rev. (2016) 17:95–107. 10.1111/obr.12334 - DOI - PubMed
    1. Baker J, Olsen L, Sorensen T. Childhood body-mass index and the risk of coronary heart disease in adulthood. N Engl J Med. (2007) 357:2329–37. - PMC - PubMed
    1. Llewellyn A, Simmonds M, Owen C, Woolacott N. Childhood obesity as a predictor of morbidity in adulthood: a systematic review and meta-analysis. Obes Rev. (2016) 17:56–67. 10.1111/obr.12316 - DOI - PubMed