

Impact of malnutrition evaluated by the mini nutritional assessment on the prognosis of acute hospitalized older adults
- PMID: 36687683
- PMCID: PMC9849807
- DOI: 10.3389/fnut.2022.1046985
Impact of malnutrition evaluated by the mini nutritional assessment on the prognosis of acute hospitalized older adults
Abstract
Background: Malnutrition is prevalent among hospitalized older patients. Therefore, this study aimed to investigate the association between nutritional status [assessed using the Mini Nutritional Assessment (MNA) and serum albumin levels] and adverse outcomes in hospitalized older patients. We also aimed to compare the predictive utility of our findings.
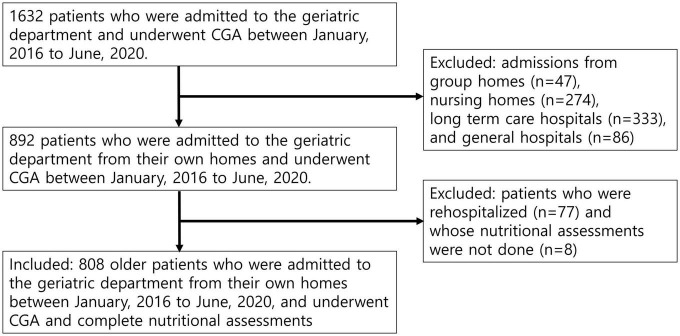
Methods: This retrospective cohort study was conducted between January 2016 and June 2020. In total, 808 older patients (aged ≥ 65 years, mean age 82.8 ± 6.70 years, 45.9% male) admitted to the acute geriatric unit were included in our sample. Comprehensive geriatric assessments, including the MNA, were performed. Malnutrition and risk of malnutrition were defined as MNA < 17, albumin < 3.5 g/dL and 17 ≤ MNA ≤ 24, 3.5 g/dL ≤ albumin < 3.9 g/dL, respectively. The primary outcome was that patients could not be discharged to their own homes. The secondary outcomes were overall all-cause mortality, 3-month all-cause mortality, and incidence of geriatric syndrome, including delirium, falls, and newly developed or worsening pressure sores during hospitalization.
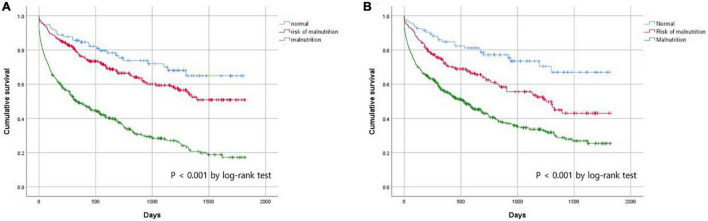
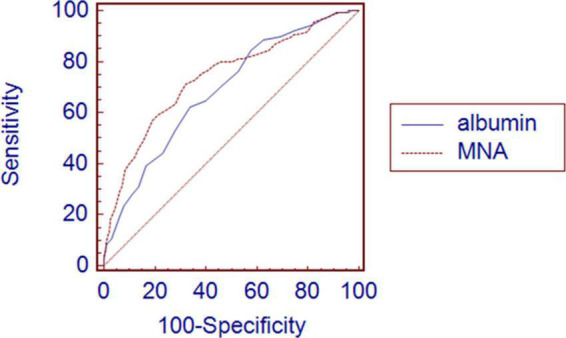
Results: Poor nutritional status was associated with older age; female sex; admission from the emergency room; high risk of pressure sores and falls; lower physical and cognitive function; higher depressive score; and lower serum albumin, protein, cholesterol, and hemoglobin levels. In the fully adjusted model, malnutrition assessed using the MNA predicted discharge to nursing homes or long-term care hospitals [odds ratio (OR) 5.822, 95% confidence interval (CI): 2.092-16.199, P = 0.001], geriatric syndrome (OR 2.069, 95% CI: 1.007-4.249, P = 0.048), and 3-month mortality (OR 3.519, 95% CI: 1.254-9.872, P = 0.017). However, malnutrition assessed using albumin levels could only predict 3-month mortality (OR 3.848, 95% CI: 1.465-10.105, P = 0.006). The MNA predicted 3-month mortality with higher precision than serum albumin levels (P = 0.034) when comparing the areas under the receiver operating characteristic curve.
Conclusion: Nutritional risk measured by the MNA was an independent predictor of various negative outcomes in hospitalized older patients. Poor nutritional status assessed by serum albumin levels, the most widely used biochemical marker, could predict mortality, but not the development of geriatric syndrome or discharge location reflecting functional status.
Keywords: discharge location; geriatric syndrome; mini nutritional assessment; nutrition; serum albumin.
Copyright © 2023 Kang, Choi, Yoo, Park, Kim, Kim, Kim, Kim and Kim.
Conflict of interest statement
The authors declare that the research was conducted in the absence of any commercial or financial relationships that could be construed as a potential conflict of interest.
Figures
Similar articles
-
Predictive Value of Nutritional Risk Screening 2002 and Mini Nutritional Assessment Short Form in Mortality in Chinese Hospitalized Geriatric Patients.Clin Interv Aging. 2020 Mar 20;15:441-449. doi: 10.2147/CIA.S244910. eCollection 2020. Clin Interv Aging. 2020. PMID: 32256059 Free PMC article.
-
Geriatric Nutrition Risk Index is comparable to the mini nutritional assessment for assessing nutritional status in elderly hospitalized patients.Clin Nutr ESPEN. 2019 Feb;29:77-85. doi: 10.1016/j.clnesp.2018.12.002. Epub 2018 Dec 21. Clin Nutr ESPEN. 2019. PMID: 30661705
-
[Nutritional status in older adults admitted to an acute geriatric unit].Nutr Hosp. 2020 Apr 16;37(2):260-266. doi: 10.20960/nh.03005. Nutr Hosp. 2020. PMID: 32124619 Spanish.
-
Prognostic Role of Serum Albumin, Total Lymphocyte Count, and Mini Nutritional Assessment on Outcomes After Geriatric Hip Fracture Surgery: A Meta-Analysis and Systematic Review.J Arthroplasty. 2019 Jun;34(6):1287-1296. doi: 10.1016/j.arth.2019.02.003. Epub 2019 Feb 11. J Arthroplasty. 2019. PMID: 30852065
-
Identifying the elderly at risk for malnutrition. The Mini Nutritional Assessment.Clin Geriatr Med. 2002 Nov;18(4):737-57. doi: 10.1016/s0749-0690(02)00059-9. Clin Geriatr Med. 2002. PMID: 12608501 Review.
Cited by
-
Cardiovascular Risk Factors as Predictors of Nutritional Status in Older Mexican Adults.Nutrients. 2024 Aug 12;16(16):2662. doi: 10.3390/nu16162662. Nutrients. 2024. PMID: 39203799 Free PMC article.
-
Systematic Review and Meta-Analysis: Malnutrition and In-Hospital Death in Adults Hospitalized with COVID-19.Nutrients. 2023 Mar 6;15(5):1298. doi: 10.3390/nu15051298. Nutrients. 2023. PMID: 36904295 Free PMC article.
-
Predicting the unseen: nutritional interventions as a key to combat frailty.Front Nutr. 2025 Jul 9;12:1575922. doi: 10.3389/fnut.2025.1575922. eCollection 2025. Front Nutr. 2025. PMID: 40704314 Free PMC article.
-
Nutritional status and triglyceride-glucose index influence delirium in elderly heart failure patients.Sci Rep. 2024 Oct 24;14(1):25235. doi: 10.1038/s41598-024-77573-6. Sci Rep. 2024. PMID: 39448708 Free PMC article.
References
LinkOut - more resources
Full Text Sources