

Western diet augments metabolic and arterial dysfunction in a sex-specific manner in outbred, genetically diverse mice
- PMID: 36687716
- PMCID: PMC9853899
- DOI: 10.3389/fnut.2022.1090023
Western diet augments metabolic and arterial dysfunction in a sex-specific manner in outbred, genetically diverse mice
Abstract
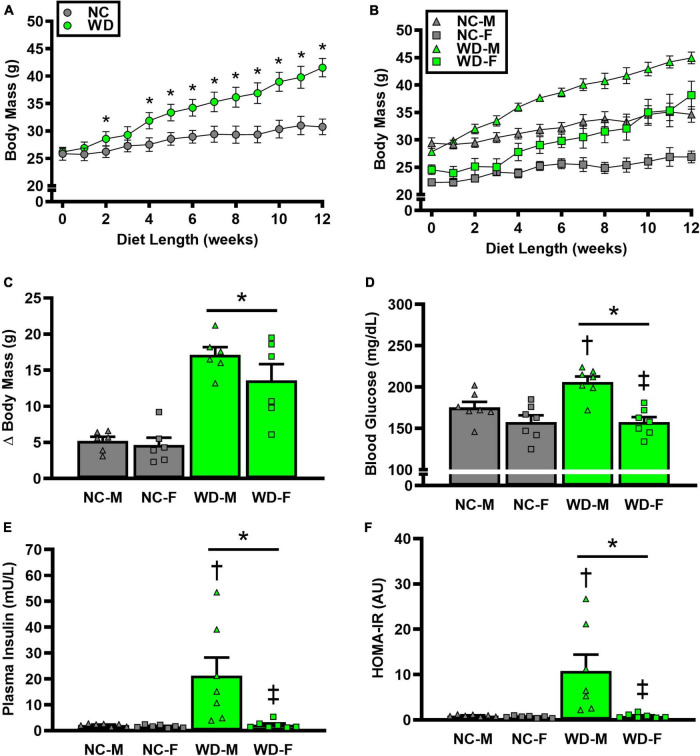
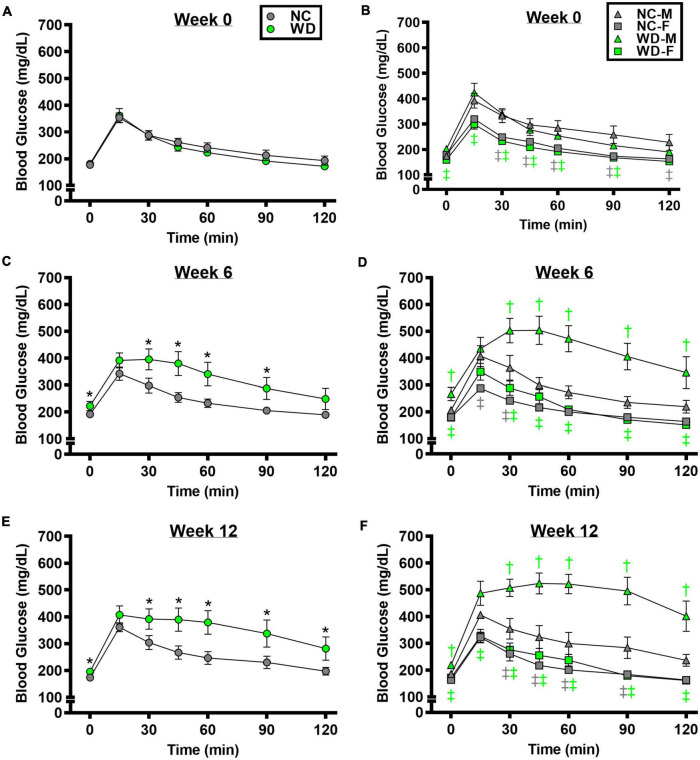
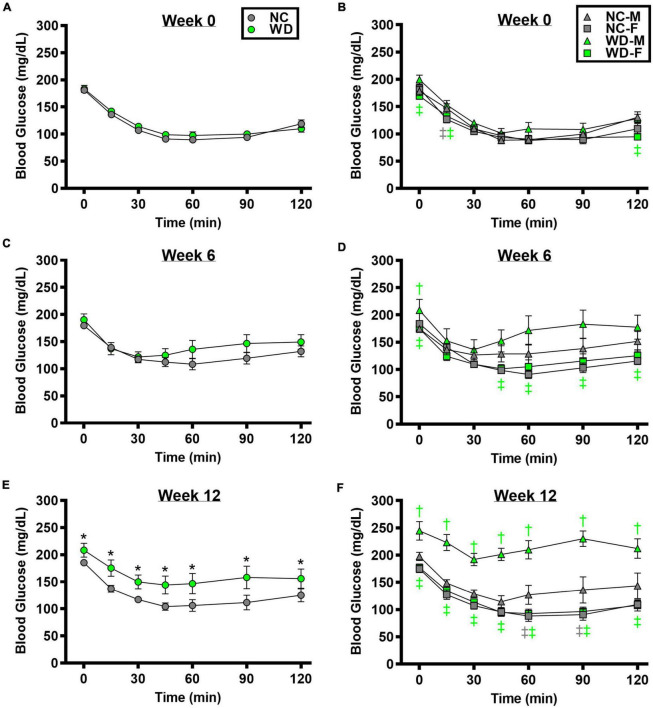
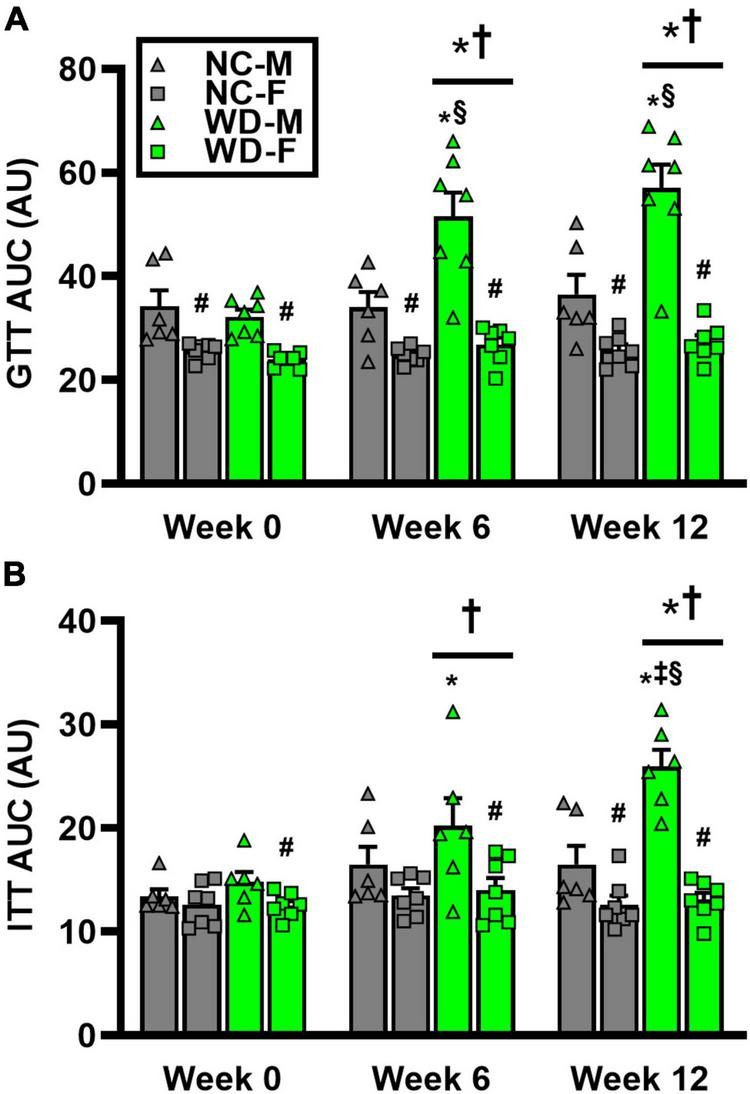
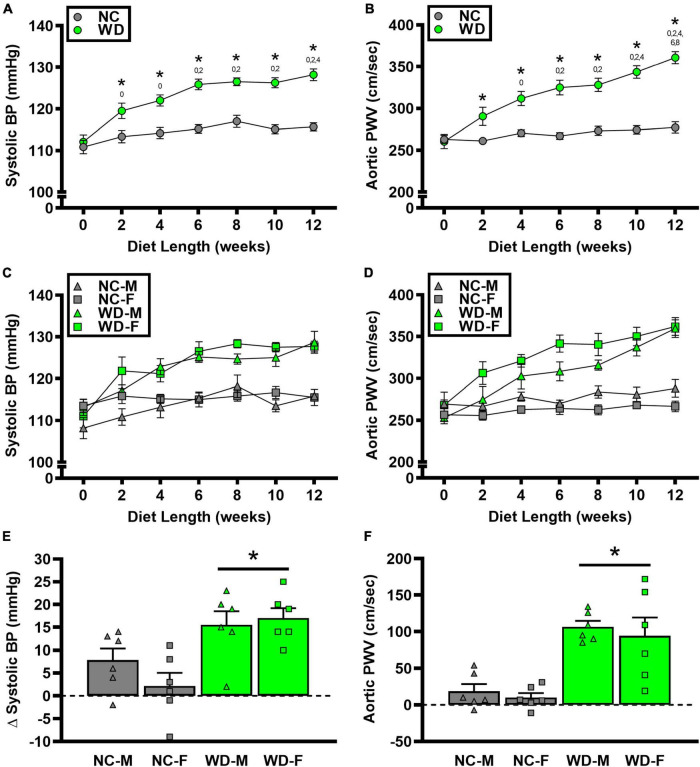
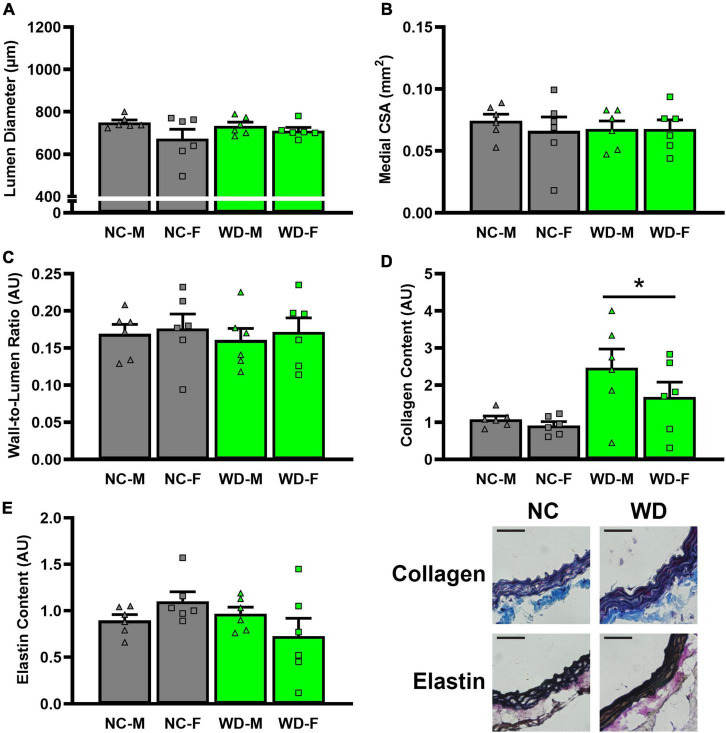
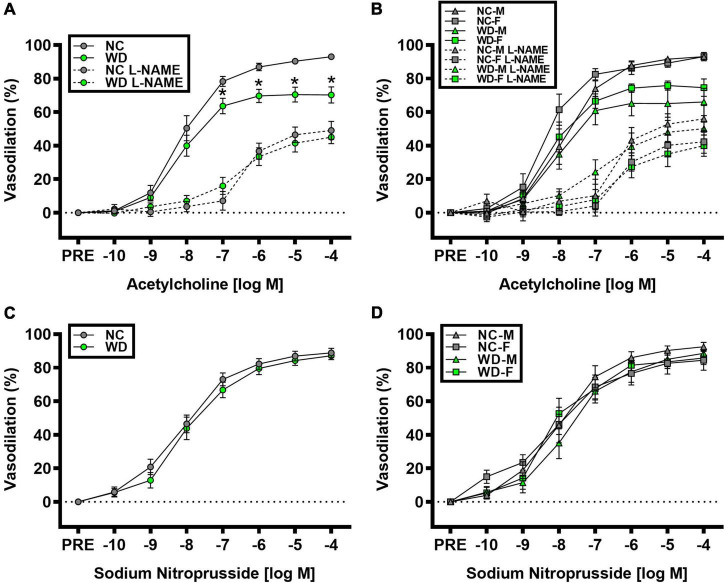
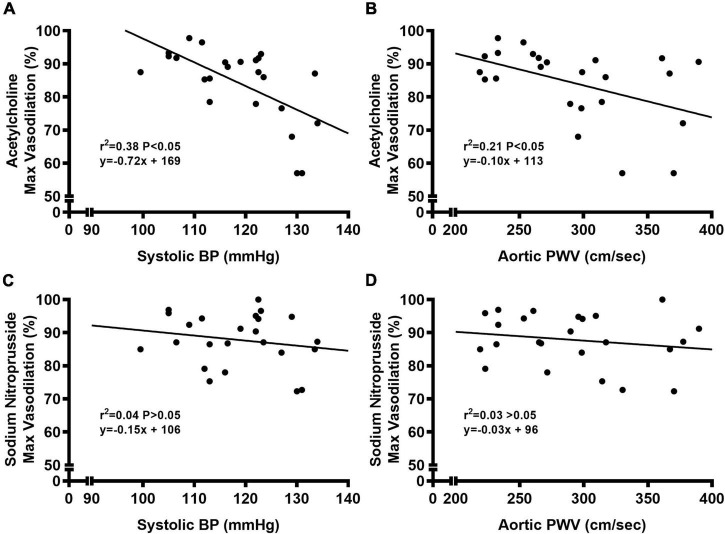
Western diet (WD), characterized by excess saturated fat and sugar intake, is a major contributor to obesity and metabolic and arterial dysfunction in humans. However, these phenotypes are not consistently observed in traditional inbred, genetically identical mice. Therefore, we sought to determine the effects of WD on visceral adiposity and metabolic/arterial function in UM-HET3 mice, an outbred, genetically diverse strain of mice. Male and female UM-HET3 mice underwent normal chow (NC) or WD for 12 weeks. Body mass and visceral adiposity were higher in WD compared to NC (P < 0.05). Female WD mice had greater visceral adiposity than male WD mice (P < 0.05). The results of glucose and insulin tolerance tests demonstrated that metabolic function was lower in WD compared to NC mice (P < 0.05). Metabolic dysfunction in WD as was driven by male mice, as metabolic function in female WD mice was unchanged (P > 0.05). Systolic blood pressure (BP) and aortic stiffness were increased in WD after 2 weeks compared to baseline and continued to increase through week 12 (P < 0.05). Systolic BP and aortic stiffness were higher from weeks 2-12 in WD compared to NC (P < 0.05). Aortic collagen content was higher in WD compared to NC (P < 0.05). Carotid artery endothelium-dependent dilation was lower in WD compared to NC (P < 0.05). These data suggest sex-related differences in visceral adiposity and metabolic dysfunction in response to WD. Despite this, arterial dysfunction was similar in male and female WD mice, indicating this model may provide unique translational insight into similar sex-related observations in humans that consume WD.
Keywords: aorta; arterial function; blood pressure; endothelium; fat; metabolic function; sugar.
Copyright © 2023 Zheng, Li, Berg Sen, Samarah, Deacon, Bernardo and Machin.
Conflict of interest statement
The authors declare that the research was conducted in the absence of any commercial or financial relationships that could be construed as a potential conflict of interest.
Figures
Similar articles
-
High-salt diet augments systolic blood pressure and induces arterial dysfunction in outbred, genetically diverse mice.Am J Physiol Heart Circ Physiol. 2023 Apr 1;324(4):H473-H483. doi: 10.1152/ajpheart.00415.2022. Epub 2023 Feb 3. Am J Physiol Heart Circ Physiol. 2023. PMID: 36735405 Free PMC article.
-
Microcirculatory and glycocalyx properties are lowered by high-salt diet but augmented by Western diet in genetically heterogeneous mice.Am J Physiol Heart Circ Physiol. 2022 Feb 1;322(2):H328-H335. doi: 10.1152/ajpheart.00656.2021. Epub 2022 Jan 7. Am J Physiol Heart Circ Physiol. 2022. PMID: 34995168 Free PMC article.
-
Differential effects of Western diet and traumatic muscle injury on skeletal muscle metabolic regulation in male and female mice.J Cachexia Sarcopenia Muscle. 2023 Dec;14(6):2835-2850. doi: 10.1002/jcsm.13361. Epub 2023 Oct 25. J Cachexia Sarcopenia Muscle. 2023. PMID: 37879629 Free PMC article.
-
Aging compounds western diet-associated large artery endothelial dysfunction in mice: prevention by voluntary aerobic exercise.Exp Gerontol. 2013 Nov;48(11):1218-25. doi: 10.1016/j.exger.2013.08.001. Epub 2013 Aug 13. Exp Gerontol. 2013. PMID: 23954368 Free PMC article.
-
Sirt1 overexpression attenuates Western-style diet-induced aortic stiffening in mice.Physiol Rep. 2022 May;10(9):e15284. doi: 10.14814/phy2.15284. Physiol Rep. 2022. PMID: 35561022 Free PMC article.
Cited by
-
Patching up a degraded endothelial glycocalyx in sepsis.Am J Physiol Heart Circ Physiol. 2023 Oct 1;325(4):H673-H674. doi: 10.1152/ajpheart.00499.2023. Epub 2023 Aug 18. Am J Physiol Heart Circ Physiol. 2023. PMID: 37594482 Free PMC article. No abstract available.
-
TcMAC21 mouse model recapitulates abnormal vascular physiology observed in humans with Down syndrome.Physiol Rep. 2025 Jun;13(11):e70384. doi: 10.14814/phy2.70384. Physiol Rep. 2025. PMID: 40474784 Free PMC article.
-
High-salt diet augments systolic blood pressure and induces arterial dysfunction in outbred, genetically diverse mice.Am J Physiol Heart Circ Physiol. 2023 Apr 1;324(4):H473-H483. doi: 10.1152/ajpheart.00415.2022. Epub 2023 Feb 3. Am J Physiol Heart Circ Physiol. 2023. PMID: 36735405 Free PMC article.
-
Therapeutic strategies targeting the endothelial glycocalyx.Curr Opin Clin Nutr Metab Care. 2023 Nov 1;26(6):543-550. doi: 10.1097/MCO.0000000000000973. Epub 2023 Aug 9. Curr Opin Clin Nutr Metab Care. 2023. PMID: 37555800 Free PMC article. Review.
-
Hypertension Related Co-Morbidities and Complications in Women of Sub-Saharan Africa: A Brief Review.Circ Res. 2024 Feb 16;134(4):459-473. doi: 10.1161/CIRCRESAHA.123.324077. Epub 2024 Feb 15. Circ Res. 2024. PMID: 38359096 Free PMC article. Review.
References
Grants and funding
LinkOut - more resources
Full Text Sources
Molecular Biology Databases