. 2023 Jan 5:16:1068736.
doi: 10.3389/fnbeh.2022.1068736. eCollection 2022.

Therapeutic effect of combination vitamin D3 and siponimod on remyelination and modulate microglia activation in cuprizone mouse model of multiple sclerosis

Affiliations

Therapeutic effect of combination vitamin D3 and siponimod on remyelination and modulate microglia activation in cuprizone mouse model of multiple sclerosis

Kholoud M Al-Otaibi et al. Front Behav Neurosci. .

Abstract

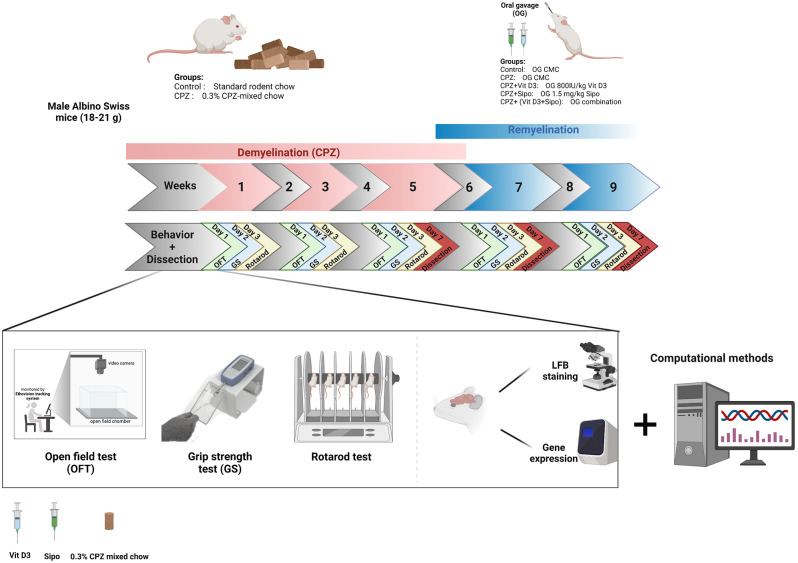
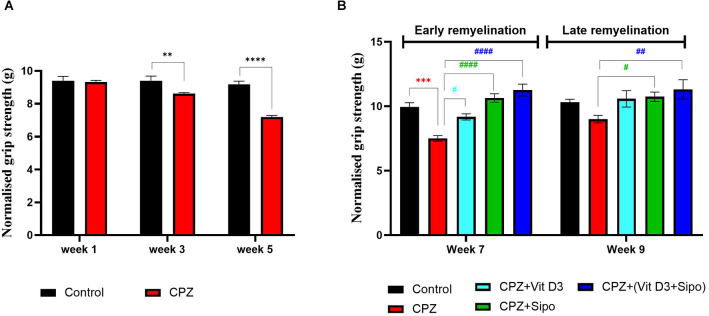
Stimulation of remyelination is critical for the treatment of multiple sclerosis (MS) to alleviate symptoms and protect the myelin sheath from further damage. The current study aimed to investigate the possible therapeutic effects of combining vitamin D3 (Vit D3) and siponimod (Sipo) on enhancing remyelination and modulating microglia phenotypes in the cuprizone (CPZ) demyelination mouse model. The study was divided into two stages; demyelination (first 5 weeks) and remyelination (last 4 weeks). In the first 5 weeks, 85 mice were randomly divided into two groups, control (n = 20, standard rodent chow) and CPZ (n = 65, 0.3% CPZ mixed with chow for 6 weeks, followed by 3 weeks of standard rodent chow). At week 5, the CPZ group was re-divided into four groups (n = 14) for remyelination stages; untreated CPZ (0.2 ml of CMC orally), CPZ+Vit D3 (800 IU/kg Vit D3 orally), CPZ+Sipo (1.5 mg/kg Sipo orally), and CPZ+Vit D3 (800 IU/kg Vit D3) + Sipo (1.5 mg/kg Sipo orally). Various behavioral tasks were performed to evaluate motor performance. Luxol Fast Blue (LFB) staining, the expression level of myelin basic protein (MBP), and M1/M2 microglia phenotype genes were assessed in the corpus callosum (CC). The results showed that the combination of Vit D3 and Sipo improved behavioral deficits, significantly promoted remyelination, and modulated expression levels of microglia phenotype genes in the CC at early and late remyelination stages. These results demonstrate for the first time that a combination of Vit D3 and Sipo can improve the remyelination process in the cuprizone (CPZ) mouse model by attenuating the M1 microglia phenotype. This may help to improve the treatment of MS patients.

Keywords: cuprizone; microglia markers; multiple scleorsis; remyelination; siponimod; vitamin D3.


Conflict of interest statement

The authors declare that the research was conducted in the absence of any commercial or financial relationships that could be construed as a potential conflict of interest.

Figures

Figure 1
Figure 1
Timeline of the study and experimental design. CPZ, cuprizone; CMC, carboxymethyl cellulose; Vit D3, vitamin D3; Sipo, siponimod; OFT, open field test; GS, grip strength; LFB, Luxol fast blue. Created with https://biorender.com.
Figure 2
Figure 2
Body weight changes (%) of mice through experiment weeks. (A) Effects of CPZ on body weight changes (%) during the demyelination stage. (B) Effects of Vit D3, Sipo, and their combination on body weight changes (%) during remyelination stages. Data are presented as the mean ± SEM; two-way ANOVA followed by Šídák’s multiple comparisons test was used (A), and two-way ANOVA followed by Tukey’s multiple comparisons test was used (B). CPZ, cuprizone; Vit D3, vitamin D3; Sipo, siponimod. (*) Indicates a significant difference vs. the control group; (#) indicates a significant difference vs. CPZ group. *p < 0.05, **p < 0.01, ****p < 0.0001, #p < 0.05, ##p < 0.01, and ###p < 0.001.
Figure 3
Figure 3
Locomotor activity. (A,B) Effects of the CPZ on the TDM and velocity in the OFT during the demyelination stage, respectively. (C,D) Effects of Vit D3, Sipo, and their combination on the TDM and velocity in OFT during (early and late) remyelination stages, respectively. Data are presented as the mean ± SEM; two-way ANOVA followed by Šídák’s multiple comparisons test was used (A,B), and two-way ANOVA followed by Tukey’s multiple comparisons test was used (C,D). (E) Representative images displaying typical examples of locomotor activity in an OFT in all groups during the different study stages. CPZ, cuprizone; Vit D3, vitamin D3; Sipo, siponimod. (*) Indicates a significant difference vs. the control group; (#) indicates a significant difference vs. the CPZ group. *p < 0.05, **p < 0.01, ***p < 0.001, ****p < 0.0001, and # p < 0.05.
Figure 4
Figure 4
Grip strength test. (A) Effects of CPZ on the grip strength during demyelination stage. (B) Effects of different treatments on the mice grip strength during (early and late) remyelination stages. Data are represented as the mean ± SEM, and two-way ANOVA was used followed by Šídák’s and Tukey’s multiple comparisons tests (A,B) were used, respectively. CPZ, cuprizone; Vit D3, vitamin D3; Sipo: siponimod. (*) Indicates a significant difference vs. the control group; (#) indicates a significant difference vs. CPZ group. **p < 0.01, ***p < 0.001, ****p < 0.0001, #p < 0.05, ##p < 0.01 and ####p < 0.0001.
Figure 5
Figure 5
Rotarod test. (A) Effects of CPZ on the motor coordination and balance in the rotarod test during the demyelination stage. (B) Effects of different treatments on the motor coordination and balance in the rotarod test during early and late remyelination stages. Data are represented as the mean ± SEM, and two-way ANOVA was used followed by Šídák’s and Tukey’s multiple comparisons tests (A,B) were used, respectively. CPZ, cuprizone; Vit D3, vitamin D3; Sipo, siponimod. (*) Indicates a significant difference vs. the control group; (#) indicates a significant difference vs. CPZ group. **p < 0.01, ****p < 0.0001, #p < 0.05, and ##p < 0.01.
Figure 6
Figure 6
Evaluation of myelin content in sagittal sections of the CC using LFB staining and quantitative analysis of myelination area during de- and re-myelination stages. (A) Representative image of the CC using LFB staining during the demyelination stage in the control and CPZ group. (B) Percentage of myelination area in CC during the demyelination stage. (C,E) Representative images of LFB CC at the early and late remyelination stage in control and all treated groups, respectively. (D,F) Percentage of myelination area in CC during the early and late remyelination stage, respectively. CPZ administration for 5 weeks caused severe demyelination in the CC compared with the control mice. In contrast, different treatment groups ameliorated myelin injury and enhanced myelination in CC during remyelination stages. Data for Imag j are represented as the mean ± SEM; the t-test was used in (B), and one-way ANOVA followed by the Tukey’s multiple comparisons test was used in (D,F). Scale bars: 50 μm. CPZ, cuprizone; Vit D3, vitamin D3; Sipo, siponimod. (*) Indicates a significant difference vs. the control group; (#) indicates a significant difference vs. CPZ group. ***p < 0.001, ****p < 0.0001, ##p < 0.01, ###p < 0.001, and ####p < 0.0001.
Figure 7
Figure 7
Network of expressed genes that related to M1/M2 microglia phenotype and myelination with receptors of Vit D3 and Sipo. VDR, MBP, S1PR5, S1PR1, MMP-9, Arg-1, IGF-1, iNOS, IL-1β, showing 20 related genes and 239 total links. VDR, vitamin D (1,25-dihydroxyvitamin D3) receptor; MBP, myelin basic protein; S1PR5, sphingosine-1-phosphate receptor 5; S1PR1, sphingosine-1-phosphate receptor 1; MMP9, matrix metallopeptidase 9; Arg1, arginase; IGF1, insulin-like growth factor 1; iNOS, inducible nitric oxide synthase; IL-1β, interleukin 1 beta; Arg2, arginase type II; S1PR2, sphingosine-1-phosphate receptor 2; S1PR3, sphingosine-1-phosphate receptor 3; Agmat, agmatine ureohydrolase; S1PR4, sphingosine-1-phosphate receptor 4; Rln3, relaxin 3; IGF-2, insulin-like growth factor 2; Insl3, insulin-like 3; Il1a, interleukin 1 alpha; Insl6, insulin-like 6; Insl5, insulin-like 5; Ins2, insulin II; Ins1, insulin I; Nos3, nitric oxide synthase 3, endothelial cell, Ndor1, NADPH dependent diflavin oxidoreductase 1; Mtrr, 5-methyltetrahydrofolate-homocysteine methyltransferase reductase; Rln1, relaxin 1; Il1rn, interleukin 1 receptor antagonist; Por, P450 (cytochrome) oxidoreductase; Nos1, nitric oxide synthase 1, neuronal. The nature of the identified interaction was indicated by the color of the line as seen in figure.
Figure 8
Figure 8
mRNA expression level of iNOS, IL-1β, IGF-1, and MBP in the CC. (A,D,G,J) Effects of CPZ on relative expression level of iNOS, IL-1β, IGF-1, and MBP in the CC of mice during demyelination stage, respectively. (B,C,E,F,H,I,K,L) Effects of Vit D3 and Sipo on relative expression level of iNOS, IL-1β, IGF-1, and MBP in the CC of mice during early and late remyelination stages, respectively. Data are represented as means ± SEM and t-test was used in (A,D,G,J) and One-way ANOVA followed by Tukey’s test was used in (B,C,E,F,H,I,K,L). iNOS, inducible nitric oxide synthase; IL-1β, interleukin 1 beta; IGF-1, insulin-like growth factor 1; MBP, myelin basic protein; GAPDH, glyceraldehyde-3-phosphate dehydrogenase; CPZ, cuprizone; Vit D3, vitamin D3; Sipo, siponimod. (*) Indicates a significant difference vs. the control group; (#) indicates a significant difference vs. CPZ group. *p < 0.05, **p < 0.01, ***p < 0.001, ****p < 0.0001, #p < 0.05, ##p < 0.01, ###p < 0, 001, and ####p < 0.0001.
Figure 9
Figure 9
Interaction between iNOS and (A) L-Arginine, (B) Vit D3, and (C) Sipo at the binding site, represented as 3D and 2D, respectively. Green spoked arcs represent hydrogen bonds, and brick red spoked arcs represent hydrophobic interactions. iNOS, inducible nitric oxide synthase; Vit D3, vitamin D3; Sipo, siponimod.
Figure 10
Figure 10
Schematic representation of the potential therapeutic effects of Vit D3, Sipo, and their combination on gene expression of M1 and M2 microglia markers (iNOS, IL-1β, IGF-1) and myelination (MBP). CPZ, cuprizone; IL-1β, interleukin 1 beta; iNOS, inducible nitric oxide synthase; IGF-1, insulin-like growth factor 1; MBP, myelin basic protein; Vit D3, vitamin D3; Sipo, siponimod. Red lines represent inhibitory effects. Created with BioRender.com.

References

    1. Alghamdi B. S. (2022). The effect of melatonin and exercise on social isolation-related behavioural changes in aged rats. Front. Aging Neurosci. 14:828965. 10.3389/fnagi.2022.828965 - DOI - PMC - PubMed
    1. Ascherio A., Munger K. L., Simon K. C. (2010). Vitamin D and multiple sclerosis. Lancet Neurol. 9, 599–612. 10.1016/S1474-4422(10)70086-7 - DOI - PubMed
    1. Baran C., Smith G. S., Bamm V. V., Harauz G., Lee J. S. (2010). Divalent cations induce a compaction of intrinsically disordered myelin basic protein. Biochem. Biophys. Res. Commun. 391, 224–229. 10.1016/j.bbrc.2009.11.036 - DOI - PubMed
    1. Barati S., Ragerdi Kashani I., Moradi F., Tahmasebi F., Mehrabi S., Barati M., et al. (2019). Mesenchymal stem cell mediated effects on microglial phenotype in cuprizone-induced demyelination model. J. Cell. Biochem. 120, 13952–13964. 10.1002/jcb.28670 - DOI - PubMed
    1. Behrangi N., Atanasova D., Kipp M. (2019a). “Siponimod ameliorates inflammation and axonal injury in a novel multiple sclerosis model,” in Poster (P512) Presented at: 35th Congress of the European Committee for Treatment and Research in Multiple Sclerosis (Stockholm, Sweden), 229–230. 10.13140/RG.2.2.17647.38569 - DOI