. 2023 Feb 17;132(4):e78-e93.
doi: 10.1161/CIRCRESAHA.122.321722. Epub 2023 Jan 23.

ADAR1 Non-Editing Function in Macrophage Activation and Abdominal Aortic Aneurysm

Affiliations

ADAR1 Non-Editing Function in Macrophage Activation and Abdominal Aortic Aneurysm

Dunpeng Cai et al. Circ Res. .

Abstract

Background: Macrophage activation plays a critical role in abdominal aortic aneurysm (AAA) development. However, molecular mechanisms controlling macrophage activation and vascular inflammation in AAA remain largely unknown. The objective of the study was to identify novel mechanisms underlying adenosine deaminase acting on RNA (ADAR1) function in macrophage activation and AAA formation.

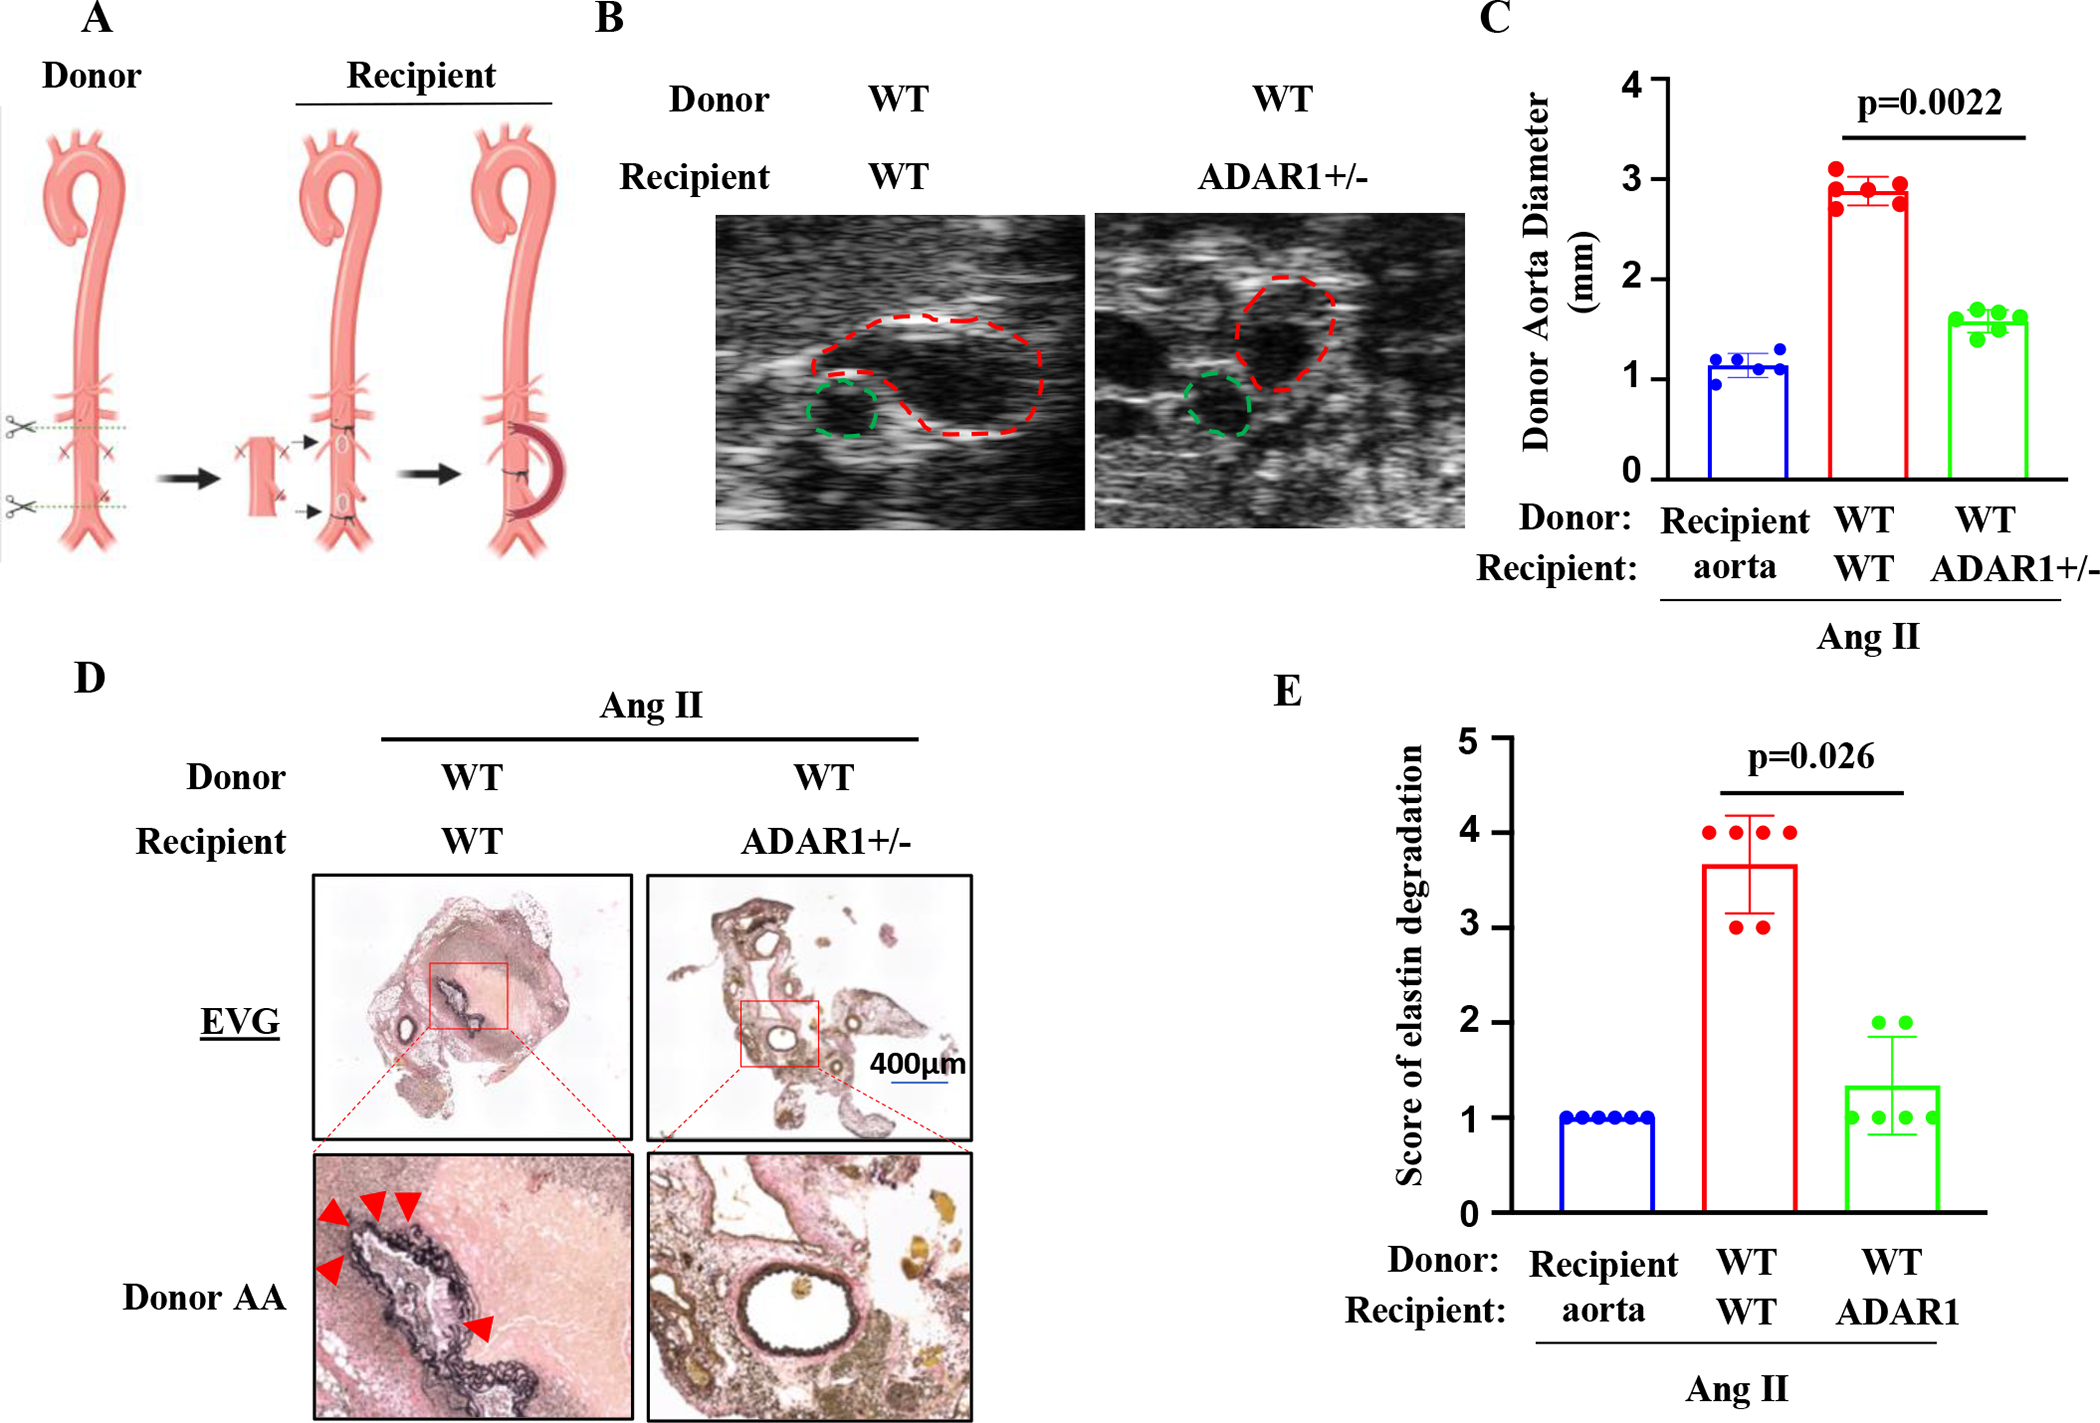
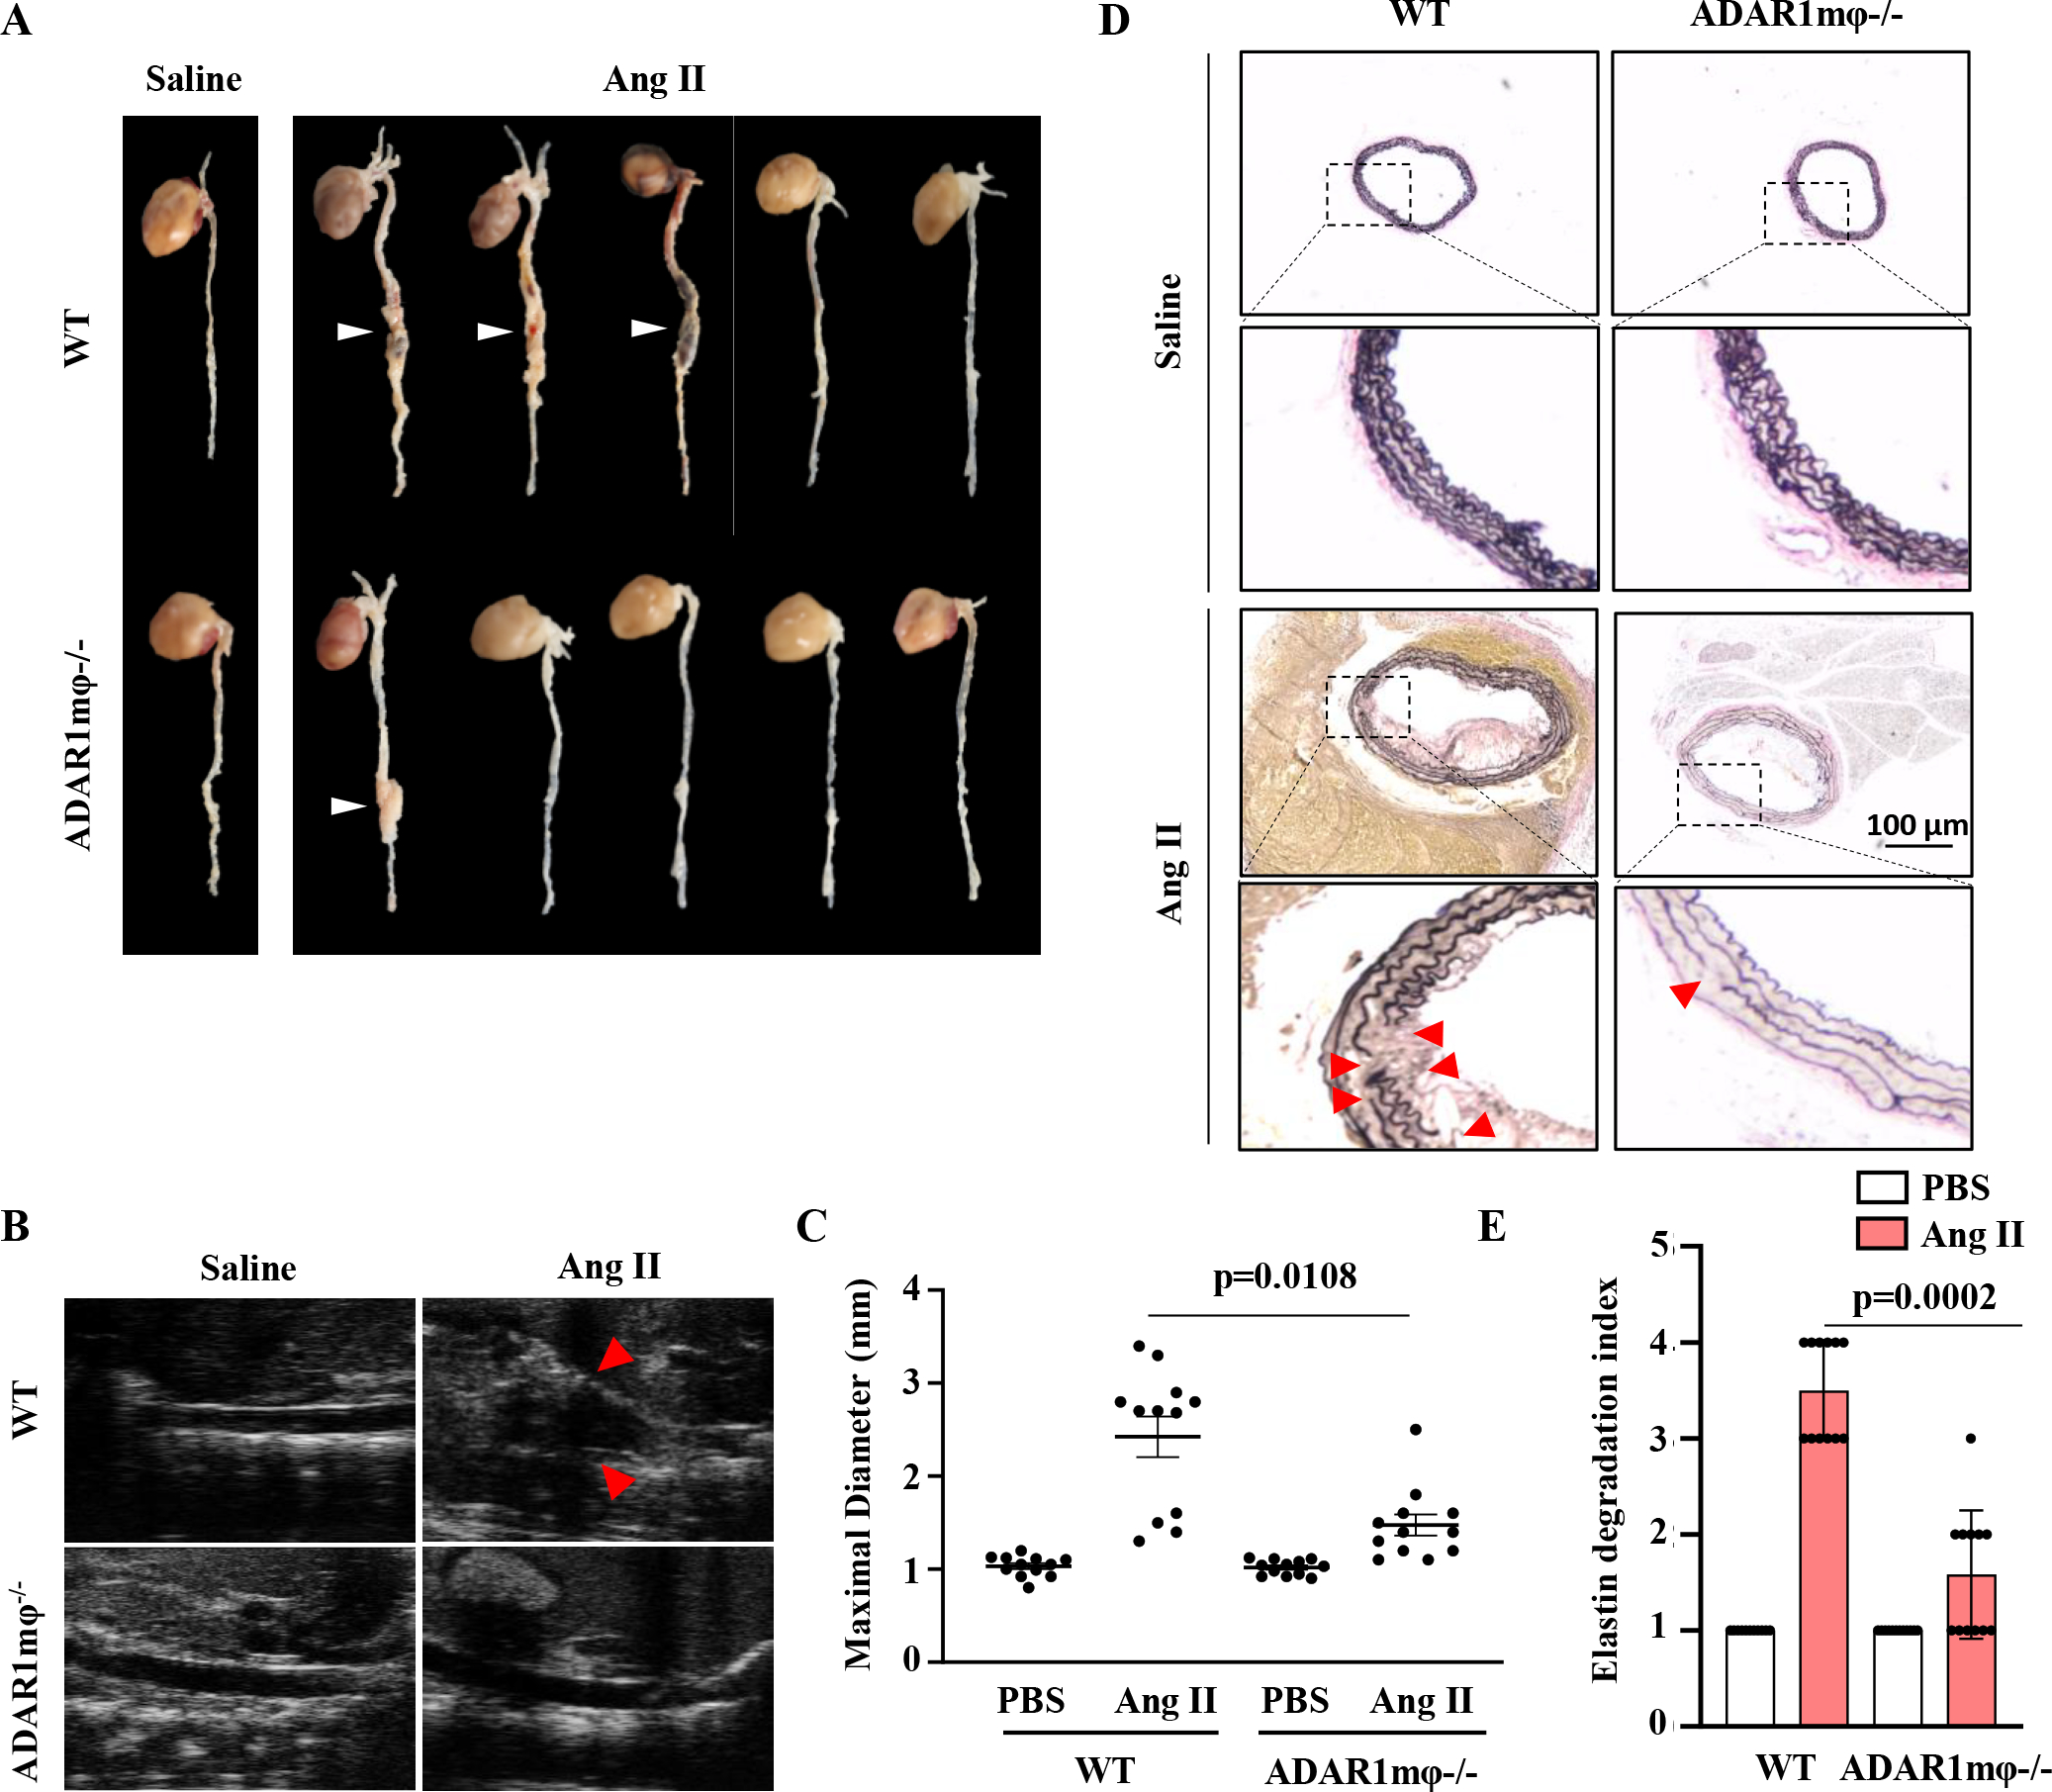
Methods: Aortic transplantation was conducted to determine the importance of nonvascular ADAR1 in AAA development/dissection. Ang II (Angiotensin II) infusion of ApoE-/- mouse model combined with macrophage-specific knockout of ADAR1 was used to study ADAR1 macrophage-specific role in AAA formation/dissection. The relevance of macrophage ADAR1 to human AAA was examined using human aneurysm specimens. Moreover, a novel humanized AAA model was established to test the role of human macrophages in aneurysm formation in human arteries.

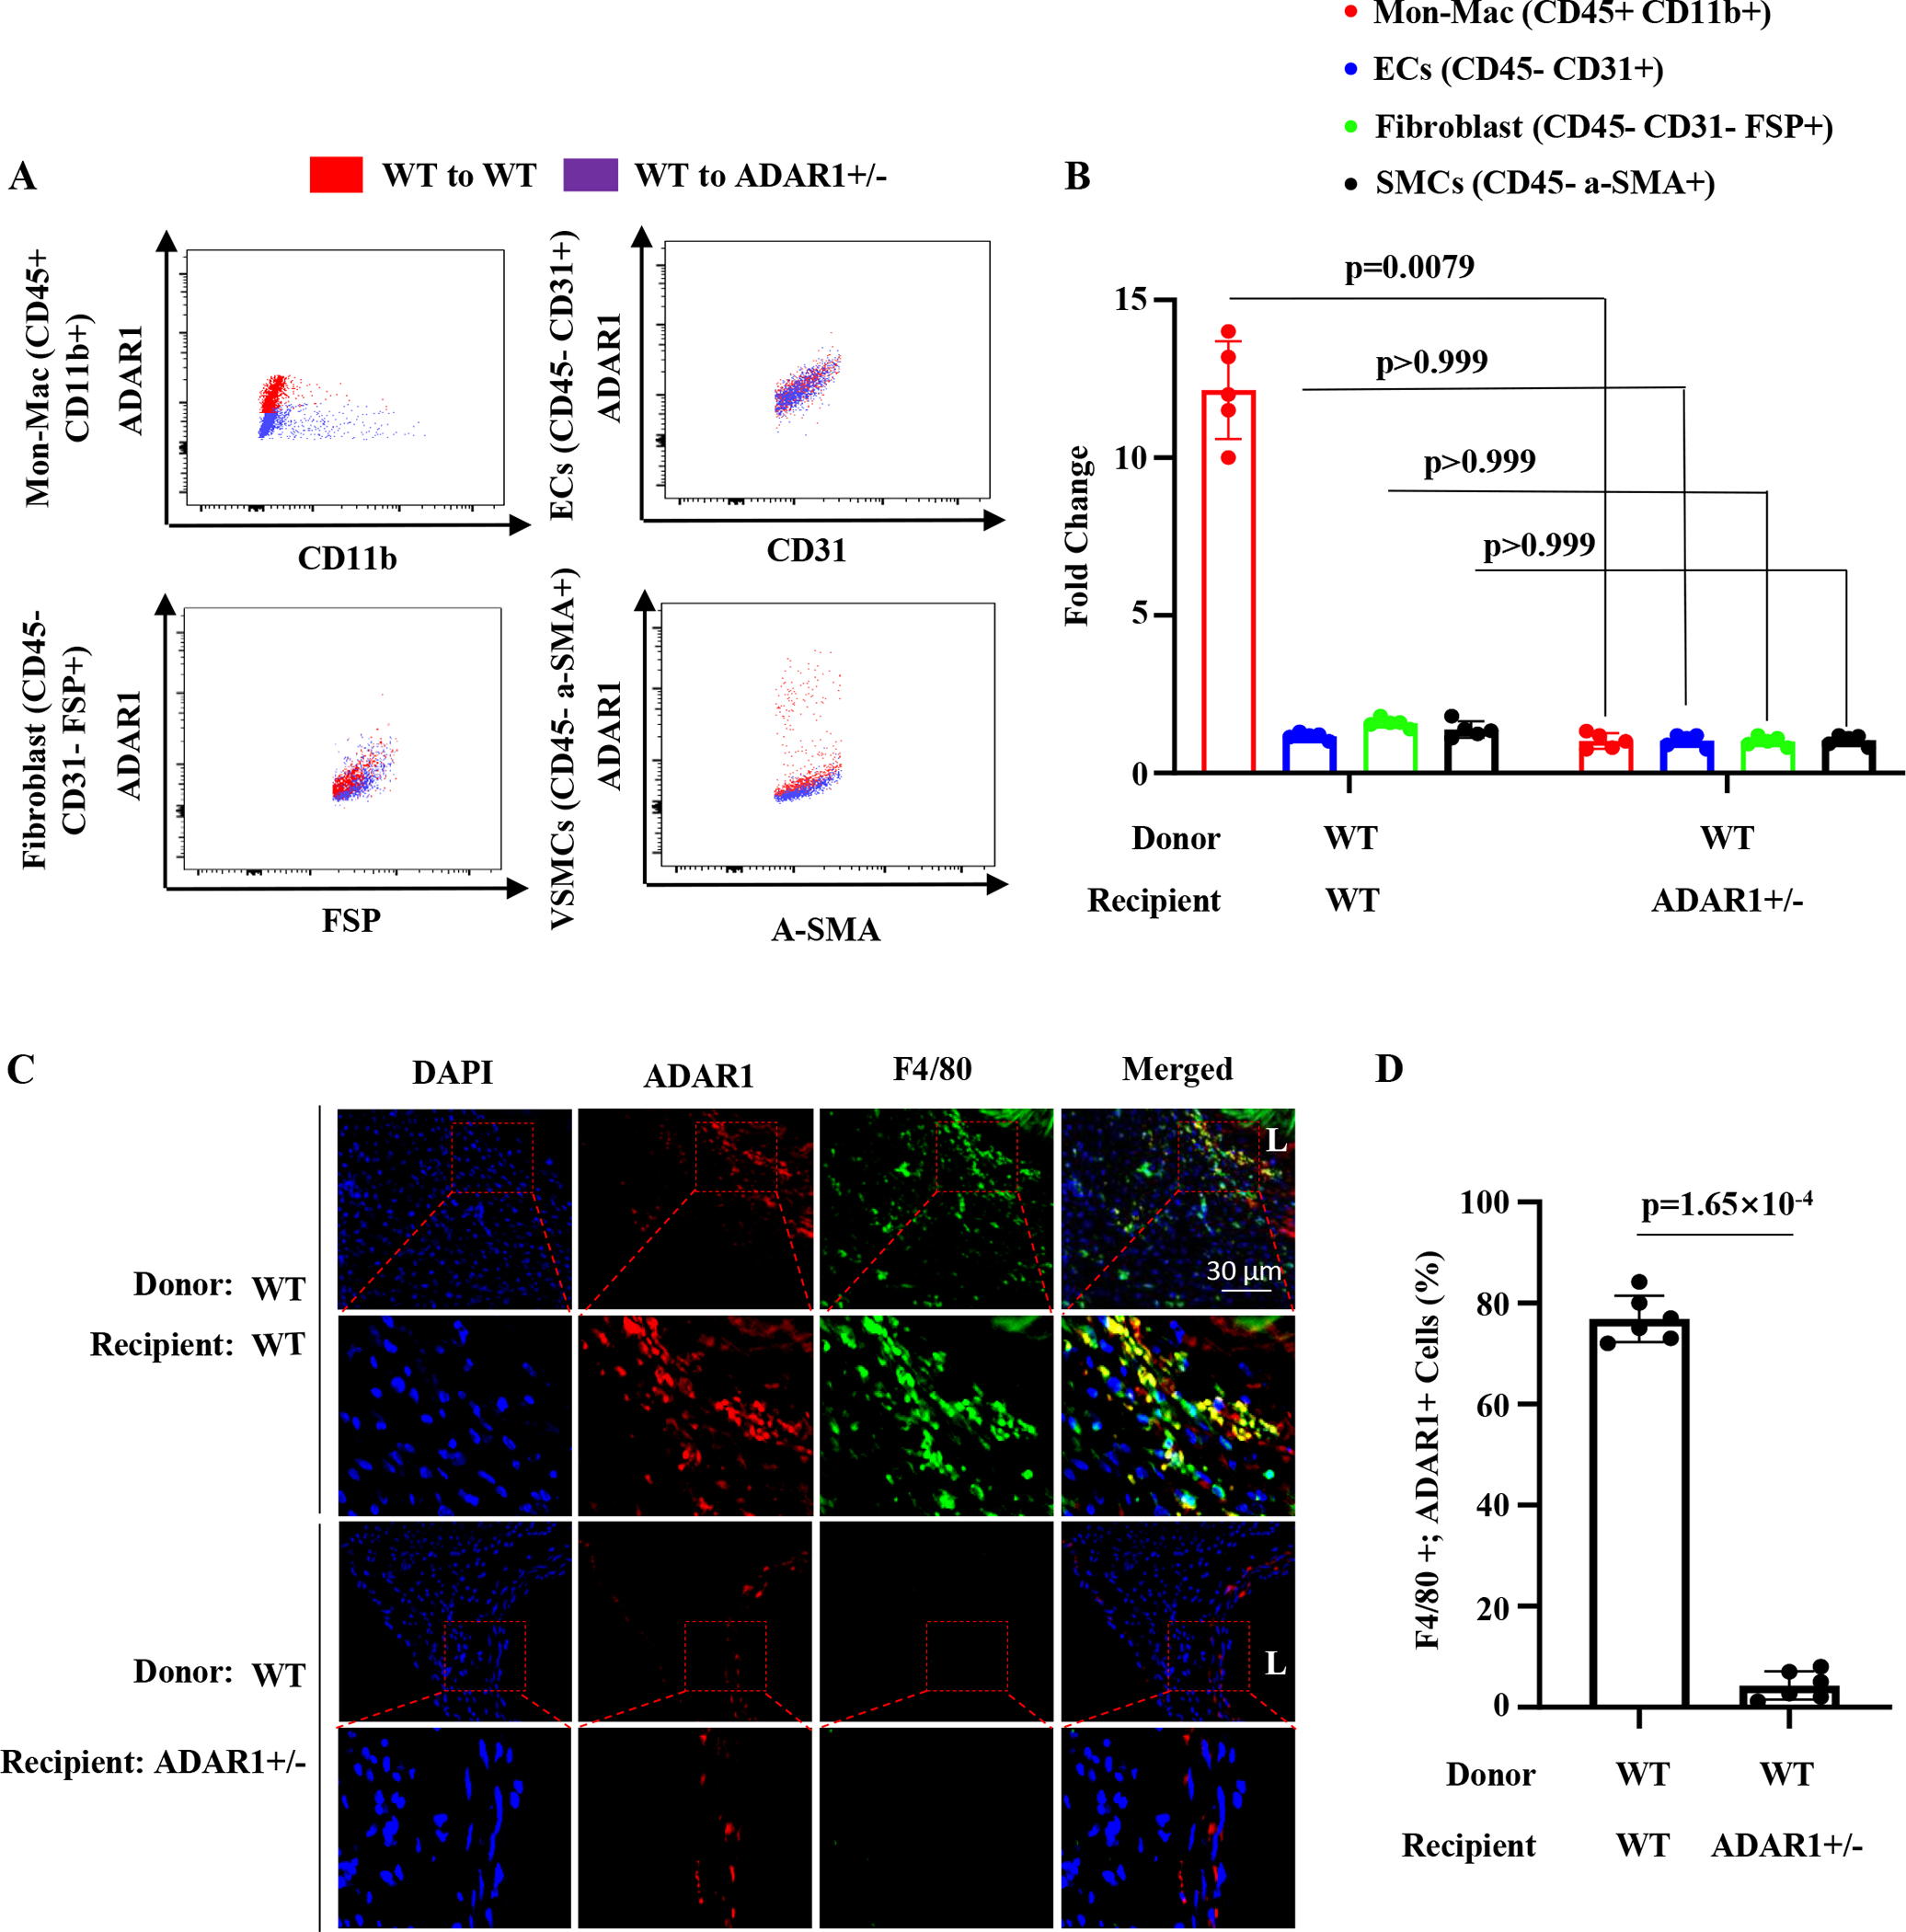
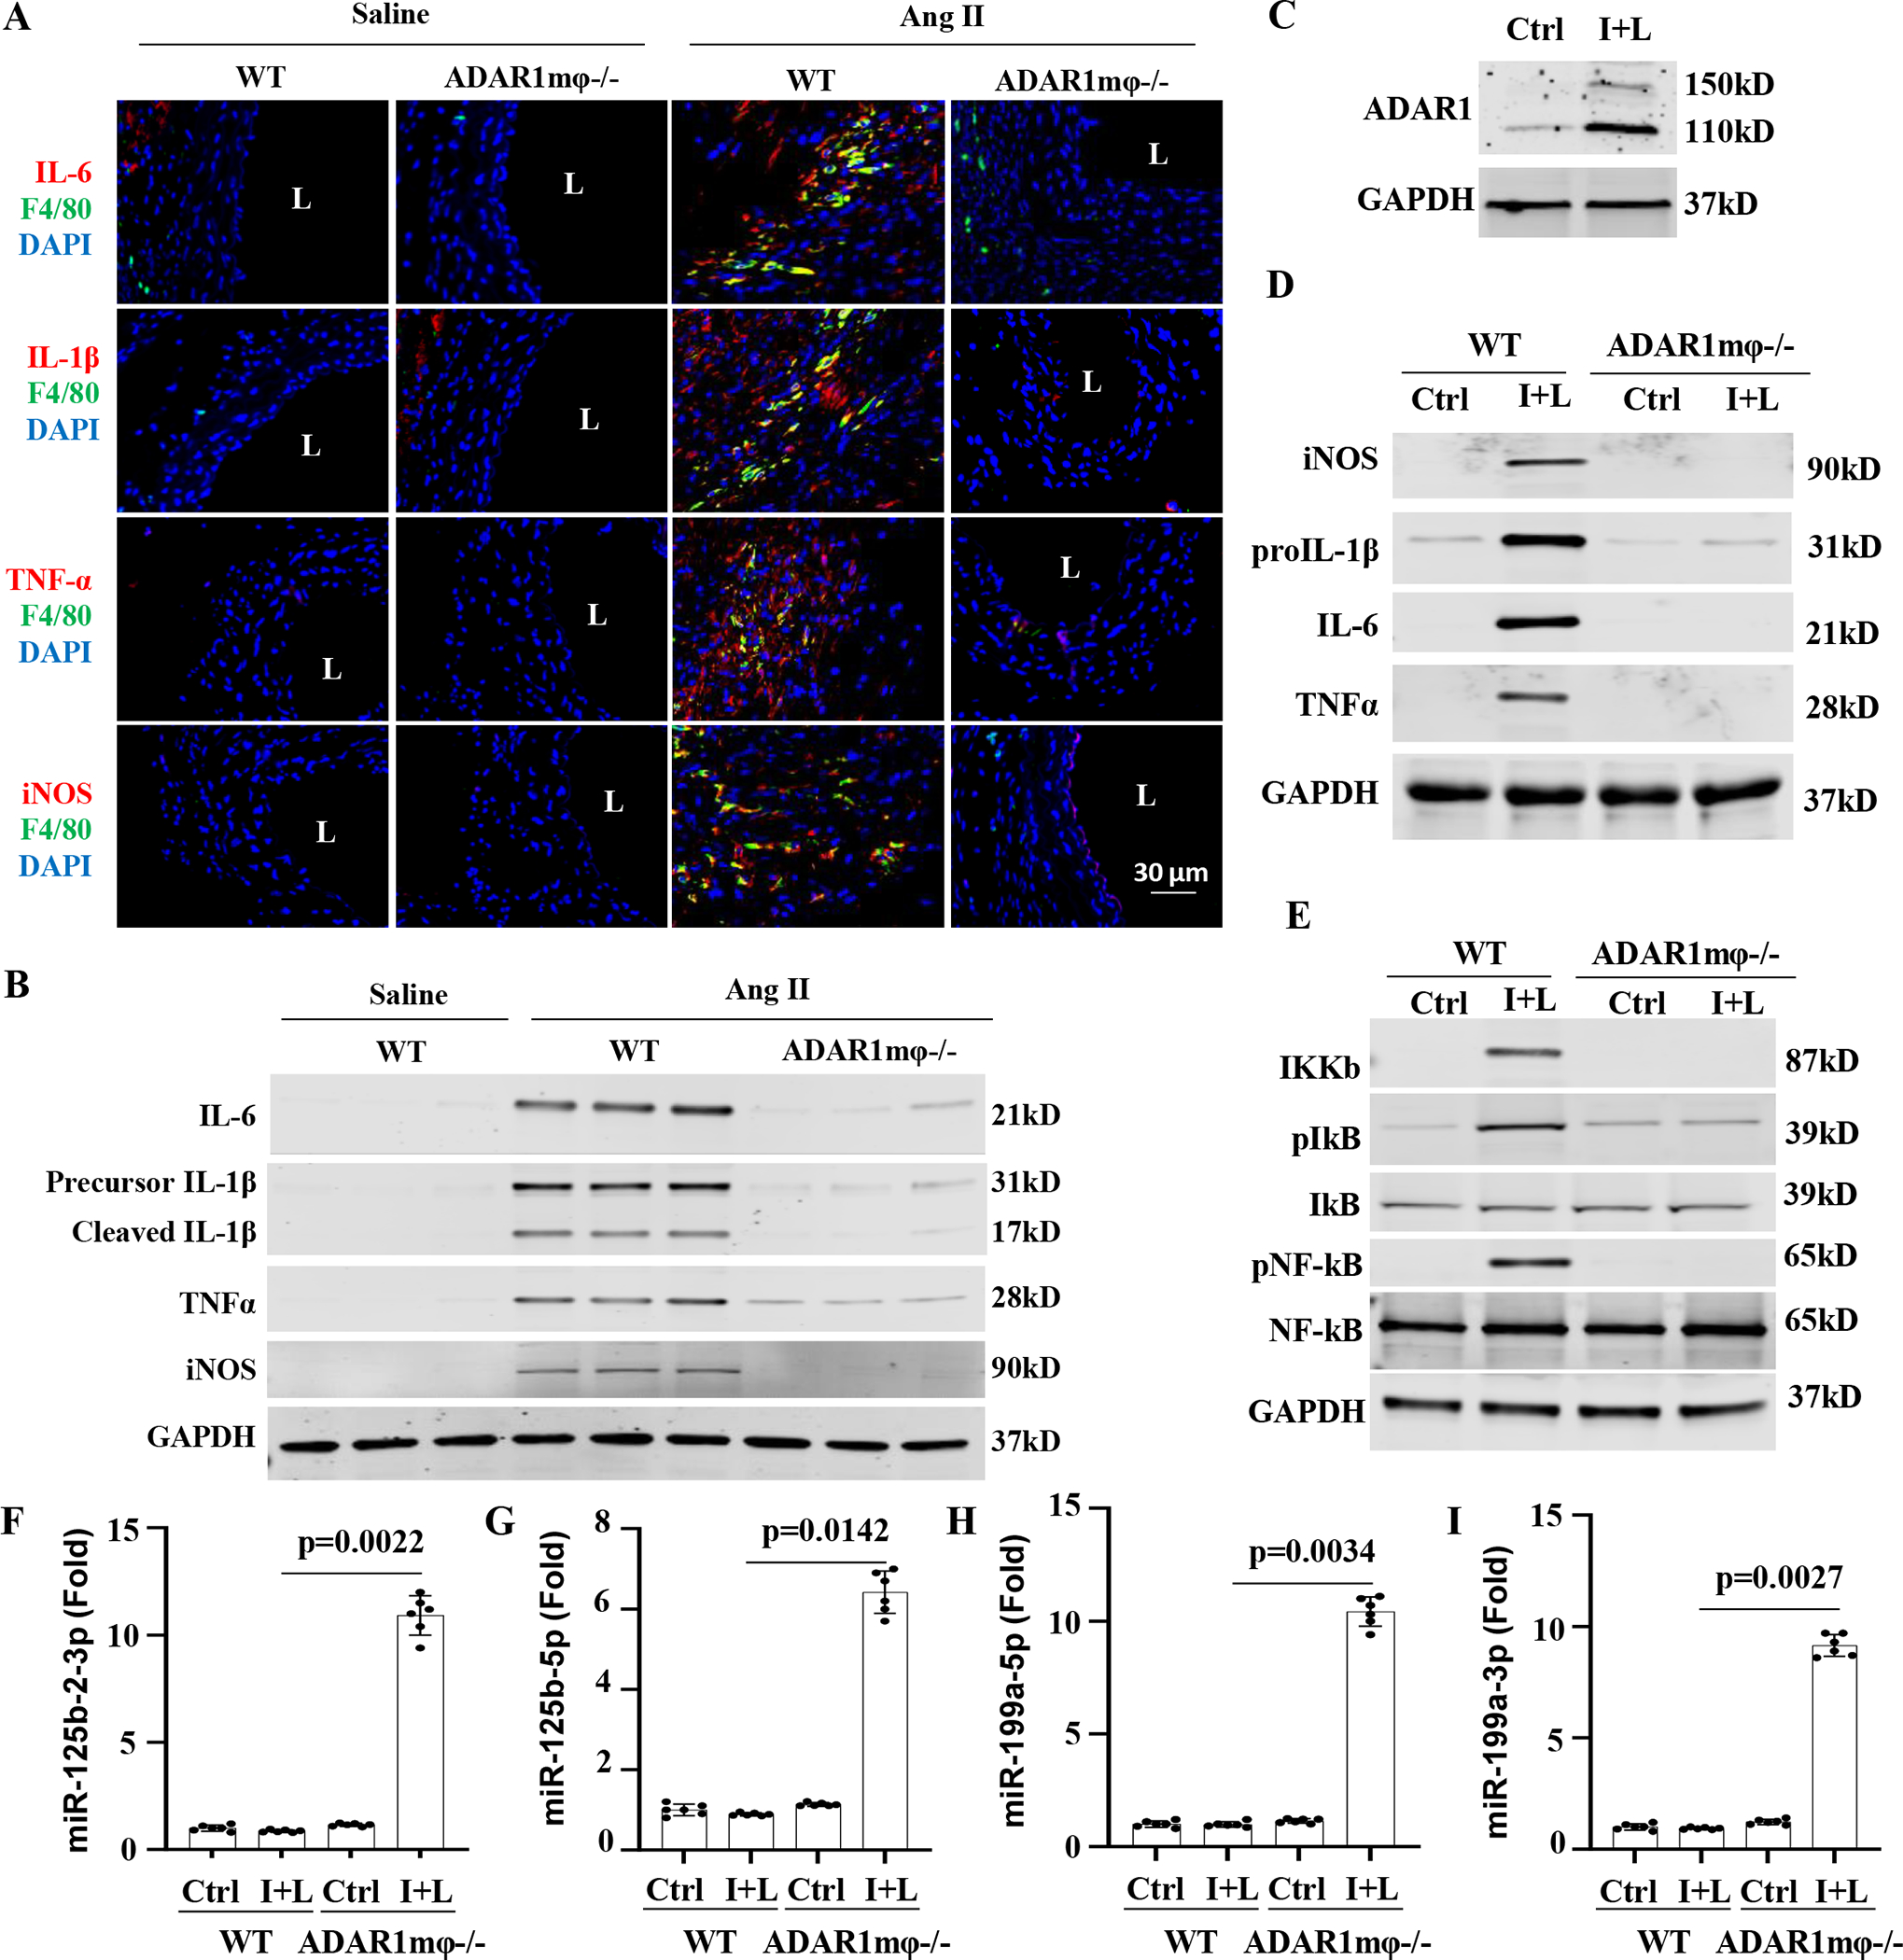
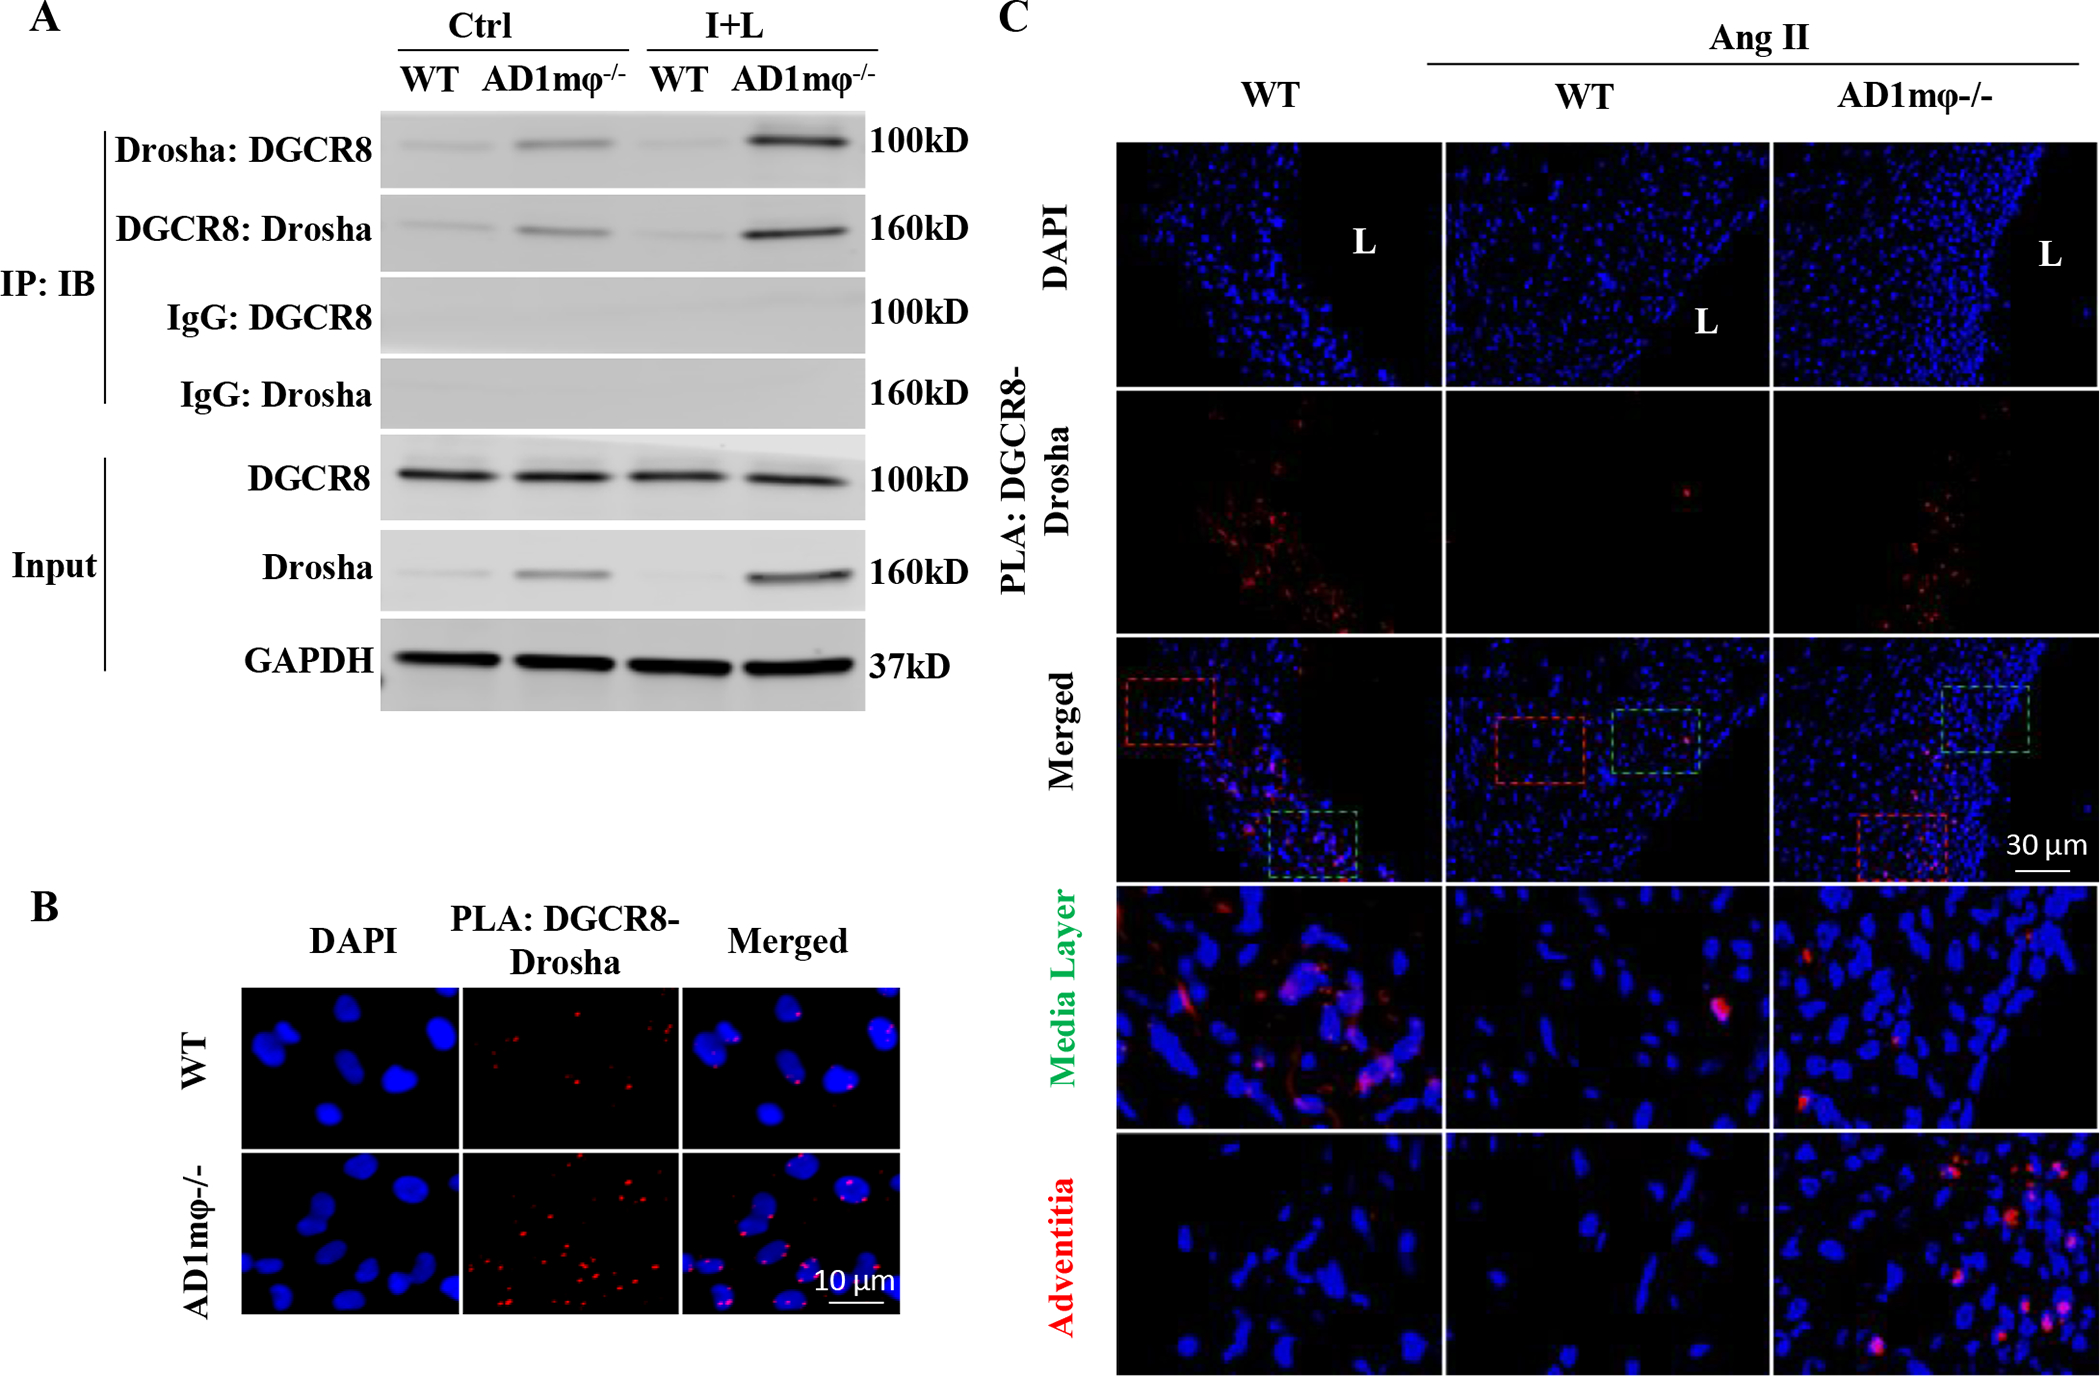
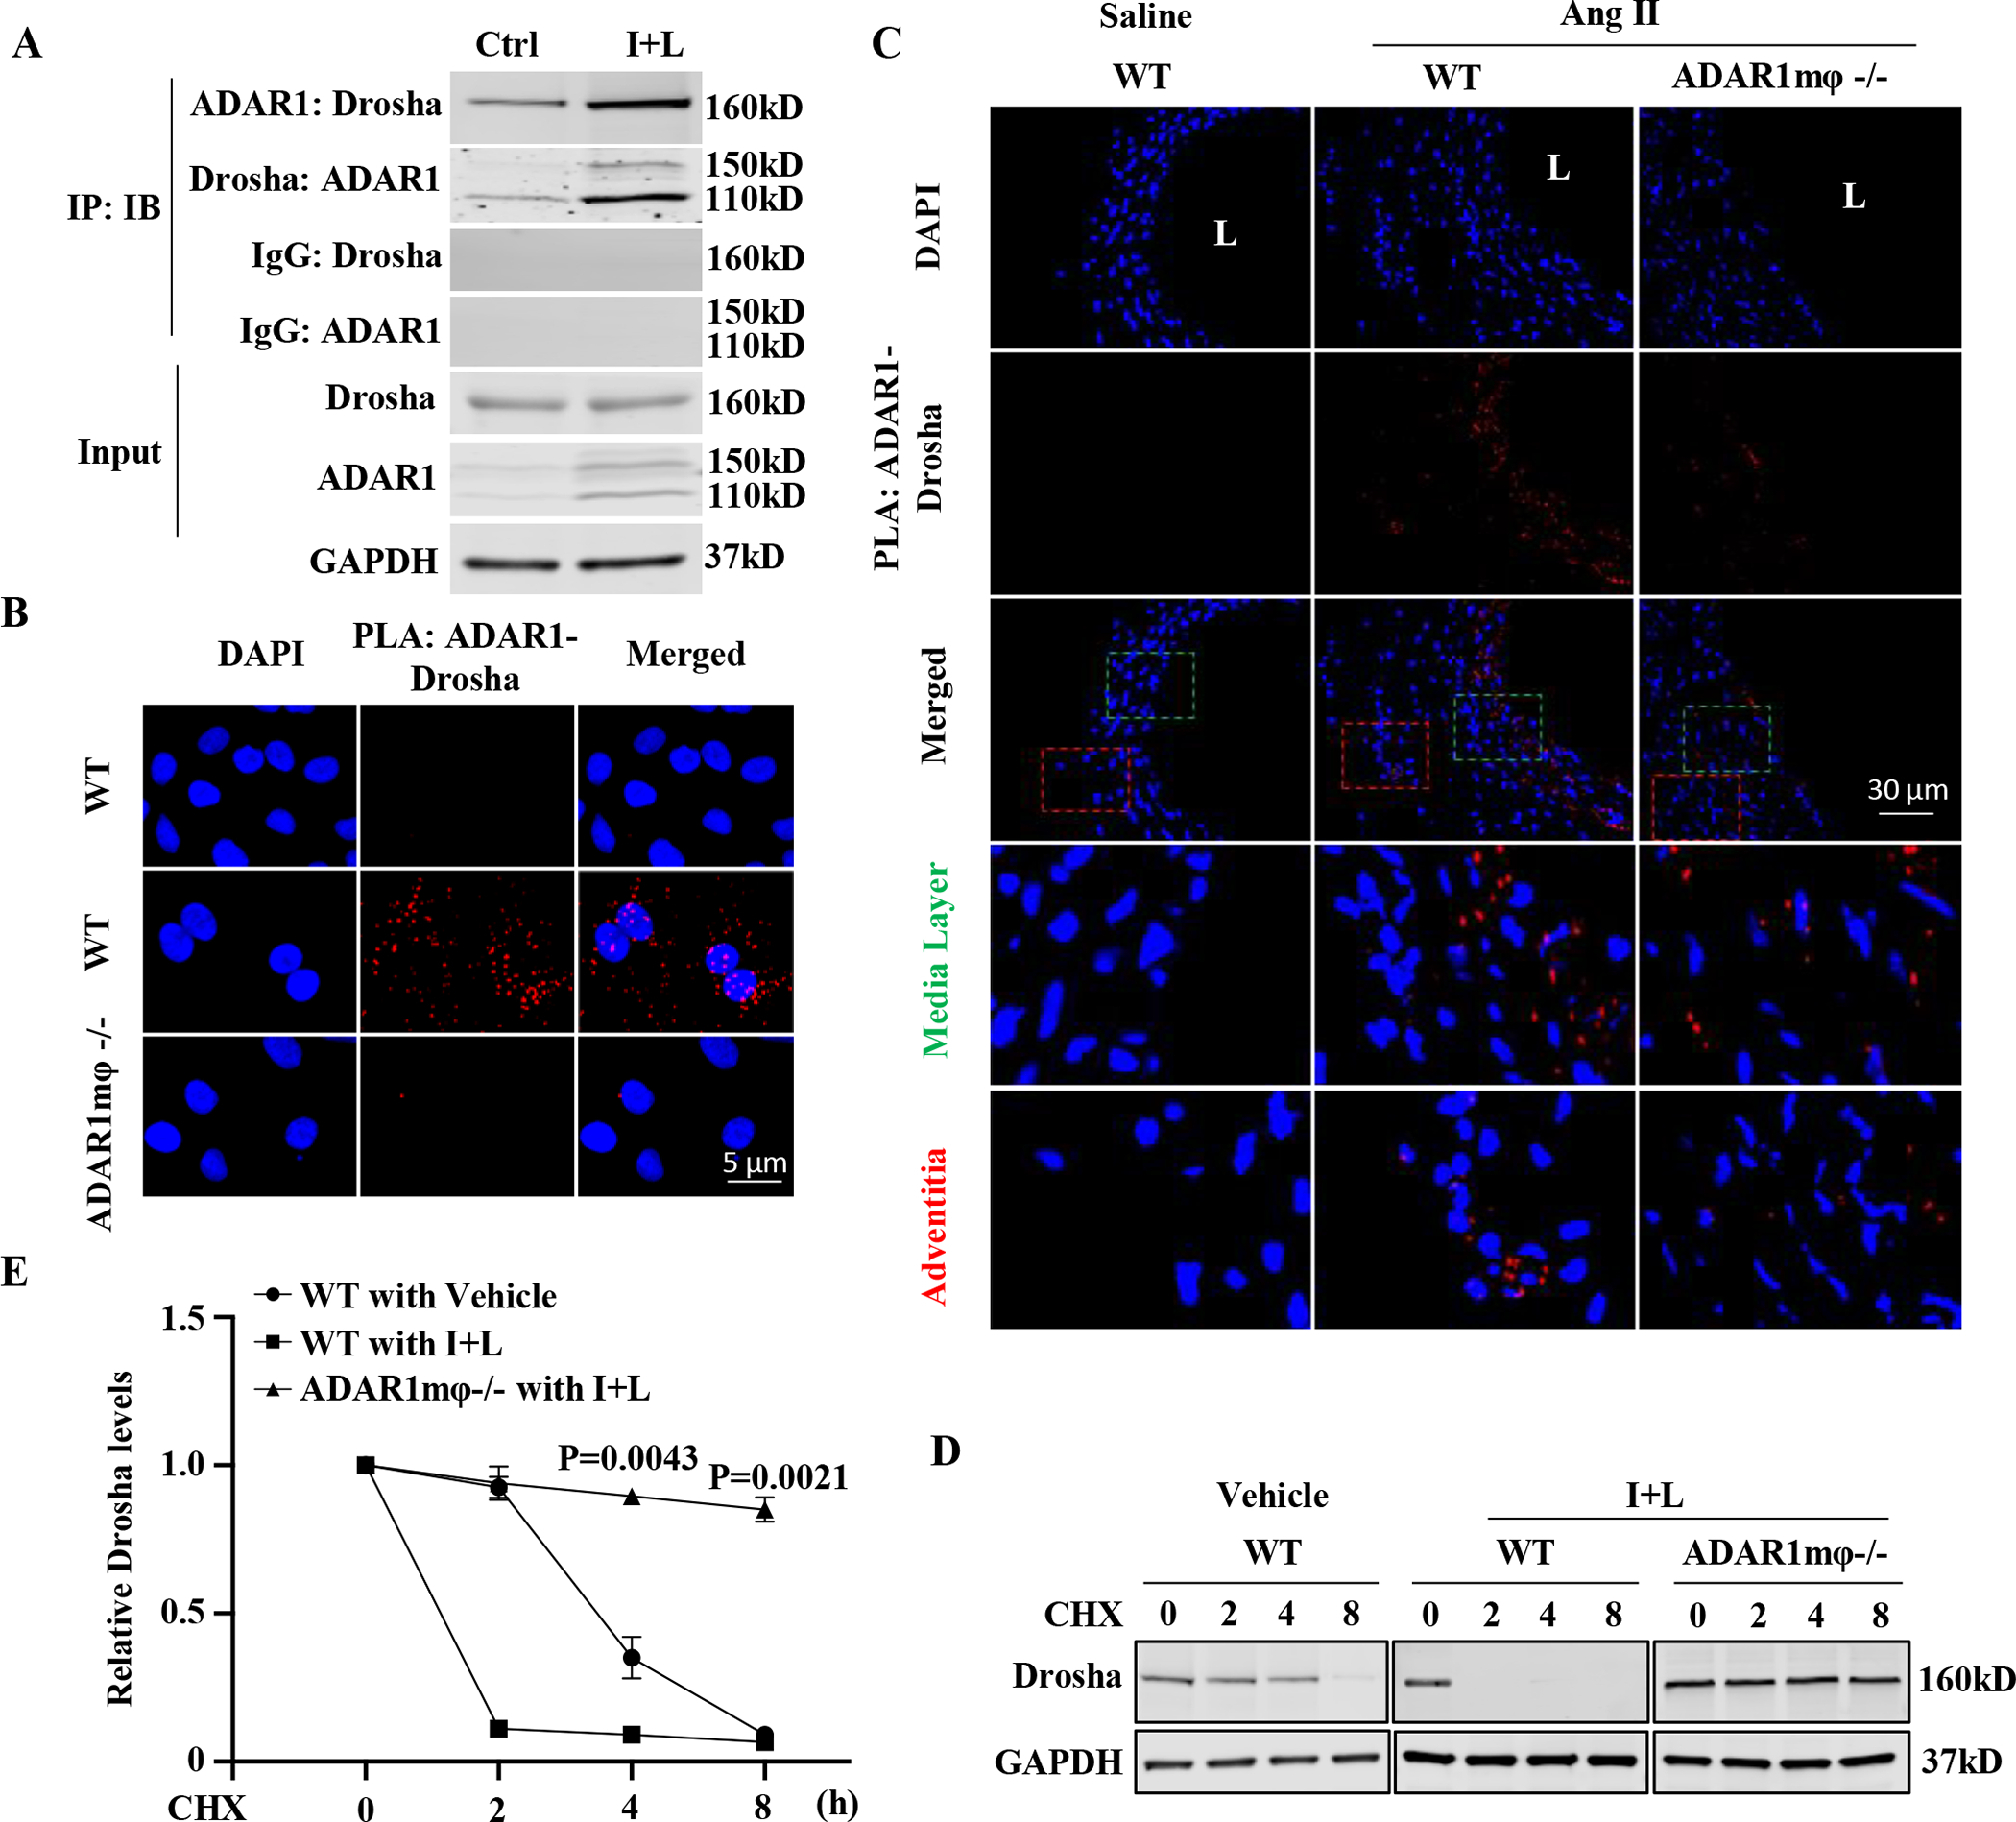
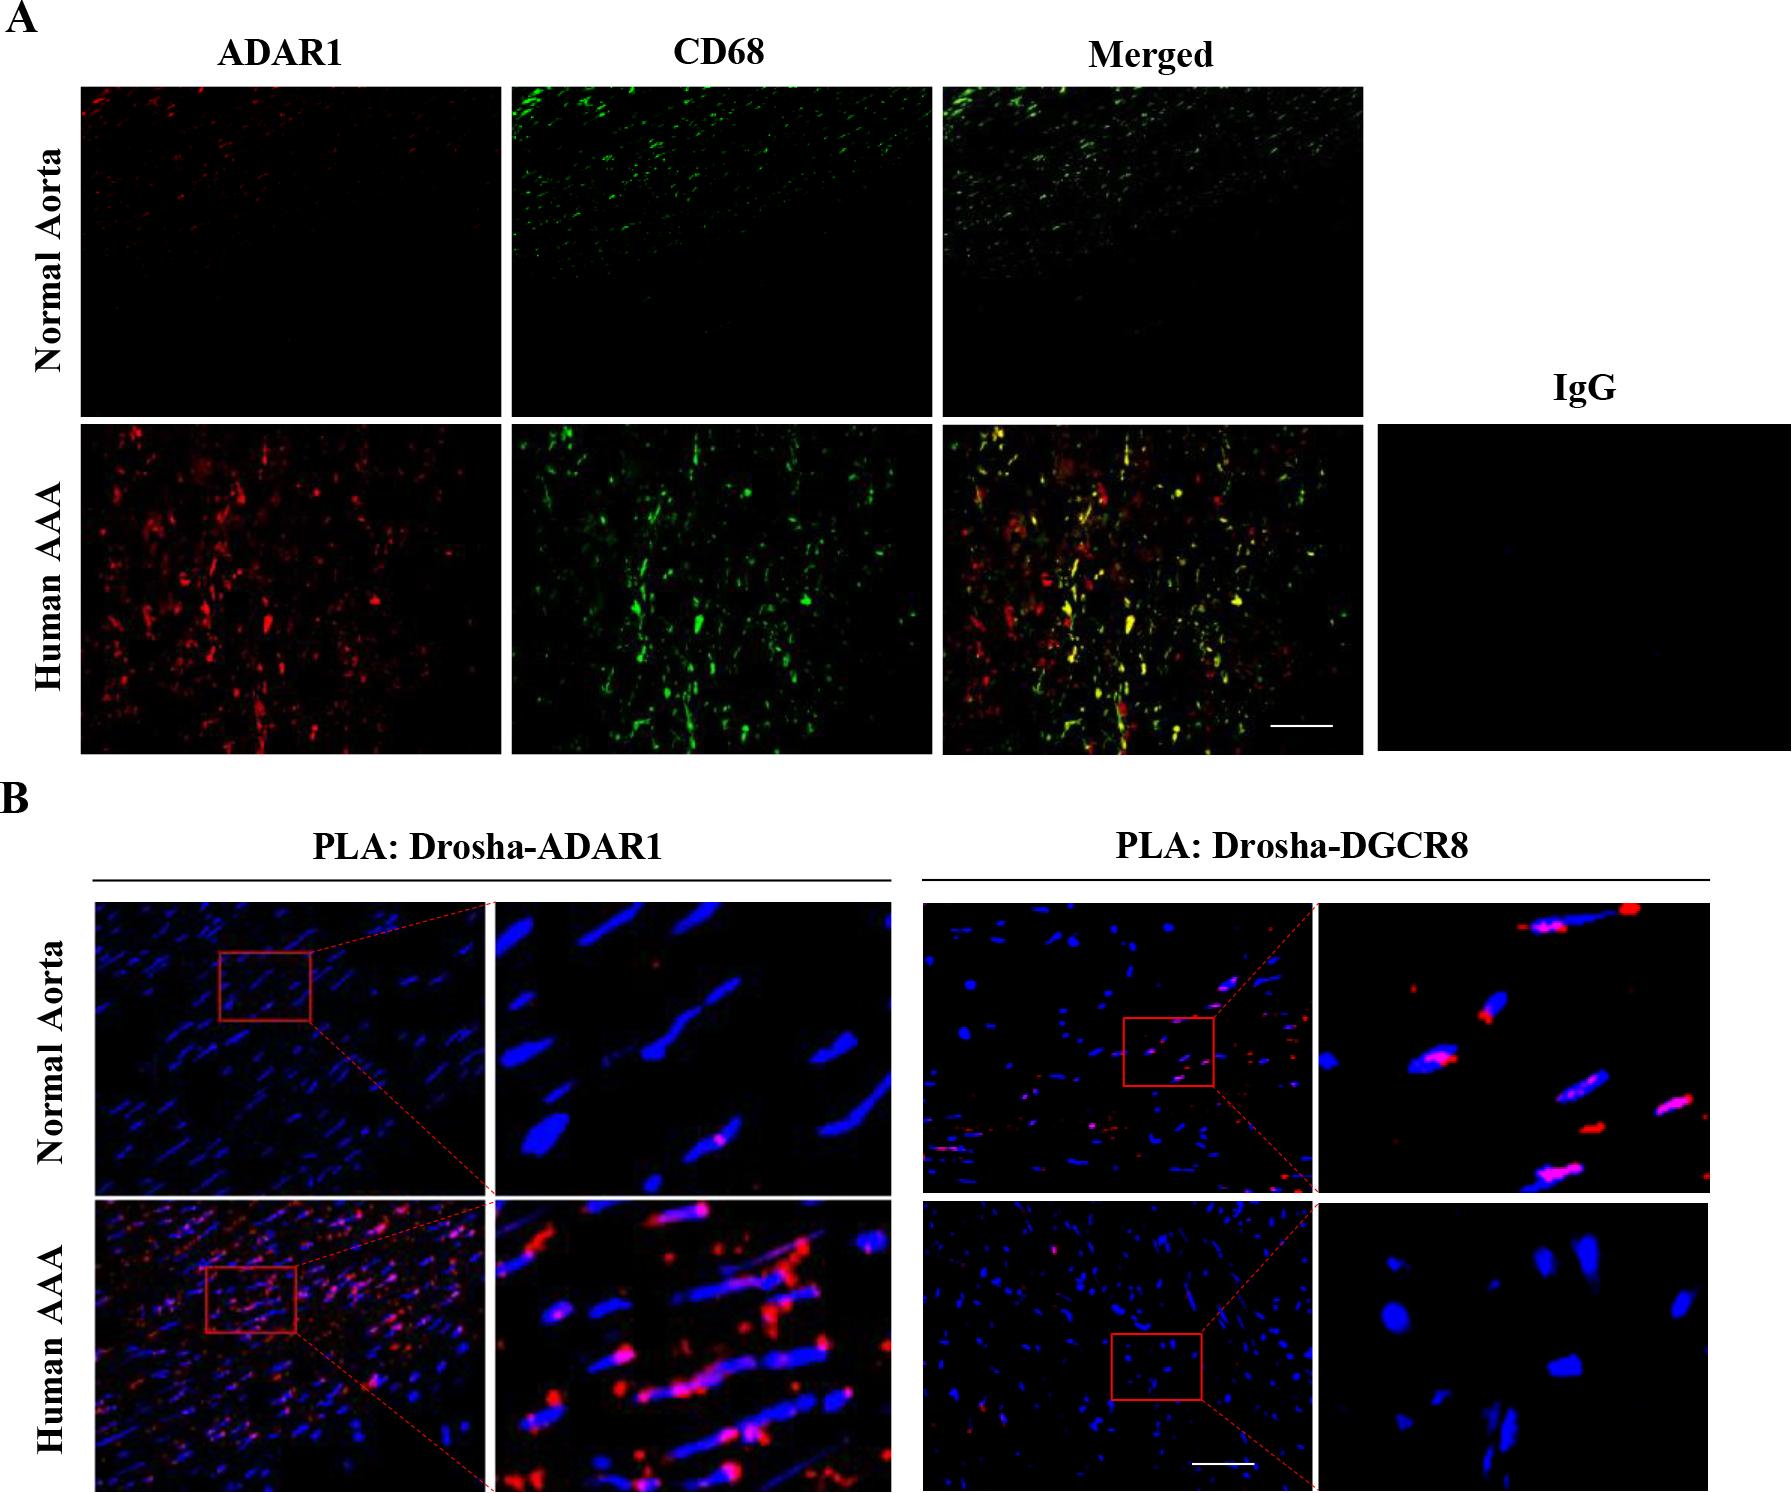
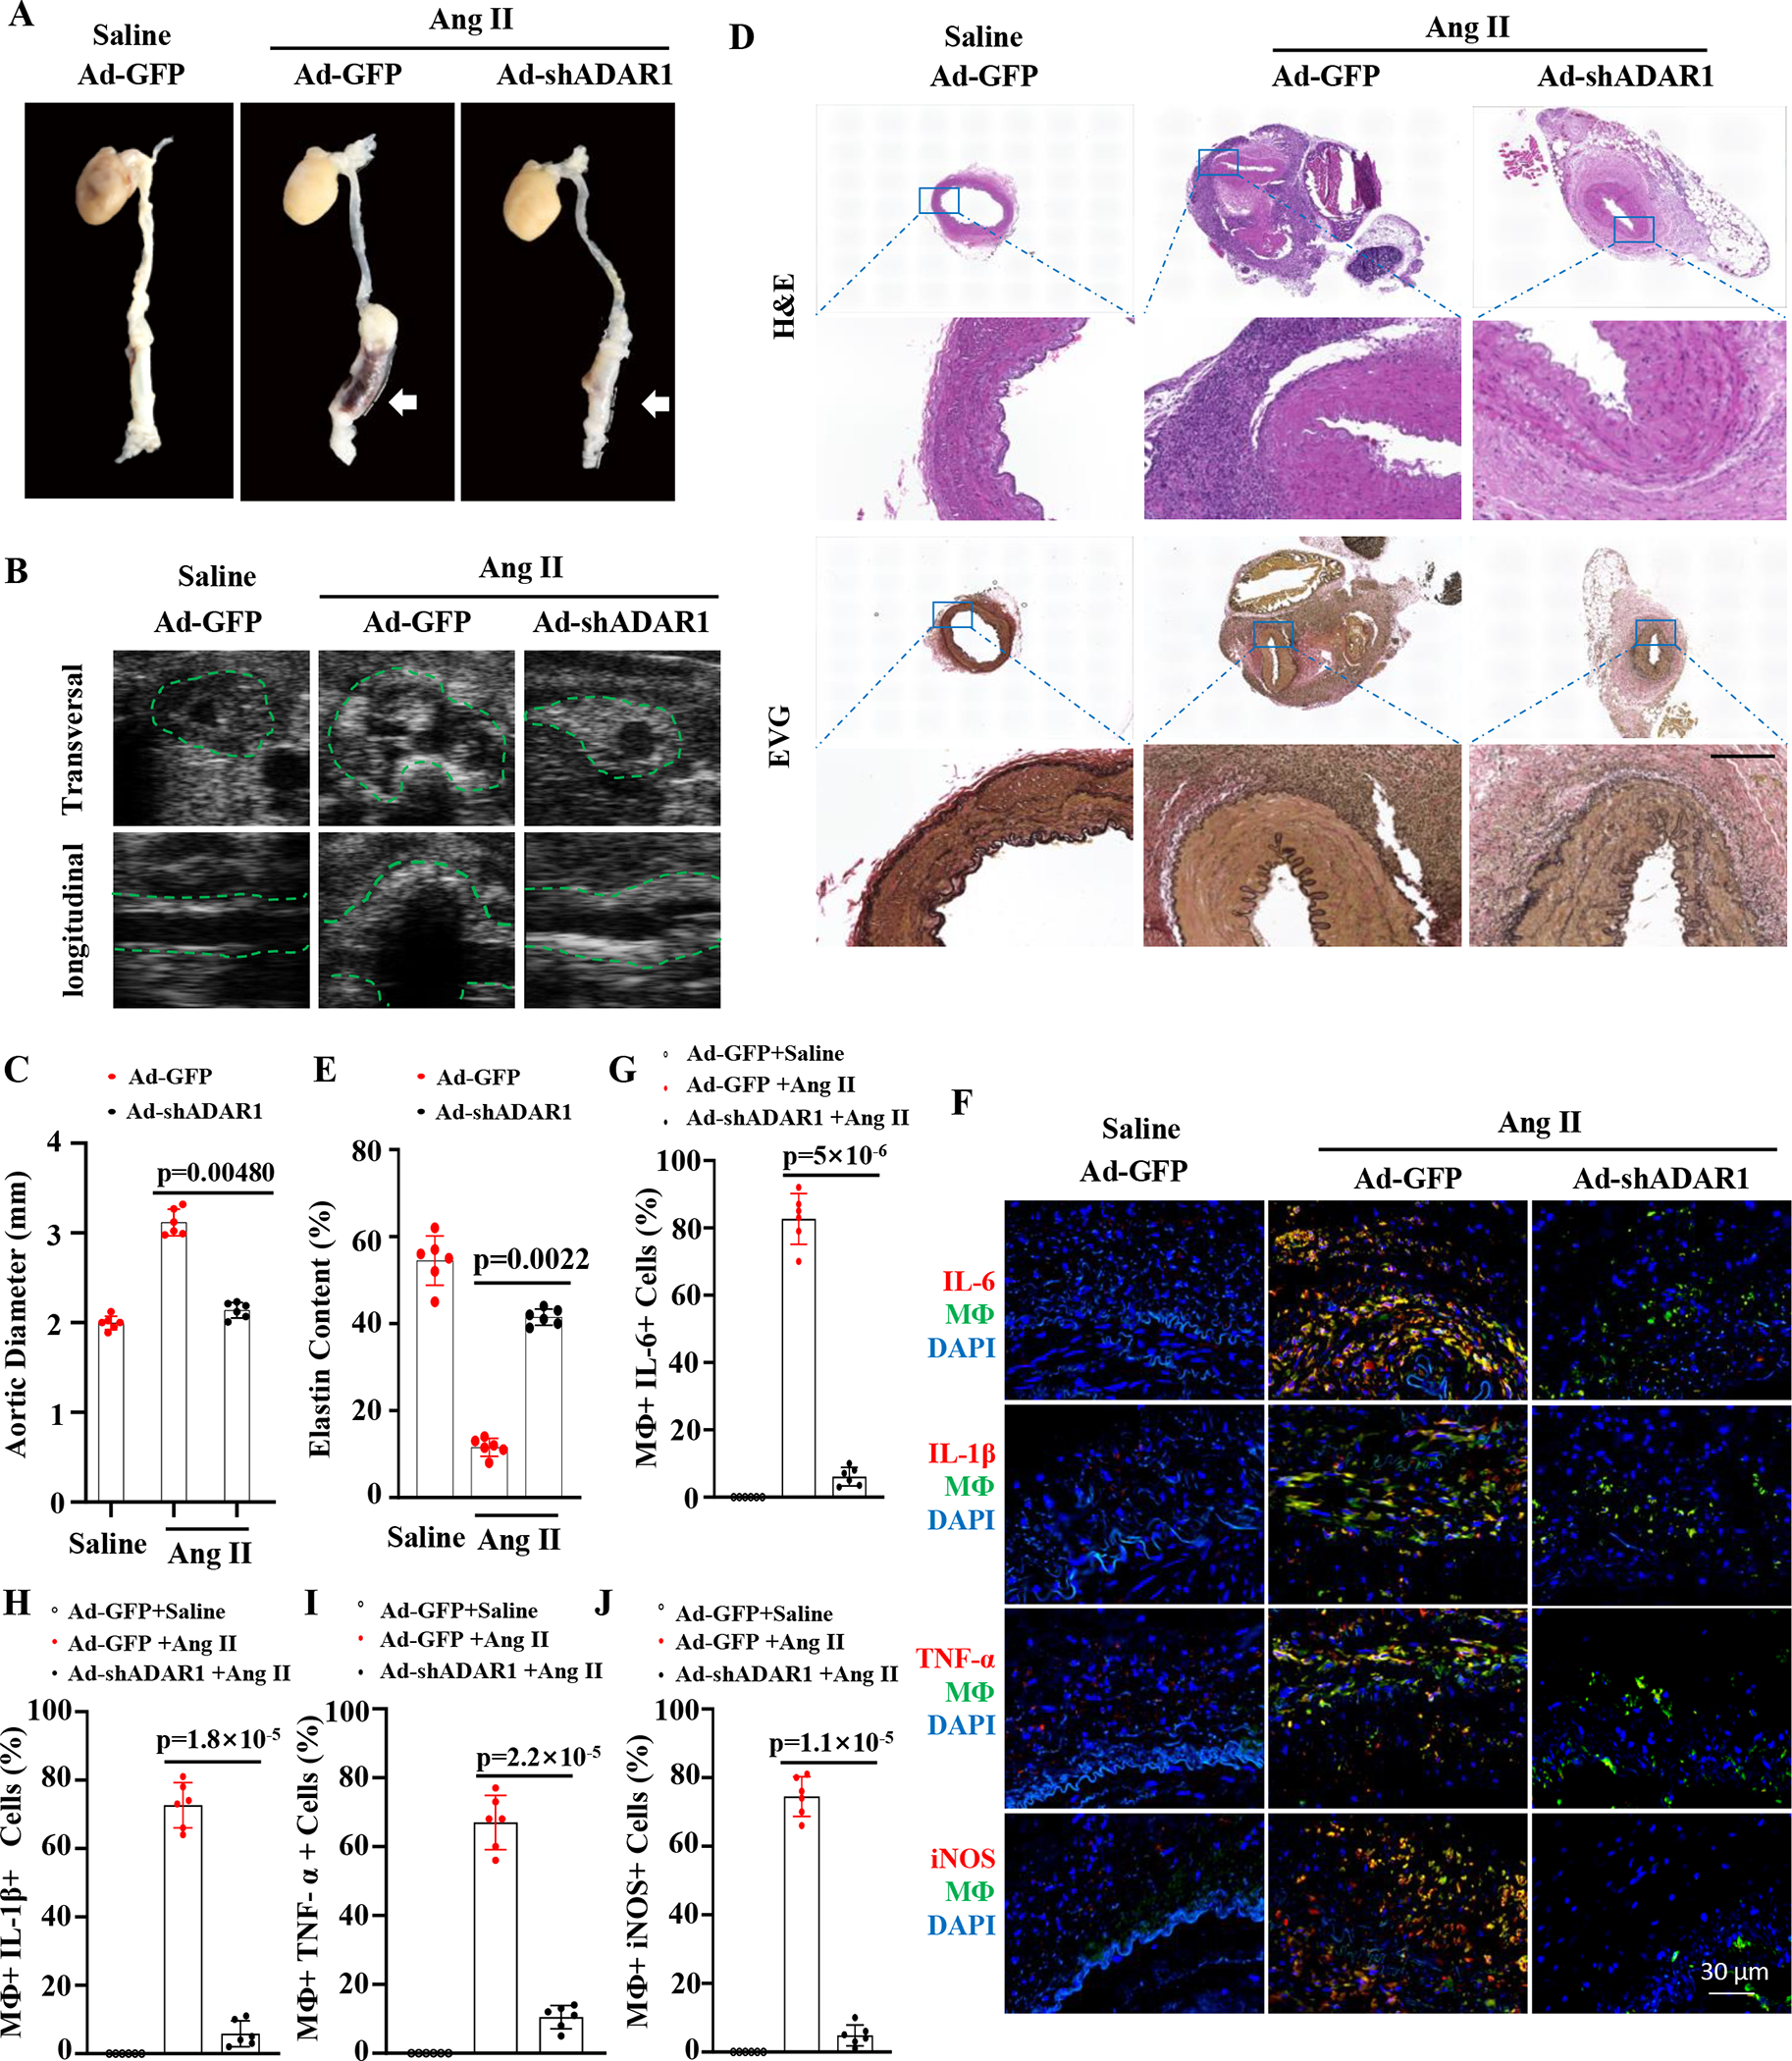
Results: Allograft transplantation of wild-type abdominal aortas to ADAR1+/- recipient mice significantly attenuated AAA formation, suggesting that nonvascular ADAR1 is essential for AAA development. ADAR1 deficiency in hematopoietic cells decreased the prevalence and severity of AAA while inhibited macrophage infiltration and aorta wall inflammation. ADAR1 deletion blocked the classic macrophage activation, diminished NF-κB (nuclear factor kappa B) signaling, and enhanced the expression of a number of anti-inflammatory microRNAs. Mechanistically, ADAR1 interacted with Drosha to promote its degradation, which attenuated Drosha-DGCR8 (DiGeorge syndrome critical region 8) interaction, and consequently inhibited pri- to pre-microRNA processing of microRNAs targeting IKKβ, resulting in an increased IKKβ (inhibitor of nuclear factor kappa-B) expression and enhanced NF-κB signaling. Significantly, ADAR1 was induced in macrophages and interacted with Drosha in human AAA lesions. Reconstitution of ADAR1-deficient, but not the wild type, human monocytes to immunodeficient mice blocked the aneurysm formation in transplanted human arteries.

Conclusions: Macrophage ADAR1 promotes aneurysm formation in both mouse and human arteries through a novel mechanism, that is, Drosha protein degradation, which inhibits the processing of microRNAs targeting NF-kB signaling and thus elicits macrophage-mediated vascular inflammation in AAA.

Keywords: abdominal aortic aneurysm; adenosine deaminases acting on RNA1; humanized AAA model; macrophage; microRNA.


Figures

Figure 1:
Figure 1:. Non-vascular ADAR1 contributed to AAA formation.
A, A graphic illustration of the mouse aortic transplant. Donor aortic segment was anastomosed to the recipient abdominal aorta in an end-to-side manner. The recipient aorta was ligated to diverge the blood flow through the donor aorta. Recipient mice were then infused with Ang II (1000 ng/kg/min) for 28 days. B, Representative transverse ultrasound images of abdominal aorta 28 days after the Ang II infusion. Red dash circles: donor aortas; Green dash circles: recipient’s own aortas. C, Maximal external diameters of donor aortas were measured by ultrasound imaging. P=0.0022, wild-type (WT) aortas to ADAR+/− vs. to WT recipients, n=6. D Representative images of Verhoeff’s elastic (EVG) staining of the transplanted aortas with aneurysm. The areas in the red boxes were shown with a higher magnification (4.2 folds) in the lower part of the panel. Arrows indicate elastin breaks. E: Quantification of elastin breaks in the donor aortas of Ang II-infused WT and ADAR1+/− recipient mice. P = 0.026, wild-type (WT) donor aortas to ADAR+/− vs. to WT recipients, n=6. Kruskal-Wallis test with Dunn multiple comparisons test was performed for C and E.
Figure 2:
Figure 2:. ADAR1 was highly expressed in monocyte-derived macrophages in wild type (WT), but not the ADAR+/− recipient mice.
Recipient mice were infused with Ang II (1000 ng/kg/min) for 7 days. A, Recipient mouse abdominal aortic cells were isolated for Flow Cytometry analyses. ADAR1 levels were detected in monocyte-derived macrophages (CD45 +, CD11b+), endothelial cells (CD45-, CD31+), fibroblasts (CD45-, CD31-, FSP+) and smooth muscle cells (CD45-, α-SMA+) in aneurysm lesions. Red dots indicate ADAR1 levels in wild type aorta transplanted to wild type mice. Blue dots indicate ADAR1 levels in wild type aorta transplanted to ADAR1+/− mouse aorta. B, Quantification of ADAR1 levels on monocyte-derived macrophages and vascular cells. Macrophage ADAR1 levels, P=0.0079 (n=5), ADAR+/− vs. WT recipients; ADAR1 levels in endothelial, fibroblast, or smooth muscles, P > 0.999 (n=5), ADAR+/− vs. WT recipients. C, Abdominal aorta sections were co-immunostained with F4/80 and ADAR1 antibodies. The areas in the red boxes were shown with a higher magnification (2.8 folds) in the lower part of the panel. D, The percentage of ADAR1+;F4/80+ cells relative to total F4/80+ cells were averaged from 10 sections for each animal. P<0.001, ADAR+/− vs. WT recipients, n=6.
Figure 3:
Figure 3:. ADAR1 deficiency in macrophages (ADAR1mφ−/−) ameliorated AAA formation.
ApoE−/− (WT) and ADAR1mφ-/;ApoE−/− (ADAR1mφ−/− ) mice were infused with Ang II (1000 ng/kg/min) for 28 days. A, Representative aneurysm formation as marked by white arrowheads. B, Representative longitudinal ultrasound images of abdominal aorta. Arrowhead indicates the aneurysm. C, Quantitative analyses of maximal aorta diameters by ultrasound imaging. p= 0.0108, ADAR1mφ−/− vs. WT mice with Ang II infusion, n=12. D, Verhoeff’s elastic (EVG) staining of AAA tissues. The areas in the rectangle boxes are shown with a higher magnification (4.2 fold) in the lower part of the panel. Arrowheads indicate elastin breaks. E, Quantification of elastin degradation indexes in each group. P=0.0002, ADAR1mφ−/− vs. WT mice with Ang II infusion, n=12. Kruskal-Wallis test with Dunn multiple comparisons test was performed for C and E.
Figure 4:
Figure 4:. ADAR1 promoted macrophage activation via regulating anti-inflammatory microRNA (miRNA) processing.
A-B, Mice were infused with angiotensin II (Ang II, 1000ng/kg/min) for 7 days. Abdominal aorta frozen sections were co-immunostained with F4/80 and IL-6, IL-1β, TNFα, or iNOS antibodies, respectively (A). The protein expression of IL-6, IL-1β, TNFα, and iNOS in mouse aorta were detected by Western blot, respectively (B). C, Bone marrow-derived macrophages (BMDMs) from WT mice were activated by interferon γ (IFNγ, 100 ng/mL) and lipopolysaccharides (LPS,100 ng/mL) (I+L) treatment for 6 h. ADAR1 protein expression was measured by Western blot. D, BMDMs isolated from WT or ADAR1mφ−/− mice were treated with vehicle (Ctrl) or I+L (100 ng/mL each) for 6 h to induce macrophage activation. The protein expression of iNOS and pro-inflammatory cytokines IL-1β, IL-6 and TNFα were determined by Western blot, respectively. E, ADAR1 deficiency (ADAR1mφ−/−) significantly inhibited I+L-induced NF-κB signaling. BMDMs isolated from WT or ADAR1mφ−/− mice were treated with vehicle (Ctrl) or I+L (100 ng/mL each) for 30 min. The protein expression and phosphorylation of NF-IKKβ, pIκB, NF-κB were measured by Western blot, respectively. Quantitative analyses for A-E are shown in online Figure V–VI (n=6). F-I, BMDMs isolated from WT or macrophage ADAR1 deficiency (ADAR1mφ−/−) mice were treated as in B. The mature miRNAs targeting NF-κB signaling, including miR-125b-2–3p (F), miR-125b-5p (G), miR-199a-5p (H), and miR-199a-3p (I) were assessed by RT-qPCR. p=0.0022 (F), 0.0142 (G), 0.0034 (H), and 0.0027 (I), ADAR1mφ−/− vs. WT cells treated with I+L, n=6. Kruskal-Wallis test with Dunn multiple comparisons test was performed for F to I.
Figure 5:
Figure 5:. ADAR1 negatively regulates Drosha-DGCR8 interaction in macrophages and AAA lesions.
A-B, ADAR1mφ−/− (AD1mφ−/−) significantly enhanced Drosha-DGCR8 interaction in classically activated macrophages. BMDMs isolated from WT or AD6.31mφ−/− mice were treated with vehicle (Ctrl) or interferon γ (IFNγ, 100 ng/mL) and lipopolysaccharides (LPS,100 ng/mL) (I+L) for 6 h to induce macrophage classical activation. A, Coimmunoprecipitation assays were performed to detect the Drosha-DGCR8 interaction. Control (IgG), Drosha or DGCR8 antibodies were used for immunoprecipitation (IP), and immunoblotting (IB) was performed with DGCR8 and Drosha antibodies, respectively. B, In situ proximity ligation assays (PLA) were performed to confirm Drosha-DGCR8 interaction in AD1mφ−/− BMDMs activated by I+L (n=6). DAPI stains the nuclei. C, AD1mφ−/− enhanced the physical interaction between DGCR8 with Drosha in mouse AAA lesion. PLA was performed on mouse abdominal aorta or AAA sections by staining with both Drosha and DGCR8 antibodies (n=6). IgG staining was used as a negative control (online Figure XIV). DAPI stains nuclei. L: lumen. The media (green box) and adventitia areas (red box) in the merged images were enlarged in the lower panels (3.8 folds). Adventitia areas where macrophages accumulate show more Drosha-DGCR8 interaction. The quantifications of PLA signals in B and C are shown in online Figure XV.
Figure 6:
Figure 6:. ADAR1 binds and promotes Drosha degradation.
A-B, ADAR1 interacted with Drosha in activated macrophages. BMDMs were treated with vehicle (Ctrl) or interferon γ (IFNγ, 100 ng/mL) and lipopolysaccharides (LPS,100 ng/mL) (I+L) for 6 h. A, Coimmunoprecipitation assays were performed to detect the ADAR1-Drosha interaction. Control (IgG), ADAR1 or Drosha antibodies were used for immunoprecipitation (IP), and immunoblotting (IB) was performed with ADAR1 and Drosha antibodies, respectively. B, In situ Duolink proximity ligation assay (PLA) was performed to confirm the ADAR1-Drosha interaction. DAPI stains nuclei. C, ADAR1 interacted with Drosha in mouse AAA lesion. PLA was performed on mouse abdominal aorta or AAA sections by staining with both ADAR1 and Drosha antibodies. DAPI stains nuclei; L: lumen. IgG staining as a negative control is shown in online Figure XVII. The quantifications for PLA signals are shown in online Figure XVIII. The media (green box) and adventitia areas (red box) in the merged images were enlarged in the lower panels (3.8 folds). D-E, ADAR1mφ−/− inhibited I+L-induced Drosha degradation in BMDMs. BMDMs from WT or ADAR1mφ−/− mice were stimulated with I+L (100 ng/mL each) for 1 hour followed by cycloheximide (CHX,30 ug/mL) treatment for the times indicated. The Drosha protein levels were detected by Western blot (D) and quantified by normalizing to GAPDH (E). p=0.0043 (4 h) and 0.0021 (8 h), ADAR1mφ−/− vs. WT cells with I+L. Kruskal-Wallis test with Dunn multiple comparisons test was performed for E.
Figure 7:
Figure 7:. Macrophage ADAR1 and its interaction with Drosha correlate with the development of human AAA.
A, Normal healthy human abdominal aorta or AAA sections were co-immunostained with CD68 and ADAR1 antibodies. Red: ADAR1, Green: CD68. The areas in the red boxes were shown with a higher magnification (4.2 folds) in the left part of the panel. B, The increased ADAR1 interaction with Drosha correlated with decreased Drosha interaction with DGCR8 in human AAA lesions, as detected by In situ Duolink Proximity Ligation Assay. DAPI stains nuclei. Scale bar: 30 μm. The negative control of PLA assay is shown in online Figure XXIII. The quantitative analyses of immunostaining (A) and PLA signal (B) are shown in Online Figure XXI (n=6).
Figure 8.
Figure 8.. Human IMA was anastomosed to recipient abdominal aorta in an end-to-end manner in NSG mice.
Monocyte stained with green dye were injected (I.V.) the first day after the transplantation and then once every 7 days thereafter. Two weeks after the transplantation, recipient mice were infused with Ang II (1000 ng/kg/min) for 28 days. A, Representative aneurysm formation as marked by white arrows. B, ADAR1 deficiency in monocytes diminished Ang II-infusion-caused aorta dilation in NSG mice as imaged by B mode ultrasound longitudinally and transversely. Green dash lines outline transplanted human IMA. C, Quantitative analyses of maximal external aortic diameters. D, Representative images of hematoxylin and eosin (H&E) or Verhoeff elastic (EVG) staining of AAA tissues. Scale bar=400 μm. E, Quantification of elastin contents shown in the EVG staining in aorta in D. F, Mice with human IMA transplants were infused with angiotensin II (Ang II, 1000ng/kg/min) for 7 days. Abdominal aorta frozen sections were immunostained (red) with IL-6, IL-1β, TNFα, or iNOS antibodies. Yellow indicates the colocalization of the cytokines with human monocytes/macrophages. G-J: The percentage of macrophages expressing IL6 (G), IL-1β (H), IL-6 (I) or iNOS (J) relative to the total macrophages were quantified for each grafted IMA. p=0.0048 (C), 0.0022 (E), 5×10⁻⁶ (G), 1.8×10⁻⁵ (H), 2.2×10⁻⁵ (I), and 1.1×10⁻⁵ (J), Recipient mice with ADAR1 shRNA adenoviral vector (Ad-shADAR1)-transduced monocytes vs. with Ad-GFP-transduced monocytes and Ang II infusion n=6. Mann-Whitney test (2-sided) was performed for E. Kruskal-Wallis test with Dunn multiple comparisons test was performed for C, G, H, I, and J.

References

    1. Golledge J, Muller J, Daugherty A, Norman P. Abdominal aortic aneurysm: pathogenesis and implications for management. Arterioscler Thromb Vasc Biol. 2006;26:2605–2613. doi: 10.1161/01.ATV.0000245819.32762.cb - DOI - PubMed
    1. Nordon IM, Hinchliffe RJ, Loftus IM, Thompson MM. Pathophysiology and epidemiology of abdominal aortic aneurysms. Nat Rev Cardiol. 2011;8:92–102. doi: 10.1038/nrcardio.2010.180 - DOI - PubMed
    1. Ma D, Zheng B, Suzuki T, Zhang R, Jiang C, Bai D, Yin W, Yang Z, Zhang X, Hou L, et al. Inhibition of KLF5-Myo9b-RhoA Pathway-Mediated Podosome Formation in Macrophages Ameliorates Abdominal Aortic Aneurysm. Circ Res. 2017;120:799–815. doi: 10.1161/CIRCRESAHA.116.310367 - DOI - PubMed
    1. Dias NV, Ivancev K, Malina M, Resch T, Lindblad B, Sonesson B. Does the wide application of endovascular AAA repair affect the results of open surgery? Eur J Vasc Endovasc Surg. 2003;26:188–194. doi: 10.1053/ejvs.2002.1866 - DOI - PubMed
    1. Warner CJ, Roddy SP, Chang BB, Kreienberg PB, Sternbach Y, Taggert JB, Ozsvath KJ, Stain SC, Darling RC, 3rd. Regionalization of Emergent Vascular Surgery for Patients With Ruptured AAA Improves Outcomes. Ann Surg. 2016;264:538–543. doi: 10.1097/SLA.0000000000001864 - DOI - PubMed

Publication types