. 2023 Feb 28;51(4):1895-1913.
doi: 10.1093/nar/gkac1277.

Upstream of N-Ras C-terminal cold shock domains mediate poly(A) specificity in a novel RNA recognition mode and bind poly(A) binding protein

Affiliations

Upstream of N-Ras C-terminal cold shock domains mediate poly(A) specificity in a novel RNA recognition mode and bind poly(A) binding protein

Nele Merret Hollmann et al. Nucleic Acids Res. .

Abstract

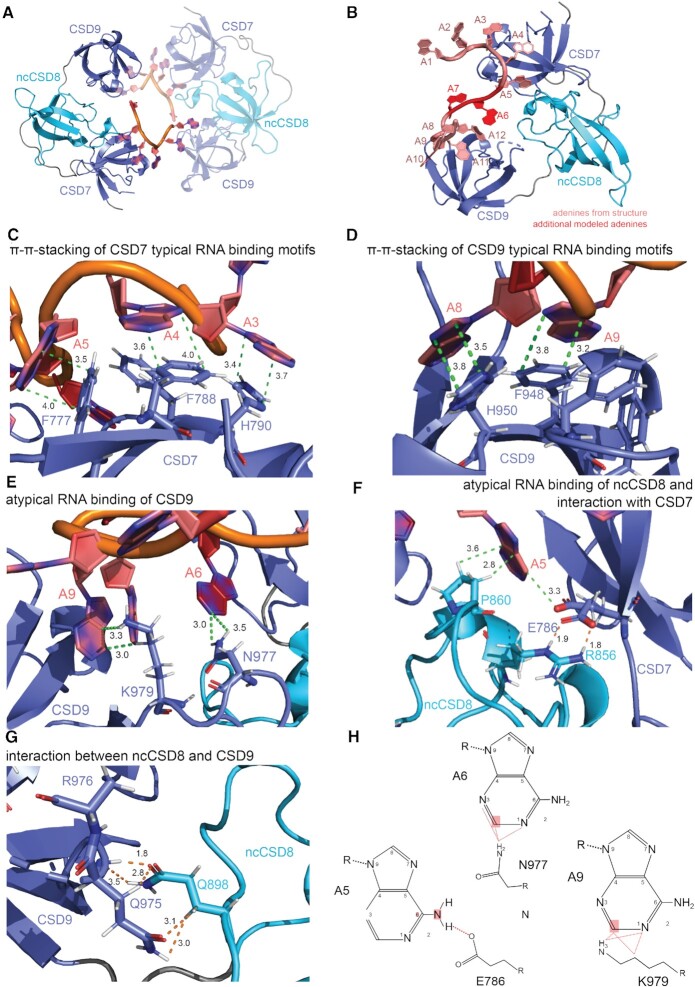
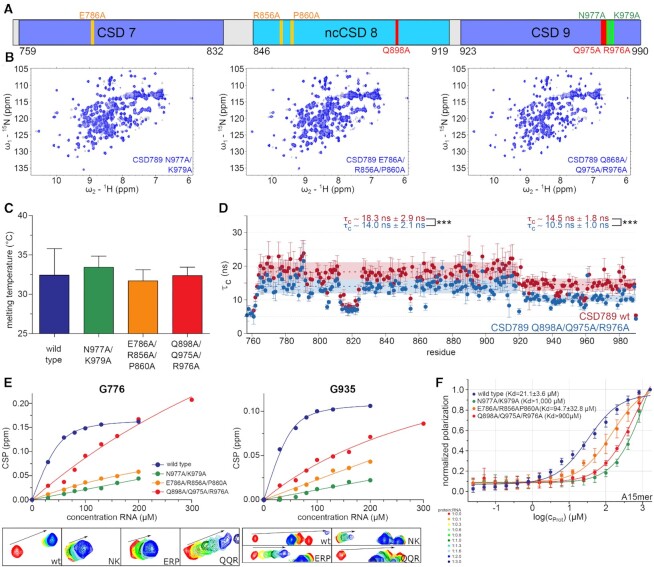
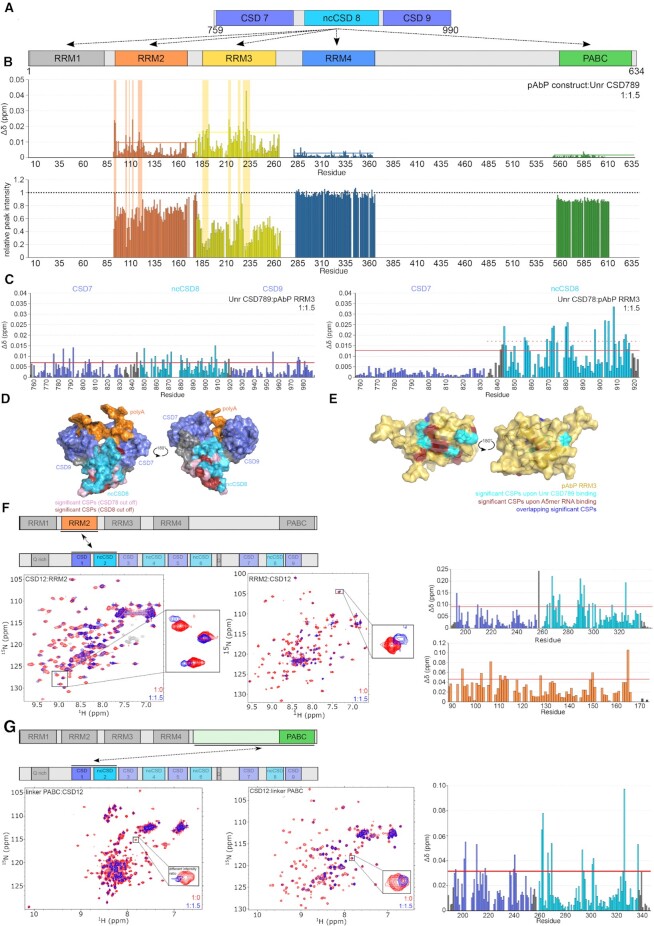
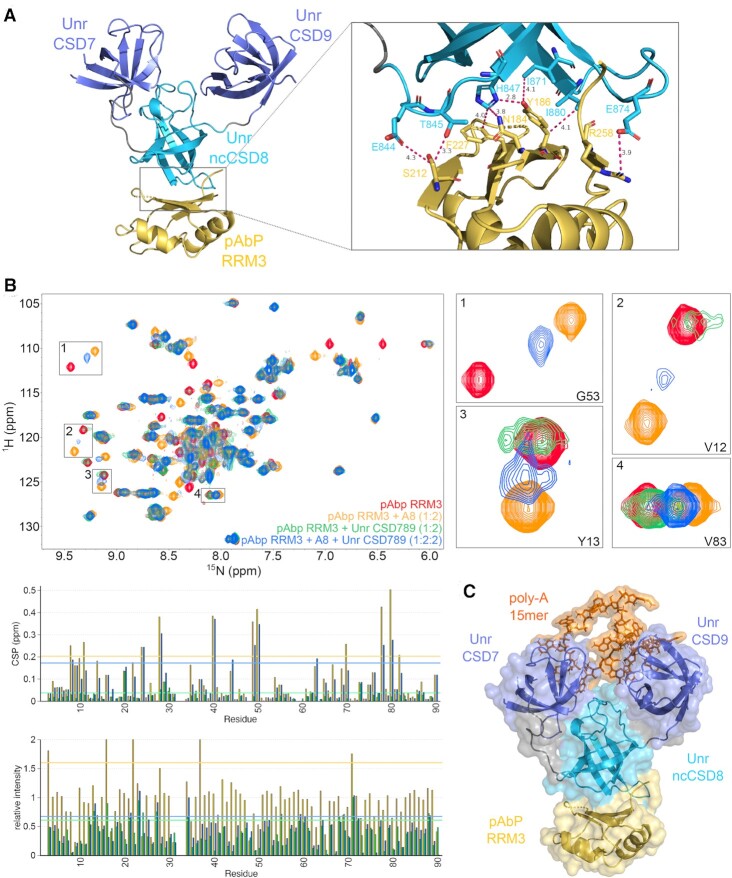
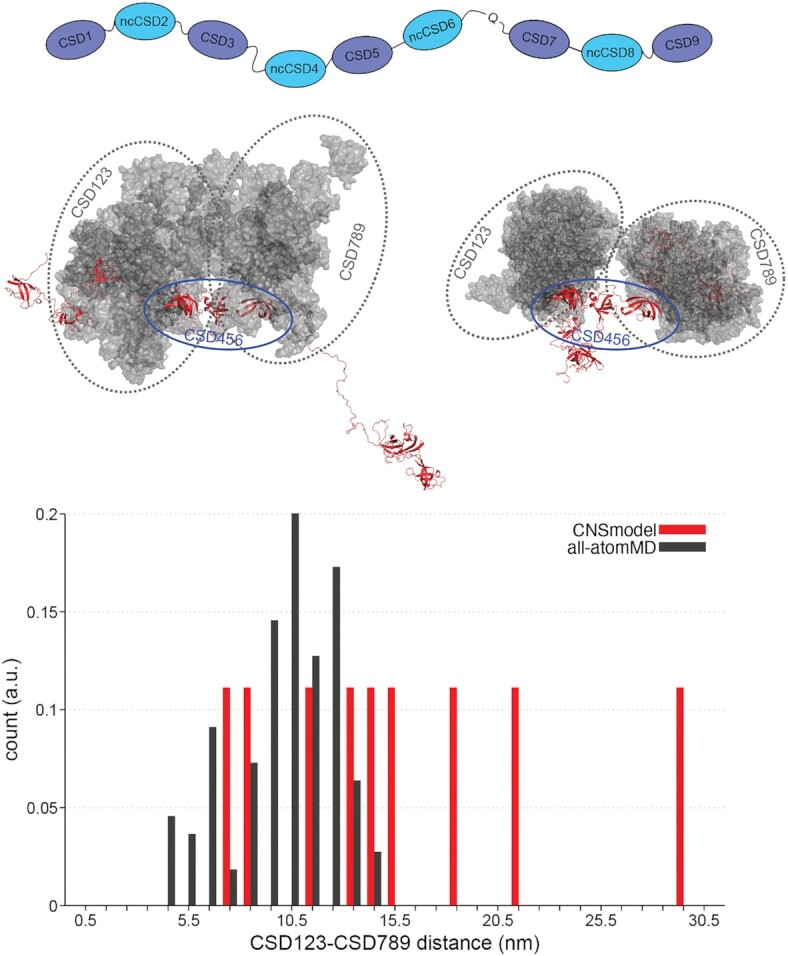
RNA binding proteins (RBPs) often engage multiple RNA binding domains (RBDs) to increase target specificity and affinity. However, the complexity of target recognition of multiple RBDs remains largely unexplored. Here we use Upstream of N-Ras (Unr), a multidomain RBP, to demonstrate how multiple RBDs orchestrate target specificity. A crystal structure of the three C-terminal RNA binding cold-shock domains (CSD) of Unr bound to a poly(A) sequence exemplifies how recognition goes beyond the classical ππ-stacking in CSDs. Further structural studies reveal several interaction surfaces between the N-terminal and C-terminal part of Unr with the poly(A)-binding protein (pAbp). All interactions are validated by mutational analyses and the high-resolution structures presented here will guide further studies to understand how both proteins act together in cellular processes.


Figures

Figure 1.
Figure 1.
Restricted flexibility between ncCSD8 and CSD9 within CSD789 of Drosophila Unr. (A) Schematic overview of CSD789 localization within the Drosophila Unr full length context. (B) 15N relaxation data of CSD789 suggests that CSD9 tumbles independtly from CSD78 (CSD78: τc = 18.3 ± 2.9 ns versus CSD9: τc = 14.5 ± 1.8 ns). The rotational correlation time (τc), which derives from the 15N transverse and longitudinal relaxation experiments, is plotted per residue. The error bars indicate the error propagation of the two relaxation experiments, which are initially derived from the quality of the exponential fit and the deviation between duplicates of two different relaxation delays. (C) Structure modeling and a SAXS driven MD simualtion using SAXS data of Unr CSD789 indicate a restricted flexibility between ncCSD8 and CSD9. All structures are superimposed on CSD78 to see the flexibility of CSD9. Grey colored structures show the worst fitting structures, whereas green/blue show the best fitting ones. The MD simulated structures are shown in yellow. (D) Overlaid 1H,15N-HSQC spectra of CSD78, CSD9 and CSD789 (left) showing CSPs in the termini of the single constructs (red boxes), but also within CSD9 (right). Canonical CSDs are colored blue throughout the whole figure and non-canonical CSDs cyan.
Figure 2.
Figure 2.
Joint tumbling of ncCSD8 and CSD9 within CSD789 upon RNA binding. (A) NMR titrations and the corresponding fit of residues G776 and G935 of CSD789 titrations with poly(A)-mers of different length (A5-mer: red, A7-mer: orange, A8-mer: green, A9-mer blue, A15-mer purple). (B) The averaged dissociation constants (Kd), which were extracted from the NMR fit (A5-mer) or from at least three independent ITC measurements (A7-mer, A8-mer, A9-mer and A15-mer) are plotted for different RNA lengths. The error bars indicate the standard deviation. (C, D) 15N relaxation data of CSD789 (Figure 1B) overlaid with data of the same protein bound to an A5-mer (C) (CSD78: τc = 15.1 ± 1.5 ns versus CSD9: τc = 13.5 ± 2.4 ns) or an A15-mer (D) RNA (CSD78: τc = 18.3 ± 1.5 ns versus CSD9: τc = 18.4 ± 1.3 ns) indicating, that CSD7-ncCSD8 and CSD9 only tumble together upon binding to the longer RNA. The rotational correlation time is plotted per residue. The error bars indicate the error propagation of the two relaxation experiments, which are initially derived from the quality of the exponential fit and the deviation between duplicates of two different relaxation delays. The statistical significance of differences in rotational correlation times was calculated using an unpaired t-test. N.S. meaning non significant, * meaning a P-value of P < 0.05 and *** of P < 0.001. Canonical CSDs are colored blue throughout the whole figure and non-canonical CSDs cyan.
Figure 3.
Figure 3.
Crystal structure of CSD789 bound to a poly(A) RNA showing typical and atypical RNA contacts and domain-domain interactions. (A) The crystal structure of CSD789 shows all three CSDs bound to five adenines of a poly(A) RNA (PDB: 7zhh). The symmetry mate in the same unit cell is highlighted by lower opacity. One RNA strand is bound to CSD7 and CSD9 of the symmetry mate. (B) A data-driven model of a 1:1 CSD789-RNA complex in solution in which the two RNA strands from both symmetry mates (A1–A5 and A8–A12; pale red) are linked together by two additional nucleotides (A6 and A7; dark red) is shown. The protein–RNA contacts of the two additional nucleotides are validated by solution NMR and mutational analysis (see Figure 4). (C, D) The RNA binding residues within CSD7 (C; F777, F788 and H790) and CSD9 (D; F948 and H950) form the CSD typical π–π-stacking of the RNA bases and the aromatic rings. (E) Atypical RNA binding residues of CSD9 (N977 and K979) interact with the RNA base-specifically (A6 and A9). (F) Residues of ncCSD8 (R856 and P860) interact with the RNA base-specifically (A5) and with E786 of CSD7. The electron density suggested two different conformations for E786, which are shown in the crystal structure. (G) Interaction between two glutamines, one in ncCSD8 (Q868) and one in CSD9 (Q975), strengthen this domain-domain interaction. Dashed lines show the distance between atoms of an amino acid and a nucleotide (green) or between two amino acids (orange). The RNA is colored in red, canonical CSDs in blue and ncCSD8 in cyan. Due to potenital flexibility, no side chain could be build for R976. (H) Adenine-specific interactions of CSD789 are illustrated. A hydrogen bond is formed between a free oxygen of E786 and NH6 of A5. Further interactions are formed between the hydrogens of C2 of A6 and A9 and the residues N977 and K979 respectively. The hydrogens have been added to the structure during modelling of the 1:1 complex. Canonical CSDs are colored blue throughout the whole figure and non-canonical CSDs cyan.
Figure 4.
Figure 4.
Mutational anaylsis of the solution structure of CSD789-A15-mer in vitro. (A) The locations of mutations within CSD789 are highlighted schematically. (B) 1H,15N-HSQC spectra of CSD789 wild type (grey) overlaid with the spectra of the differenet mutants (blue), indicating that mutations do not perturb the CSD789 fold. (C) Melting temperatures for CSD789 wild type and the different mutants show no significant difference between the different constructs as determined by NanoDSF. Shown is the mean and standard deviation of three independent measurements. (D) 15N relaxation data of CSD789 wild type protein (red; CSD78: τc = 18.3 ± 2.9 ns versus CSD9: τc = 14.5 ± 1.8 ns) overlaid with data of a CSD789 Q898A/Q975A/R976A mutant (blue; CSD78: τc = 14.0 ± 2.1 ns versus CSD9: τc = 10.5 ± 1.0 ns). The rotational correlation time is plotted per residue. The error bars indicate the error propagation of the two relaxation experiments, which are initially derived from the quality of the exponential fit and the deviation between duplicates of two different relaxation delays (see methods). The statistical significance of differences in rotational correlation times was calculated using an unpaired t-test. *** meaning a P-value of P < 0.001. (E) Chemical shift pertubations at different titration concentrations and the corresponding fit of two representative residues of the different CSD789 variants with a poly(A)-15-mer. (F) Fluorescence polarization assays of CSD789 wild type and the different mutants to an A-15mer. Shown is the average binding affinity of at least three independent measurements with their standard deviation. The wildtype and mutant proteins are highlighted in different colors (wild type: blue, N977A/K979A: green, E786A/R856A/P860A: orange, Q898A/Q975A/R976A: red). Canonical CSDs are colored blue throughout the whole figure and non-canonical CSDs cyan.
Figure 5.
Figure 5.
Unr interactions with the Drosophila poly(A)-binding protein (pAbp). (A) Interactions of Unr CSD789 with the different domains within pAbp (RRM1–4 and PABC) were tested. (B) CSP and intensity plots of differrent 1H,15N-HSQC NMR titration experiments with different 15N labeled pAbp constructs and unlabeled Unr CSD789. The red line in the CSP plots indicates the average plus standard deviation of all measured CSPs at a protein:protein ratio of 1:1.5, which was used to identify significant shifts (53). (C) CSP plots of different 1H,15N-HSQC NMR titration experiments with 15N labeled Unr CSD789 and unlabeled pAbp RRM3 at a protein:protein ratio of 1:1.5. The red line in the CSP plots indicates the average plus standard deviation of all measured CSPs which was used to identify significant shifts (57). The dotted red line highlights the average plus standard deviation of the chemical shifts of CSD8 only. (D) The significant shifts are highlighted on the surface of the CSD789 structure bound to poly(A)-RNA. Residues of CSD78 with significant CSPs are highlighed in pink, whereas residues of CSD8 only with significant CSPs are colored in red. (E) Residues with significant CSPs upon binding of CSD789 (cyan), an A5-mer RNA (red) and residues that overlap between the two titrations (blue) are highlighted on the surface of the pAbp RRM3 complex structure (yellow). (F, G) 1H,15N-HSQC NMR spectra showing the interaction between Unr CSD12 and pAbp RRM2 (F) and the linker PABC region (G). The difference between the bound and unbound spectra are shown for each residue in the CSP plots. Canonical CSDs are colored blue throughout the whole figure and non-canonical CSDs cyan.
Figure 6.
Figure 6.
Structure determination of Unr CSD789 and pAbp RRM3. (A) A crystal structure of Unr CSD789 (blue) and pAbp RRM3 (yellow) confirming the interaction surface observed by NMR titrations (PDB code: 7zhr). The detailed view on the interaction surface shows several amino acids of both proteins interacting with each other (right) (CSD789: E844, T845, H847, I871, E874, I880; RRM3: N184, Y186, S212 and F227). (B)1H,15N-HSQC NMR spectra showing the competitve binding between an A8-mer RNA and Unr CSD789 to pAbp RRM3. Shown is an overlay of spectra from apo pAbp RRM3 (red), bound to A8-mer (orange), titrated with Unr CSD789 (green) and titrated with both, A8-mer and Unr CSD789 (blue). Selected peaks were zoomed in to visualize the competition. The difference between the spectra are additionally illustrated for each residue in CSP and intensity ratio plots. (C) A hybrid model generated by superposition of the crystal structure of CSD789 (blue) bound to a poly(A)-15mer (orange) and bound to pAbp RRM3 (yellow) visualizing that the interaction surfaces for both binding partners are on opposite sites. Canonical CSDs are colored blue and non-canonical CSDs in cyan.
Figure 7.
Figure 7.
Structure modeling towards a deeper understanding of translation regulation. A schematic representation of the flexible regions within Unr, that were used for the almost full-length model generation (top). MD simulations showing that regardless of taking elongated or compact input structures (red), CSD123 and CSD789 come close in space (grey). All structures are superimposed on CSD456 (red and indicated with blue oval). Bar histogram, showing the distance distribution (nm) between CSD123 and CSD789 of the generated input structures (red) and the SAXS-supported MD simulations (grey).

Similar articles

Cited by

References

    1. Bieri P., Greber B.J., Ban N.. High-resolution structures of mitochondrial ribosomes and their functional implications. Curr. Opin. Struct. Biol. 2018; 49:44–53. - PubMed
    1. Voorhees R.M., Ramakrishnan V.. Structural basis of the translational elongation cycle. Annu. Rev. Biochem. 2013; 82:203–236. - PubMed
    1. Sainsbury S., Bernecky C., Cramer P.. Structural basis of transcription initiation by RNA polymerase iI. Nat. Rev. Mol. Cell Biol. 2015; 16:129–143. - PubMed
    1. Cramer P., Armache K.-J., Baumli S., Benkert S., Brueckner F., Buchen C., Damsma G.E., Dengl S., Geiger S.R., Jasiak A.J.et al. .. Structure of eukaryotic RNA polymerases. Annu. Rev. Biophys. 2008; 37:337–352. - PubMed
    1. Lee J., Borukhov S.. Bacterial RNA polymerase-DNA interaction - the driving force of gene expression and the target for drug action. Front. Mol. Biosci. 2016; 3:73. - PMC - PubMed

Publication types