. 2023 Jun;17(6):1148-1166.
doi: 10.1002/1878-0261.13379. Epub 2023 Feb 11.

Tetraploidy-linked sensitization to CENP-E inhibition in human cells

Affiliations

Tetraploidy-linked sensitization to CENP-E inhibition in human cells

Koya Yoshizawa et al. Mol Oncol. 2023 Jun.

Abstract

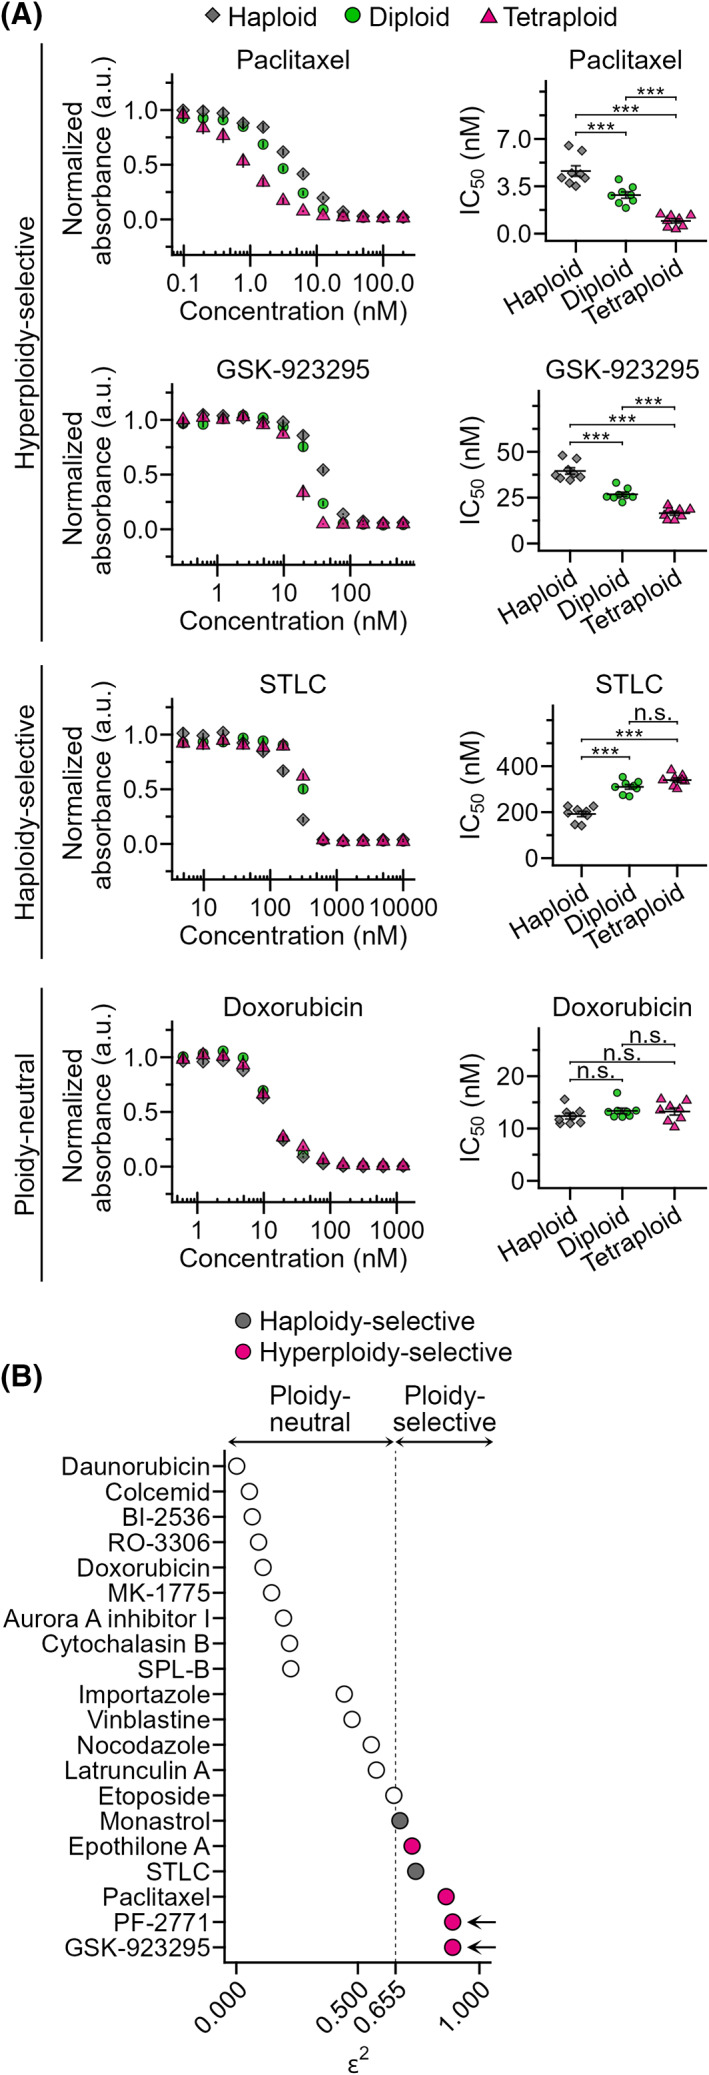
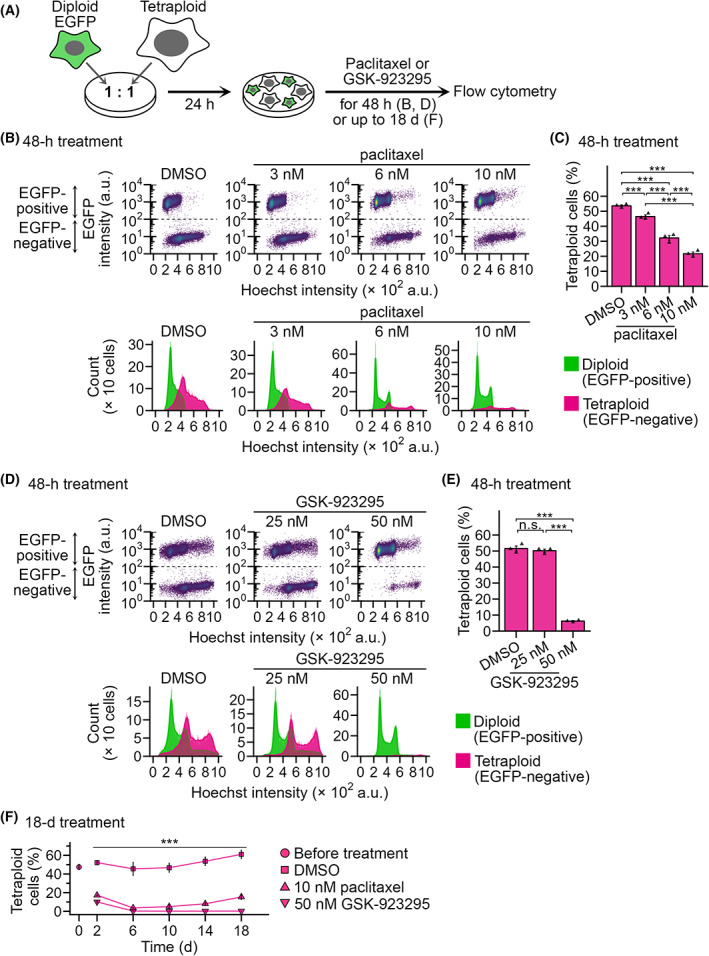
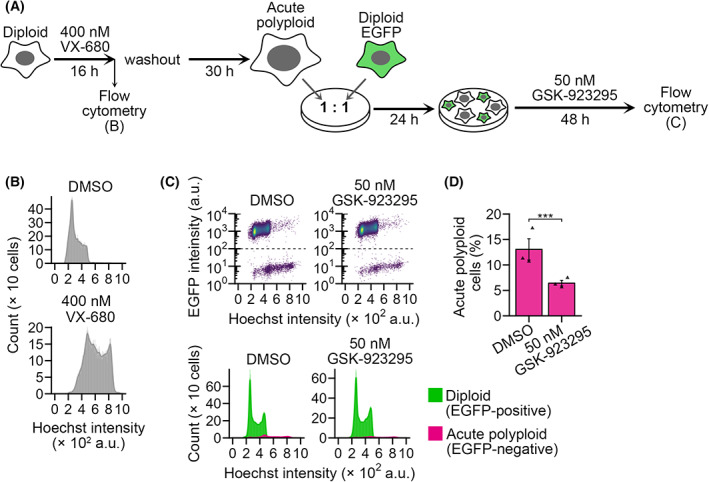
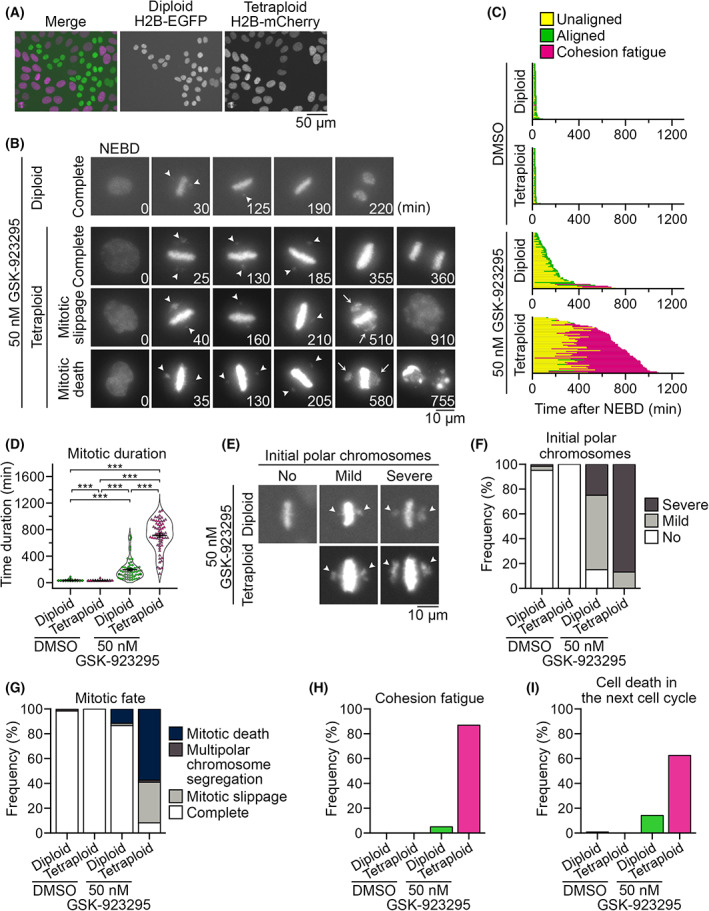
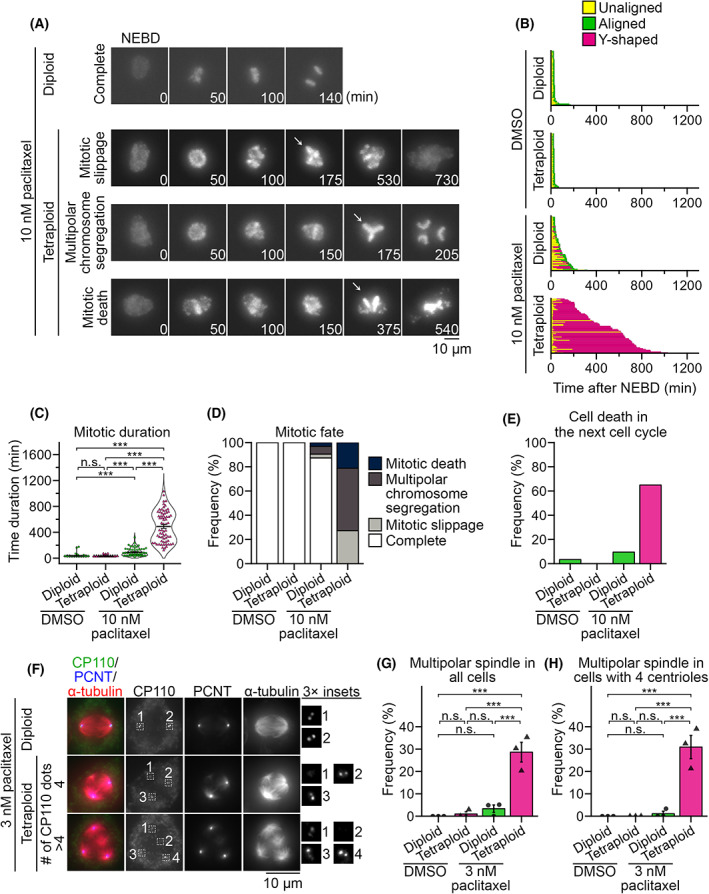
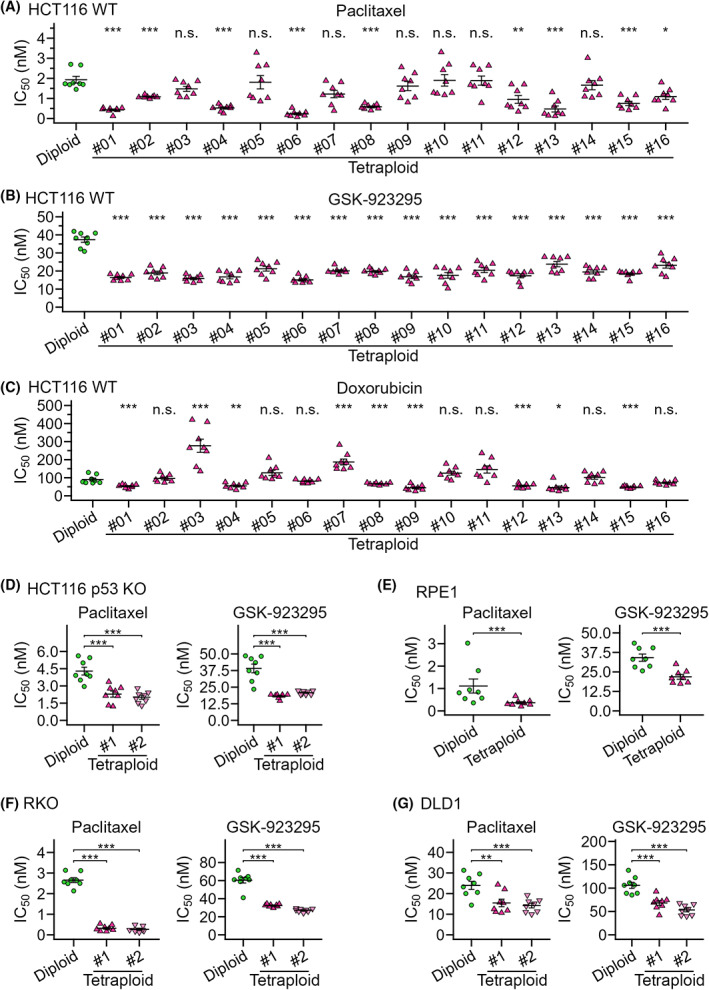
Tetraploidy is a hallmark of cancer cells, and tetraploidy-selective cell growth suppression is a potential strategy for targeted cancer therapy. However, how tetraploid cells differ from normal diploids in their sensitivity to anti-proliferative treatments remains largely unknown. In this study, we found that tetraploid cells are significantly more susceptible to inhibitors of a mitotic kinesin (CENP-E) than are diploids. Treatment with a CENP-E inhibitor preferentially diminished the tetraploid cell population in a diploid-tetraploid co-culture at optimum conditions. Live imaging revealed that a tetraploidy-linked increase in unsolvable chromosome misalignment caused substantially longer mitotic delay in tetraploids than in diploids upon moderate CENP-E inhibition. This time gap of mitotic arrest resulted in cohesion fatigue and subsequent cell death, specifically in tetraploids, leading to tetraploidy-selective cell growth suppression. In contrast, the microtubule-stabilizing compound paclitaxel caused tetraploidy-selective suppression through the aggravation of spindle multipolarization. We also found that treatment with a CENP-E inhibitor had superior generality to paclitaxel in its tetraploidy selectivity across a broader spectrum of cell lines. Our results highlight the unique properties of CENP-E inhibitors in tetraploidy-selective suppression and their potential use in the development of tetraploidy-targeting interventions in cancer.

Keywords: chromosome; mitosis; motor protein; ploidy.


Conflict of interest statement

The authors declare no conflict of interest.

Figures

Fig. 1
Fig. 1
Identification of ploidy‐selective anti‐mitotic compounds. (A) Dose–response curve of normalized absorbance (left) and calculated IC50 values (right) in a comparative colorimetric cell proliferation assay using anti‐mitotic compounds in haploid, diploid and tetraploid HAP1 cells. Mean ± standard error (SE) of eight replicates from four independent experiments for each condition. Asterisks indicate statistically significant differences in IC50 between cells with different ploidies (***P < 0.001, n.s.: not significant, the Steel–Dwass test). See also Fig. S2 and Table S1 for data of all compounds tested. (B) Evaluation of ploidy selectivity of different anti‐mitotic compounds based on effect size ε 2 of ploidy‐linked IC50 differences obtained by analyzing data in Fig. S2 using the Kruskal–Wallis test (eight replicates from four independent experiments were analyzed). Inhibitors that have significant ploidy‐dependent differences in their efficacy (ε 2 > 0.655) with positive linear correlations are categorized as ‘hyperploidy‐selective’, and those with significantly higher efficacy toward haploids as ‘haploidy‐selective’. Arrows indicate CENP‐E inhibitors.
Fig. 2
Fig. 2
Selective suppression of tetraploid HAP1 cells in diploid‐tetraploid co‐culture by paclitaxel or GSK‐923295. (A) Scheme of diploid‐tetraploid co‐culture experiment. (B,D) Flow cytometric analyses of diploid and tetraploid cell numbers in their co‐culture treated with different concentrations of paclitaxel (B) or GSK‐923295 (D) for 48 h. Dot plots of EGFP intensity against the Hoechst signal (corresponding to DNA content) and histograms of the Hoechst signal are shown at top and bottom, respectively. Cell populations originating from diploid or tetraploid cells were distinguished based on EGFP signal intensity and are displayed separately in the histograms. Representative data from three independent experiments. (C,E) The proportion of tetraploid cells in the diploid‐tetraploid co‐culture. Mean ± SE of three independent experiments for each condition. Asterisks indicate statistically significant differences between conditions (***P < 0.001, the Steel–Dwass test). (F) Time course of tetraploid proportion in diploid‐tetraploid co‐culture treated with 10 nm paclitaxel or 50 nm GSK‐923295. The data point at day 0 corresponds to the initial tetraploid proportion before adding the compounds. Mean ± SE of three independent experiments for each condition. Asterisks indicate statistically significant differences from DMSO‐treated control (***P < 0.001, the Steel test). See also Fig. S4C for the corresponding flow cytometry data.
Fig. 3
Fig. 3
Selective suppression of acute polyploid HAP1 cells in co‐culture by GSK‐923295. (A) Scheme of diploid‐acute polyploid co‐culture experiment. (B) Flow cytometric analyses of DNA content in HAP1 cells immediately after 16 h of VX‐680 treatment. Representative data from three independent experiments. (C) Flow cytometric analyses of diploid and acute polyploid cell numbers in their co‐culture treated with 50 nm GSK‐923295 for 48 h. Dot plots of EGFP intensity against the Hoechst signal (corresponding to DNA content) and histograms of the Hoechst signal are shown at top and bottom, respectively. Cell populations originating from diploid or acute polyploid cells were distinguished based on EGFP signal intensity and are displayed separately in the histograms. Representative data from three independent experiments. (D) The proportion of acute polyploid cells (EGFP‐negative) in the co‐culture. Mean ± SE of three independent experiments for each condition. Asterisks indicate statistically significant differences between conditions (***P < 0.001, the Brunner–Munzel test).
Fig. 4
Fig. 4
Tetraploidy‐linked aggravation of chromosome misalignment and mitotic failure upon GSK‐923295 treatment. (A) Fluorescence microscopy of co‐cultured diploid and tetraploid HAP1 cells expressing histone H2B‐EGFP and histone H2B‐mCherry, respectively. Representative data from two independent experiments. (B) Time‐lapse images of the mitotic progression of GSK‐923295‐treated diploid or tetraploid cells in the co‐culture. Arrowheads: misaligned polar chromosomes. Arrows: Gross chromosome scattering caused through cohesion fatigue. Representative data from two independent experiments. (C) Analysis of mitotic progression of control and GSK‐923295‐treated diploid or tetraploid cells in (B). Each bar represents a single mitotic event (from NEBD to anaphase onset or mitotic exit) in a dividing cell. At least 60 cells from two independent experiments were analyzed for each condition. (D) Mitotic duration (from NEBD to anaphase onset or mitotic exit) in control and GSK‐923295‐treated diploid or tetraploid cells in (B). Mean ± SE of at least 60 cells from two independent experiments for each condition. Asterisks indicate statistically significant differences between conditions (***P < 0.001, the DSCF test). (E) Different degrees of polar chromosome misalignment appeared upon the formation of the metaphase plates (initial polar chromosomes; arrowheads) in GSK‐923295‐treated diploid or tetraploid cells. Representative data from two independent experiments. (F–I) Frequency of different degrees of initial polar chromosome misalignment (F), mitotic fates (G), cohesion fatigue event (H) and cell death in the subsequent cell cycle (I) in control and GSK‐923295‐treated diploid or tetraploid cells in (B). At least 60 cells (F–H) and 32 cells (I) from two independent experiments were analyzed for each condition.
Fig. 5
Fig. 5
Tetraploidy‐linked aggravation of multipolar spindle formation upon paclitaxel treatment. (A) Time‐lapse images of the mitotic progression in paclitaxel‐treated diploid H2B‐EGFP and tetraploid H2B‐mCherry HAP1 co‐culture. Arrows: Y‐shaped chromosome arrangement. Representative data from two independent experiments. (B) Analysis of mitotic progression of control and paclitaxel‐treated diploid or tetraploid cells in (A). Each bar represents a single mitotic event (from NEBD to anaphase onset or mitotic exit) in a dividing cell. At least 59 cells from two independent experiments were analyzed for each condition. (C) Mitotic duration (from NEBD to anaphase onset or mitotic exit) in control and paclitaxel‐treated diploid or tetraploid cells in (A). Mean ± SE of at least 59 cells from two independent experiments for each condition. Asterisks indicate statistically significant differences between conditions (***P < 0.001, the DSCF test). (D,E) Frequency of mitotic fates (D) or cell death in the subsequent cell cycle (E) in control and paclitaxel‐treated diploid or tetraploid cells in (A). At least 59 and 97 cell, respectively, from two independent experiments were analyzed for each condition in (D) and (E). (F) Immunofluorescence microscopy of CP110, PCNT and α‐tubulin in 3 nm paclitaxel‐treated diploid or tetraploid cells. Representative data from three independent experiments. (G,H) Frequency of multipolar spindle in control and paclitaxel‐treated diploid or tetraploid cells in (F). Data obtained from all cells or only cells with four centrioles are shown in (G) and (H), respectively. Mean ± SE of three independent experiments. At least 92 and 90 cells, respectively, were analyzed for each condition in (G) and (H). Asterisks indicate statistically significant differences between conditions (***P < 0.001, the Steel–Dwass test).
Fig. 6
Fig. 6
Comparison of efficacy of paclitaxel, GSK‐923295 and doxorubicin between diploids and tetraploids in different cell models. (A–C) IC50 values in a comparative colorimetric cell proliferation assay using paclitaxel (A), GSK‐923295 (B) or doxorubicin (C) in diploid or 16 different tetraploid HCT116 cell lines. (D–G) IC50 values in a diploid‐tetraploid comparative colorimetric cell proliferation assay in HCT116 p53 knock‐out (D), hTERT‐RPE1 (E), RKO (F) and DLD1 (G) cell models. Mean ± SE of eight replicates from four independent experiments for each condition. Asterisks indicate statistically significant differences in IC50 between the control diploid line and each tetraploid line [*P < 0.05, **P < 0.01, ***P < 0.001, the Steel test, except for (E); ***P < 0.001, the Brunner–Munzel test for (E)]. See also Fig. S7 for the dose–response curve of normalized absorbance used to calculate IC50.

Similar articles

Cited by

References

    1. Bielski CM, Zehir A, Penson AV, Donoghue MTA, Chatila W, Armenia J, et al. Genome doubling shapes the evolution and prognosis of advanced cancers. Nat Genet. 2018;50:1189–95. - PMC - PubMed
    1. Zack TI, Schumacher SE, Carter SL, Cherniack AD, Saksena G, Tabak B, et al. Pan‐cancer patterns of somatic copy number alteration. Nat Genet. 2013;45:1134–40. - PMC - PubMed
    1. Fujiwara T, Bandi M, Nitta M, Ivanova EV, Bronson RT, Pellman D. Cytokinesis failure generating tetraploids promotes tumorigenesis in p53‐null cells. Nature. 2005;437:1043–7. - PubMed
    1. Nguyen HG, Makitalo M, Yang D, Chinnappan D, St Hilaire C, Ravid K. Deregulated Aurora‐B induced tetraploidy promotes tumorigenesis. FASEB J. 2009;23:2741–8. - PMC - PubMed
    1. Dewhurst SM, McGranahan N, Burrell RA, Rowan AJ, Grönroos E, Endesfelder D, et al. Tolerance of whole‐genome doubling propagates chromosomal instability and accelerates cancer genome evolution. Cancer Discov. 2014;4:175–85. - PMC - PubMed