

Hydrogen Bonds under Stress: Strain-Induced Structural Changes in Polyurethane Revealed by Rheological Two-Dimensional Infrared Spectroscopy
- PMID: 36688732
- PMCID: PMC9900637
- DOI: 10.1021/acs.jpclett.2c03109
Hydrogen Bonds under Stress: Strain-Induced Structural Changes in Polyurethane Revealed by Rheological Two-Dimensional Infrared Spectroscopy
Abstract
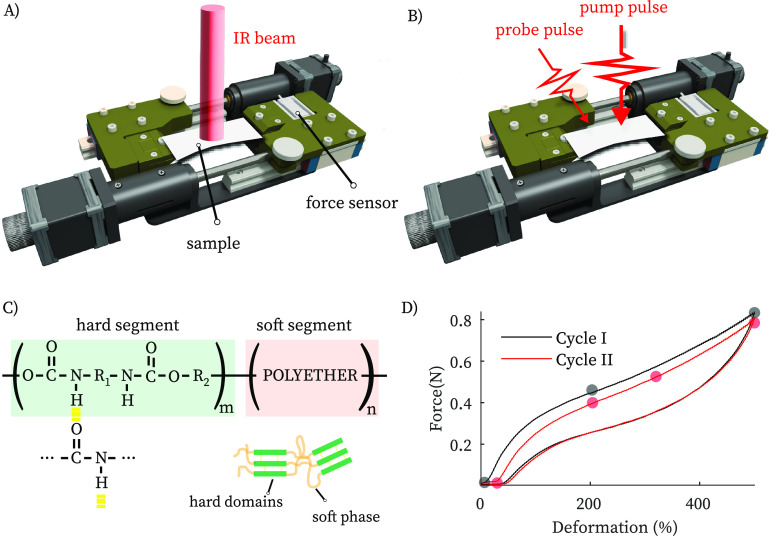
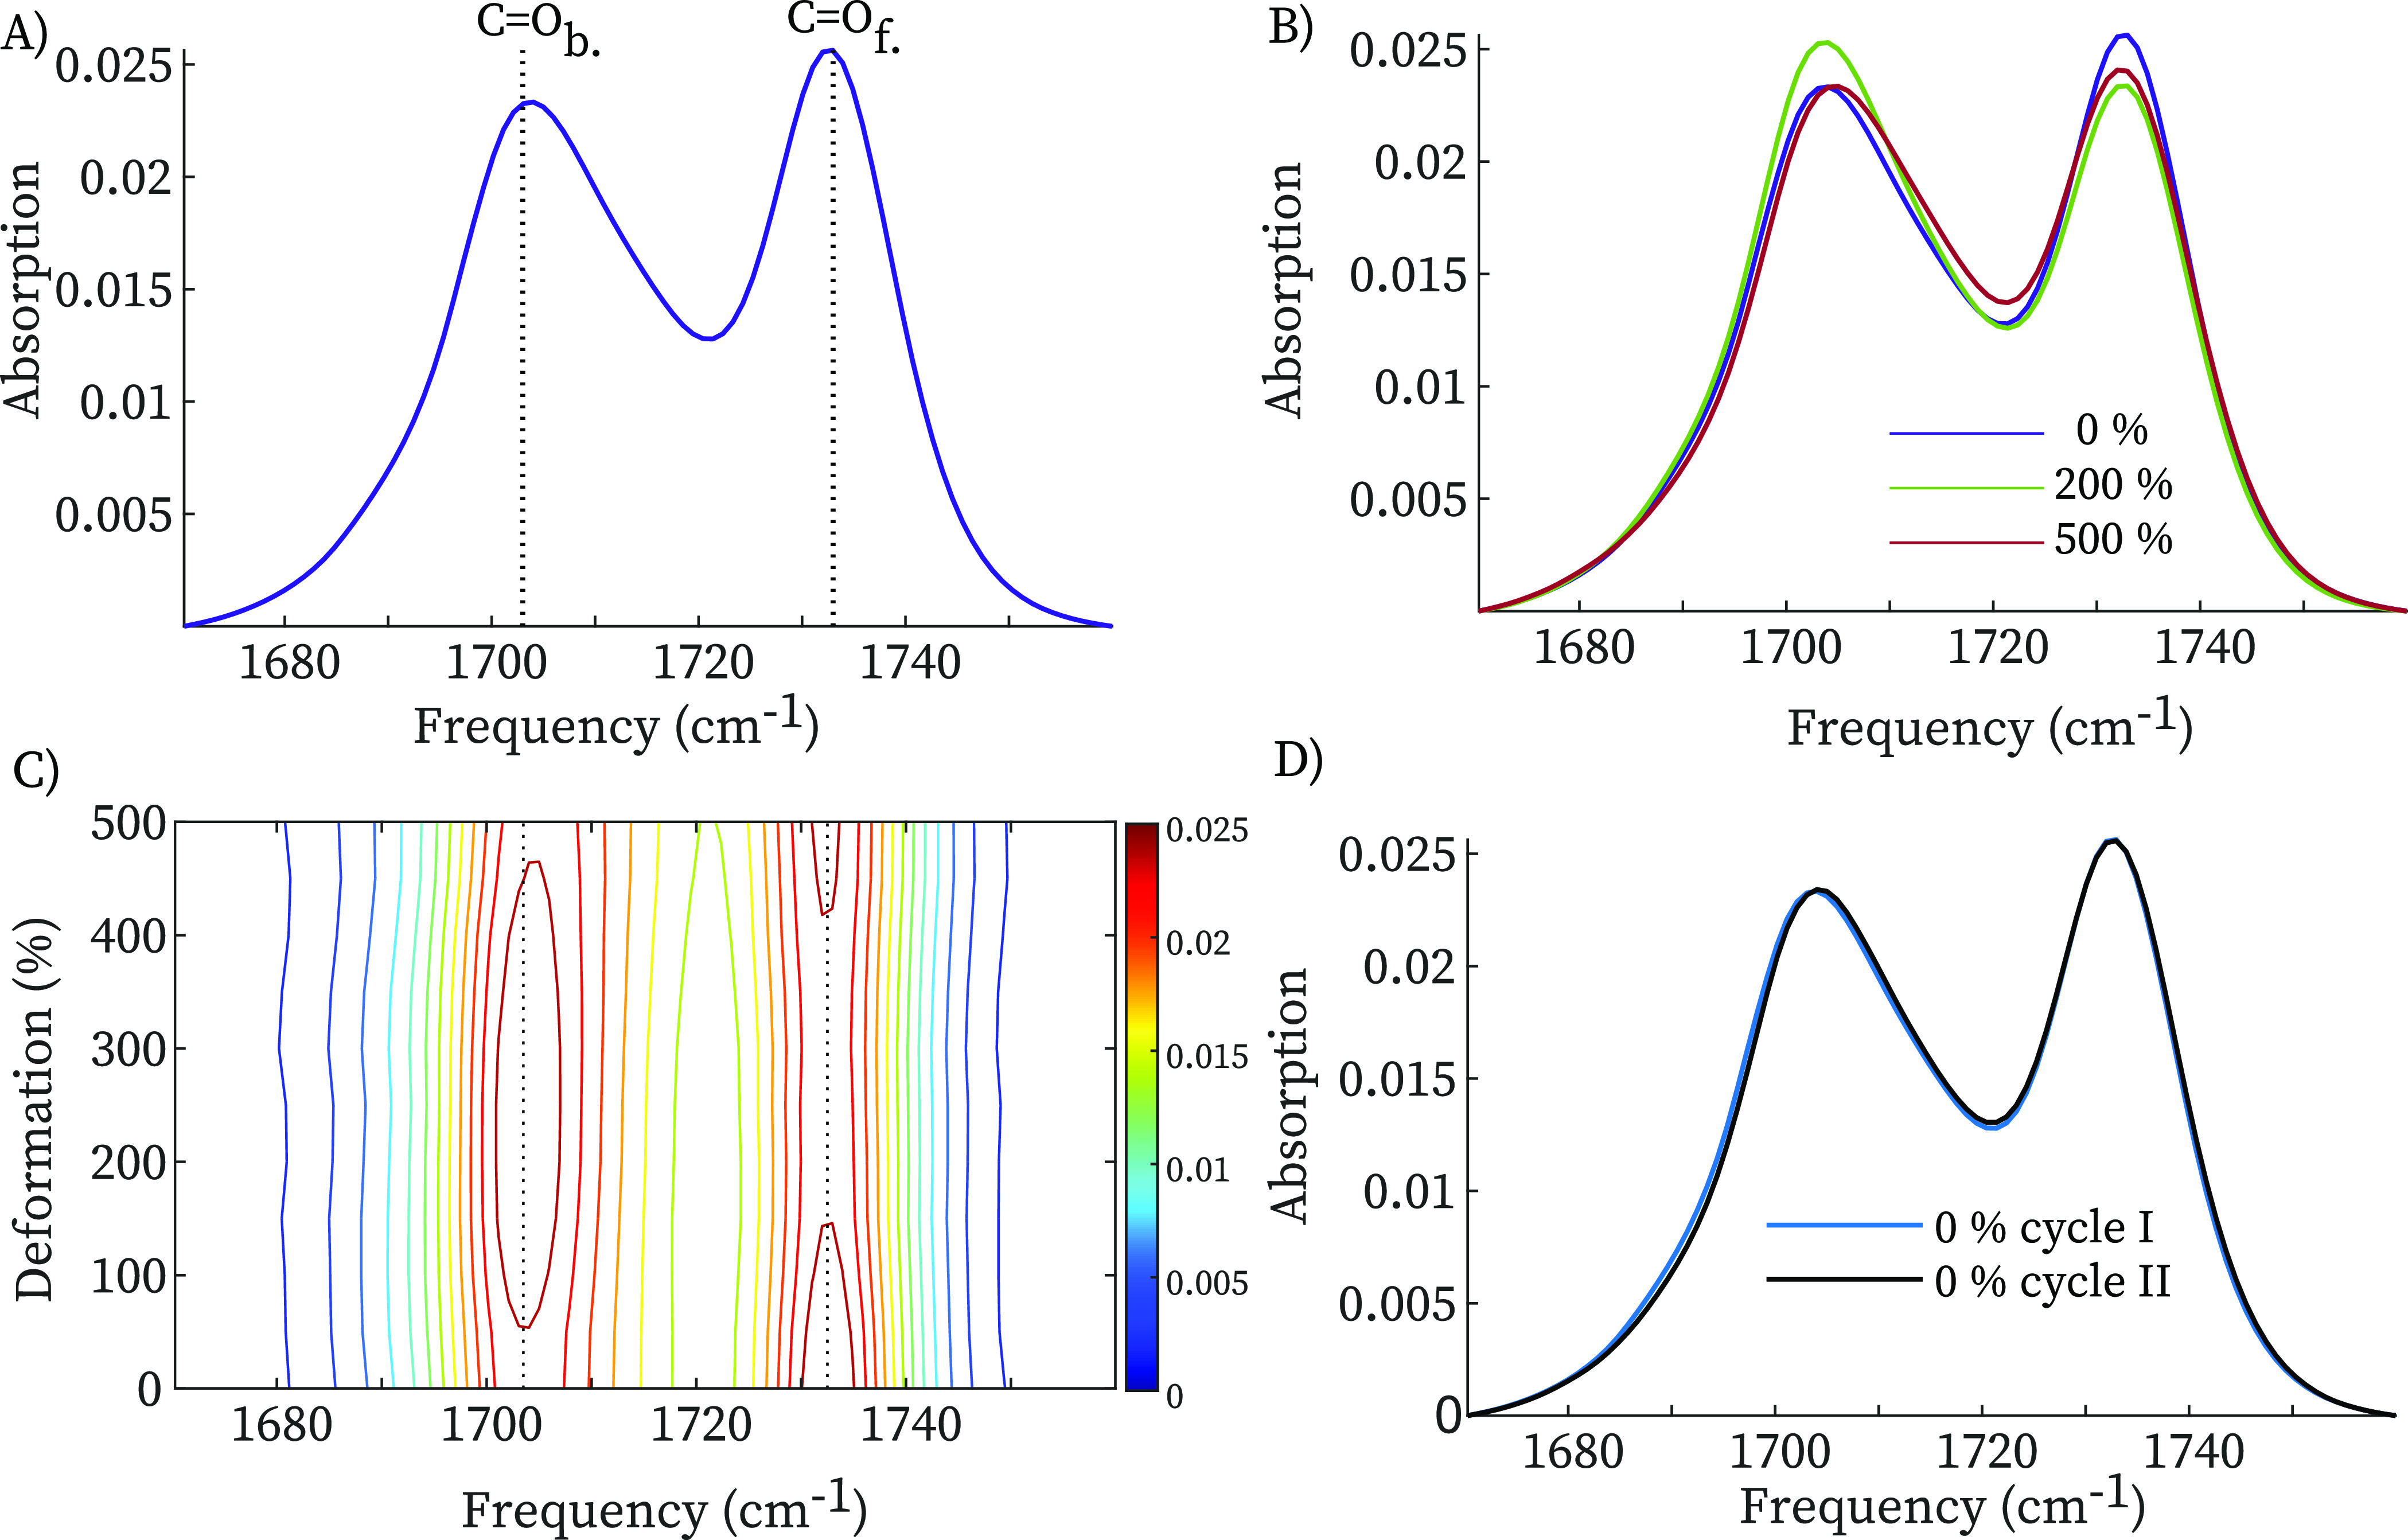
The remarkable elastic properties of polymers are ultimately due to their molecular structure, but the relation between the macroscopic and molecular properties is often difficult to establish, in particular for (bio)polymers that contain hydrogen bonds, which can easily rearrange upon mechanical deformation. Here we show that two-dimensional infrared spectroscopy on polymer films in a miniature stress tester sheds new light on how the hydrogen-bond structure of a polymer is related to its viscoelastic response. We study thermoplastic polyurethane, a block copolymer consisting of hard segments of hydrogen-bonded urethane groups embedded in a soft matrix of polyether chains. The conventional infrared spectrum shows that, upon deformation, the number of hydrogen bonds increases, a process that is largely reversible. However, the 2DIR spectrum reveals that the distribution of hydrogen-bond strengths becomes slightly narrower after a deformation cycle, due to the disruption of weak hydrogen bonds, an effect that could explain the strain-cycle induced softening (Mullins effect) of polyurethane. These results show how rheo-2DIR spectroscopy can bridge the gap between the molecular structure and the macroscopic elastic properties of (bio)polymers.
Conflict of interest statement
The authors declare no competing financial interest.
Figures


Similar articles
-
Spectroscopic study on water diffusion in poly(ester urethane) block copolymer matrix.J Phys Chem B. 2009 Dec 3;113(48):15742-6. doi: 10.1021/jp906718t. J Phys Chem B. 2009. PMID: 19894687
-
Strain softening of nano-scale fuzzy interfaces causes Mullins effect in thermoplastic polyurethane.Sci Rep. 2017 Apr 20;7(1):916. doi: 10.1038/s41598-017-00904-3. Sci Rep. 2017. PMID: 28428544 Free PMC article.
-
Synergetic improvement in the mechanical properties of polyurethanes with movable crosslinking and hydrogen bonds.Soft Matter. 2022 Jul 13;18(27):5027-5036. doi: 10.1039/d2sm00408a. Soft Matter. 2022. PMID: 35695164
-
Two-dimensional infrared spectroscopy of intermolecular hydrogen bonds in the condensed phase.Acc Chem Res. 2009 Sep 15;42(9):1220-8. doi: 10.1021/ar900006u. Acc Chem Res. 2009. PMID: 19425543 Review.
-
Structure of water in the vicinity of amphoteric polymers as revealed by vibrational spectroscopy.J Biomater Sci Polym Ed. 2010;21(14):1877-93. doi: 10.1163/092050610X488278. Epub 2010 Jun 22. J Biomater Sci Polym Ed. 2010. PMID: 20573314 Review.
Cited by
-
Biomimetic Polyurethanes in Tissue Engineering.Biomimetics (Basel). 2025 Mar 17;10(3):184. doi: 10.3390/biomimetics10030184. Biomimetics (Basel). 2025. PMID: 40136838 Free PMC article. Review.
-
The Synthesis and Property Study of NH-Ac-Anchored Multilayer 3D Polymers.Molecules. 2025 Apr 29;30(9):1981. doi: 10.3390/molecules30091981. Molecules. 2025. PMID: 40363786 Free PMC article.
-
Producing polyglycerol polyester polyol for thermoplastic polyurethane application: A novel valorization of glycerol, a by-product of biodiesel production.Heliyon. 2023 Aug 25;9(9):e19491. doi: 10.1016/j.heliyon.2023.e19491. eCollection 2023 Sep. Heliyon. 2023. PMID: 37662775 Free PMC article.
References
-
- Li X.; Wang H.; Xiong B.; Pöselt E.; Eling B.; Men Y. Destruction and Reorganization of Physically Cross-Linked Network of Thermoplastic Polyurethane Depending on Its Glass Transition Temperature. ACS Appl. Polym. Mater. 2019, 1, 3074–3083. 10.1021/acsapm.9b00729. - DOI
-
- Siesler H. W.Analysis/Networks/Peptides; Springer Berlin Heidelberg: Berlin and Heidelberg, Germany, 1984; pp 1–77.
-
- Hofmann G. R.; Sevegney M. S.; Kannan R. M. A Rheo-Optical FTIR Spectrometer for Investigating Molecular Orientation and Viscoelastic Behavior in Polymers. International Journal of Polymer Analysis and Characterization 2004, 9, 245–274. 10.1080/10236660490920237. - DOI
LinkOut - more resources
Full Text Sources
Miscellaneous
