. 2023 Apr 3;220(4):e20220741.
doi: 10.1084/jem.20220741. Epub 2023 Jan 23.

Immune-interacting lymphatic endothelial subtype at capillary terminals drives lymphatic malformation

Affiliations

Immune-interacting lymphatic endothelial subtype at capillary terminals drives lymphatic malformation

Milena Petkova et al. J Exp Med. .

Abstract

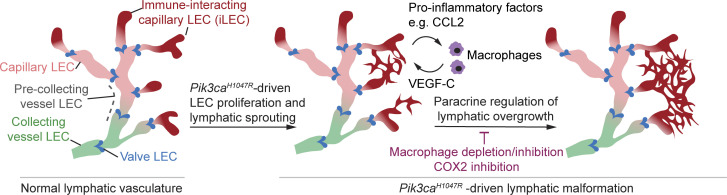
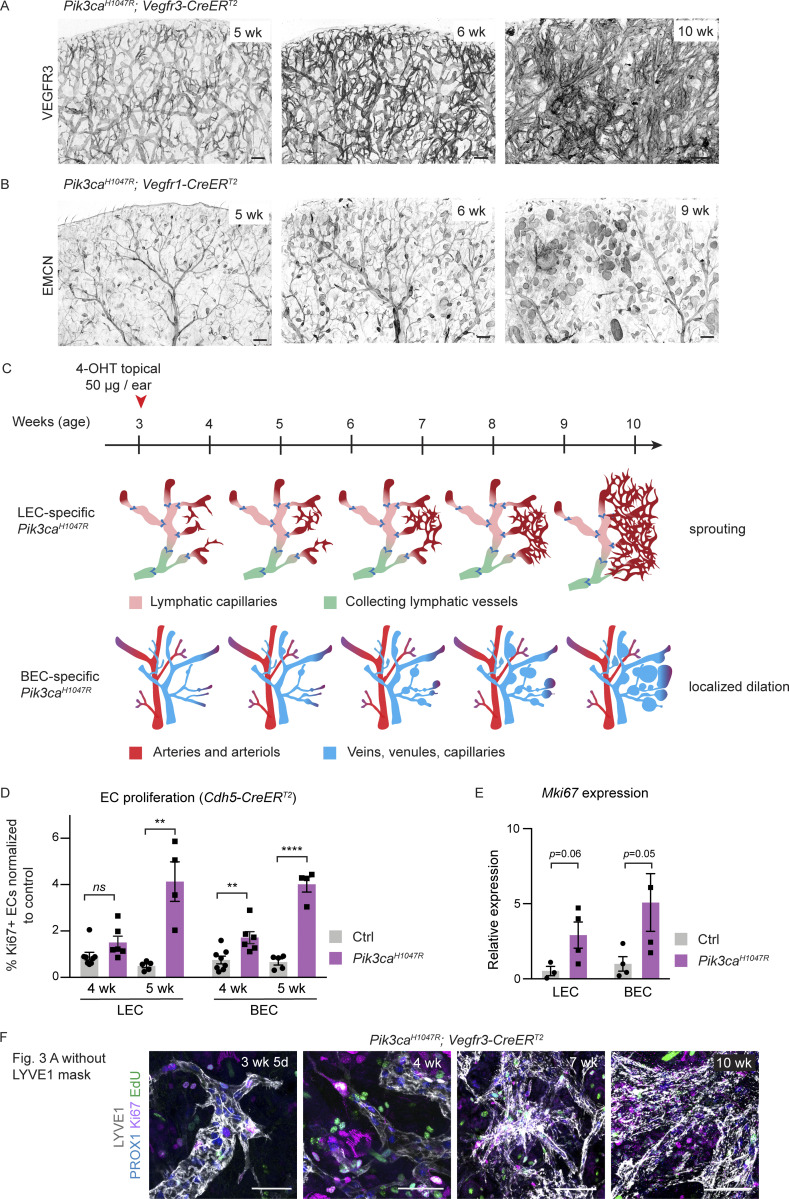
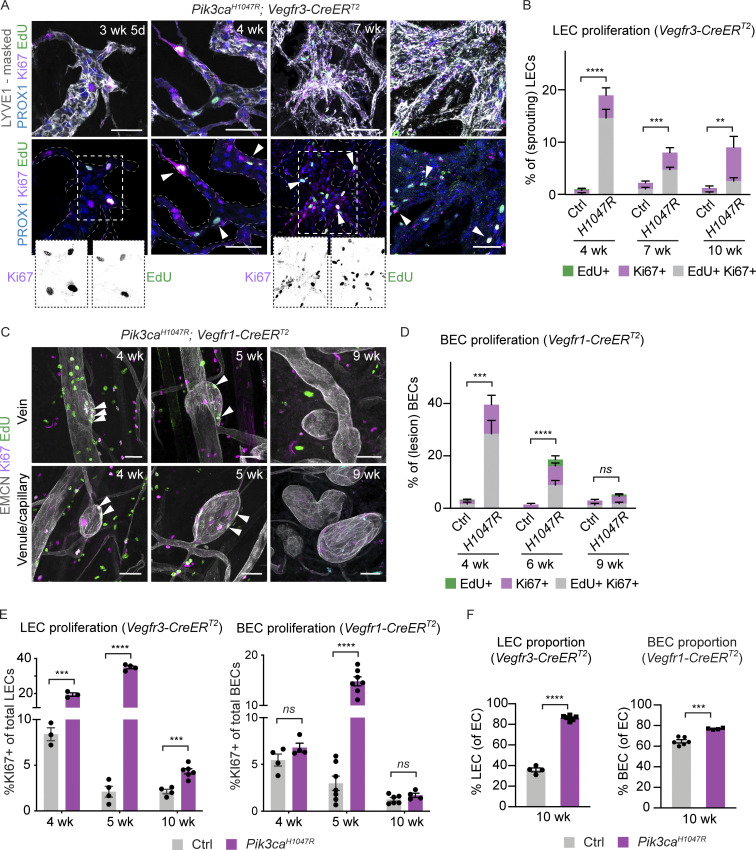
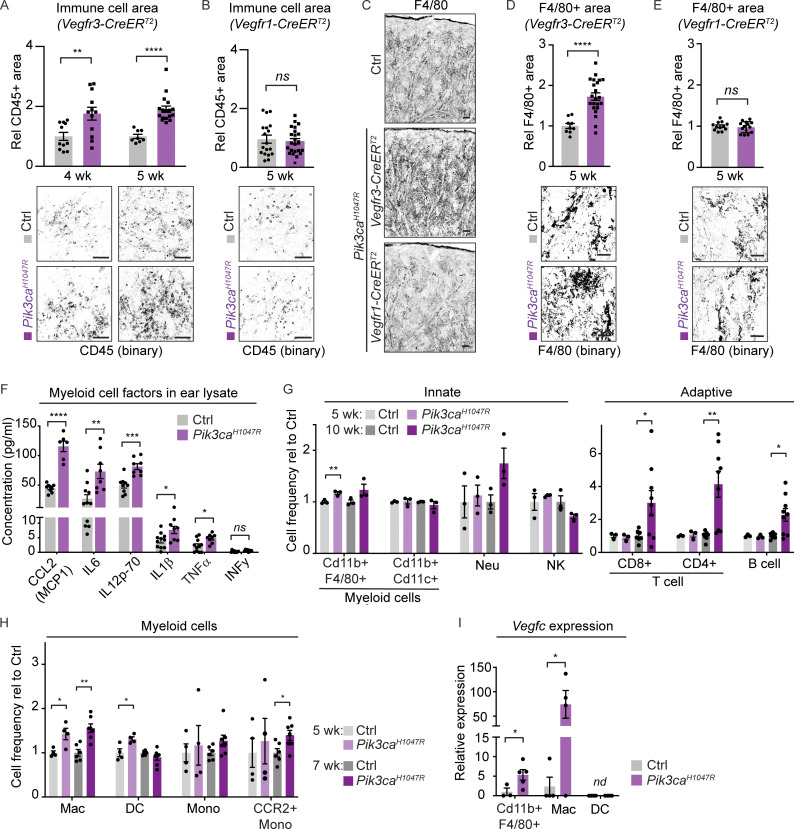
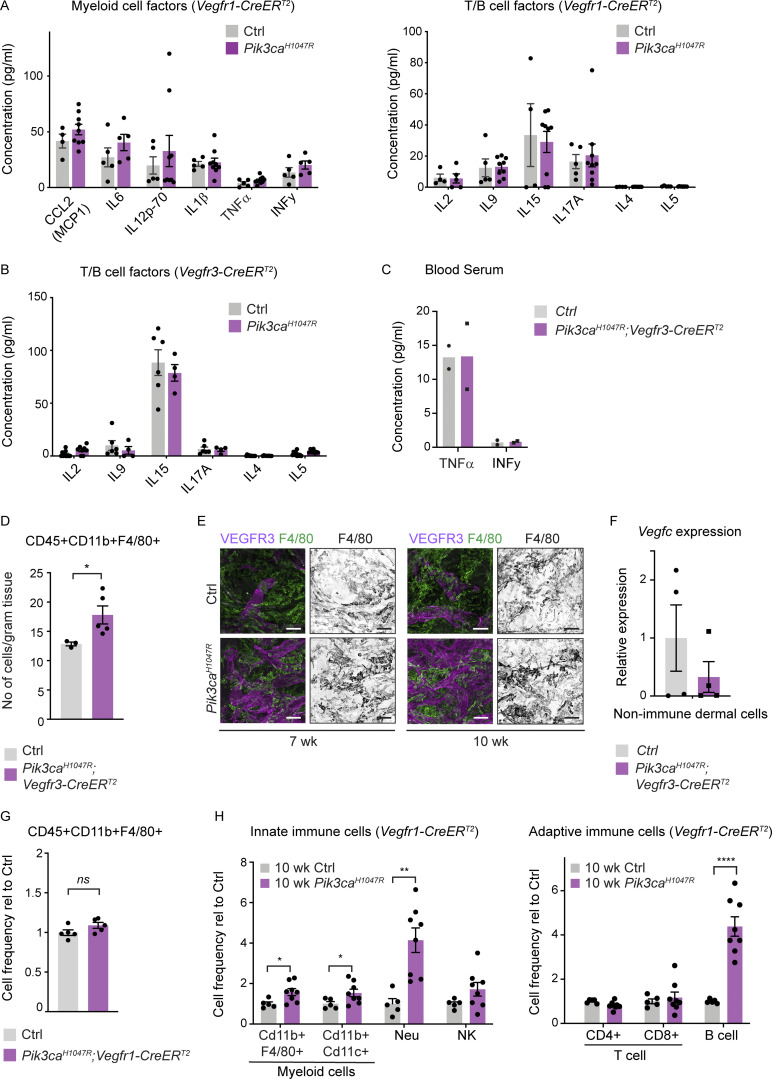
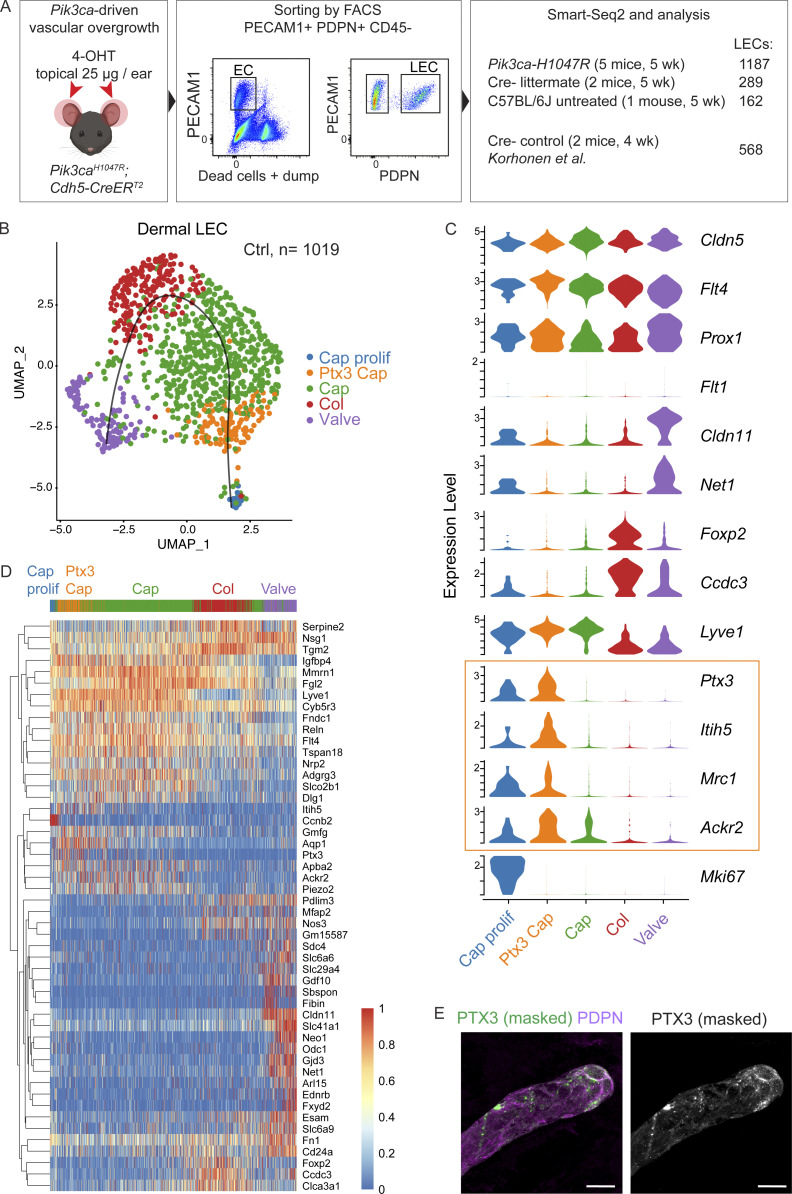
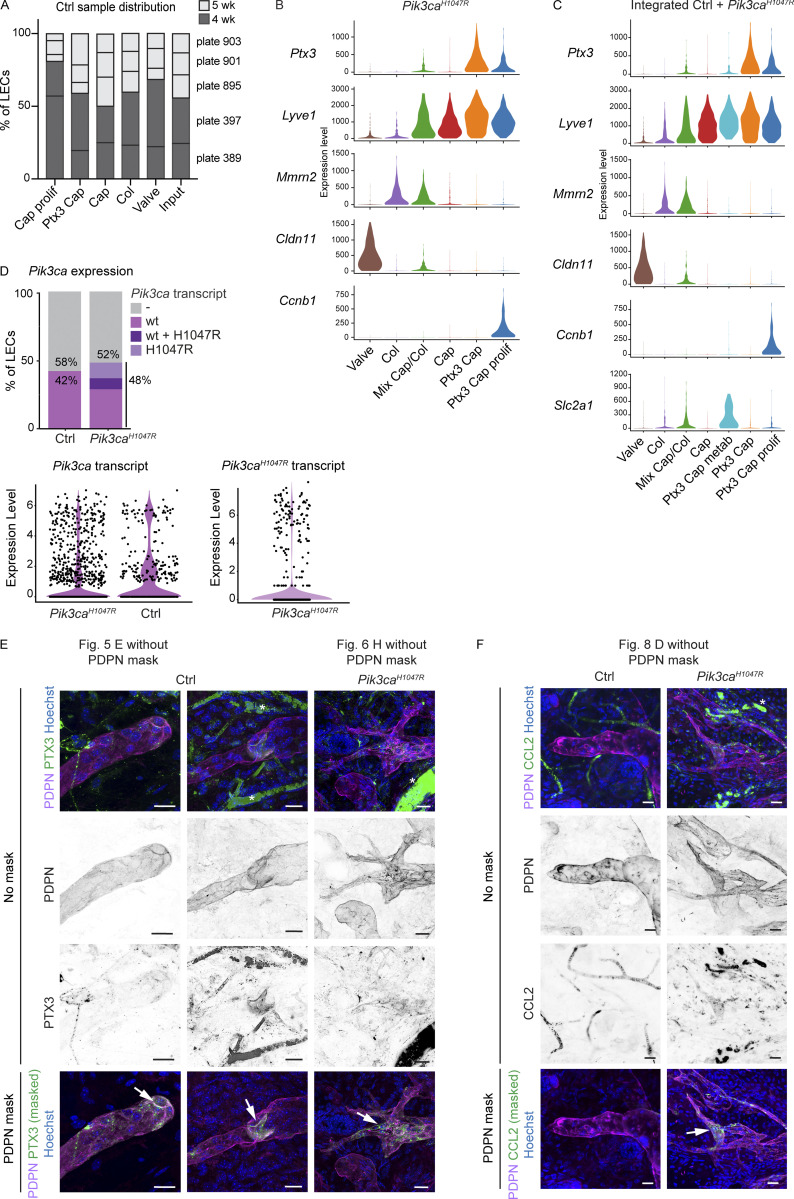
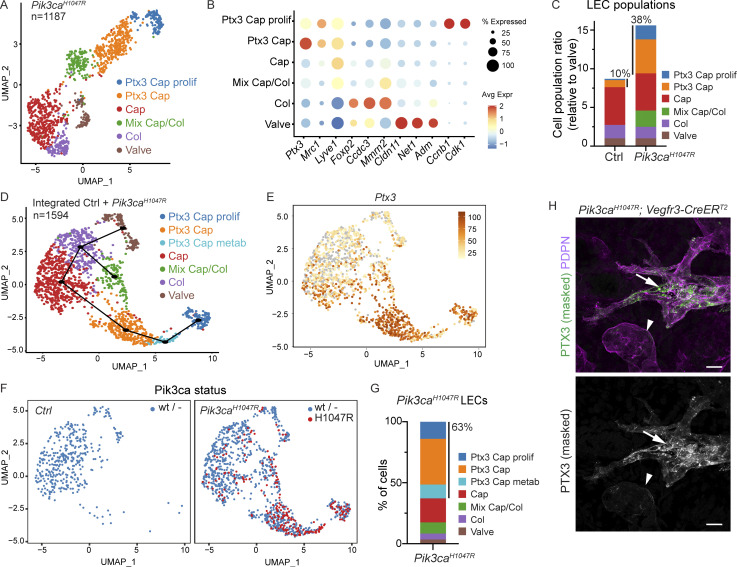
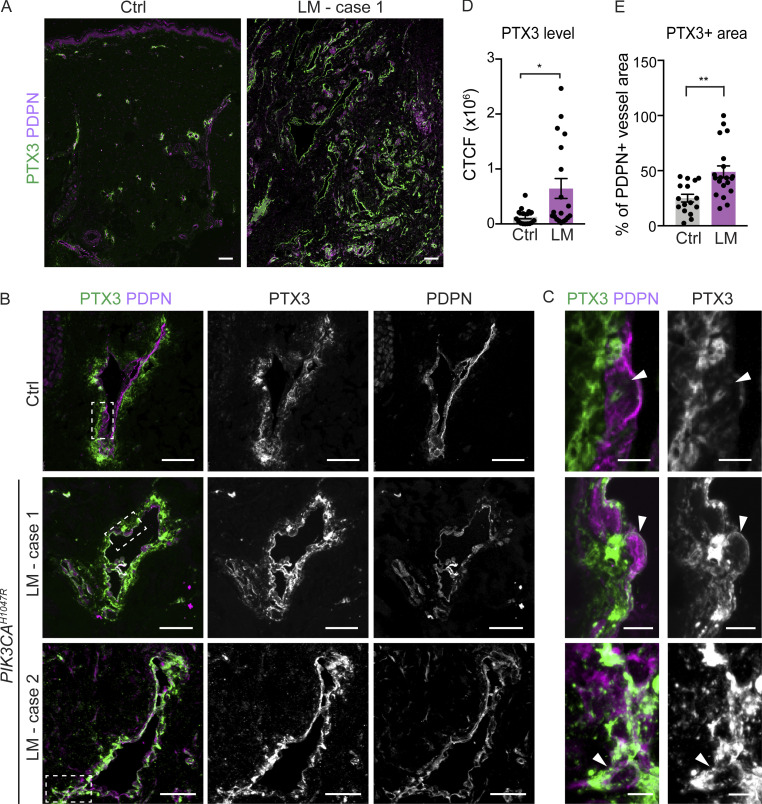
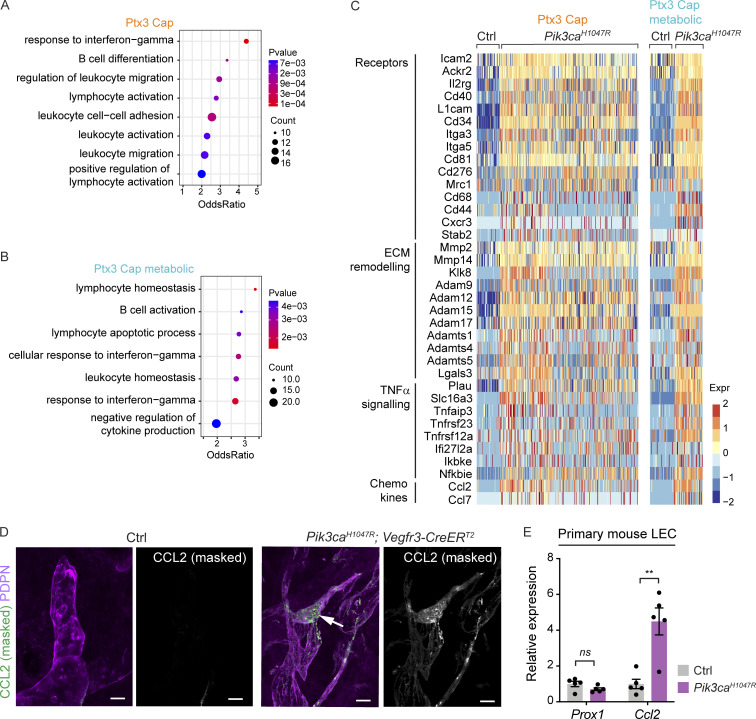
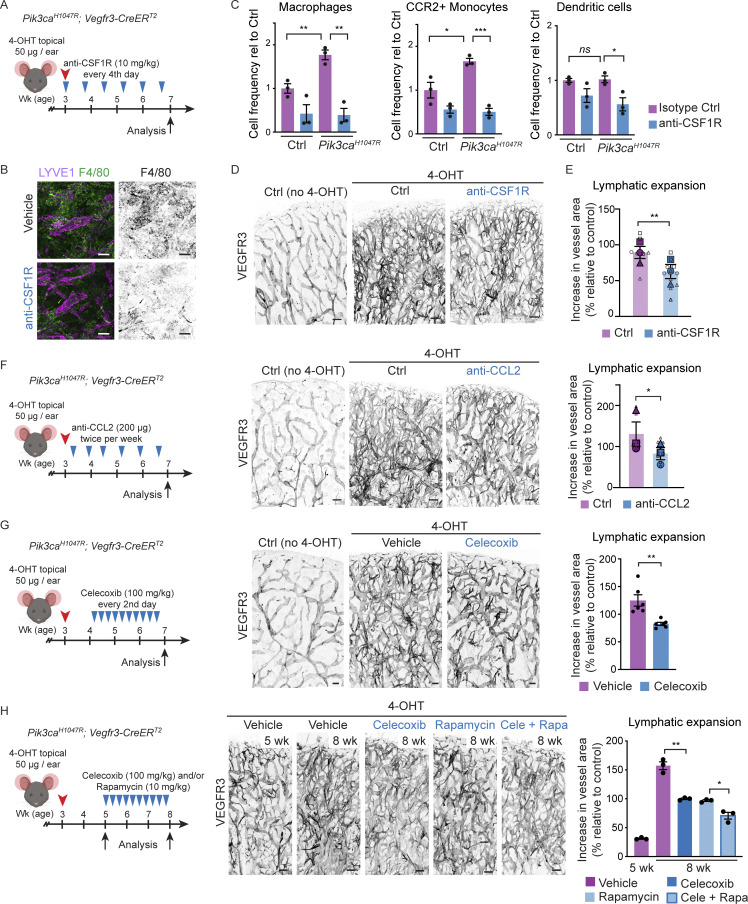
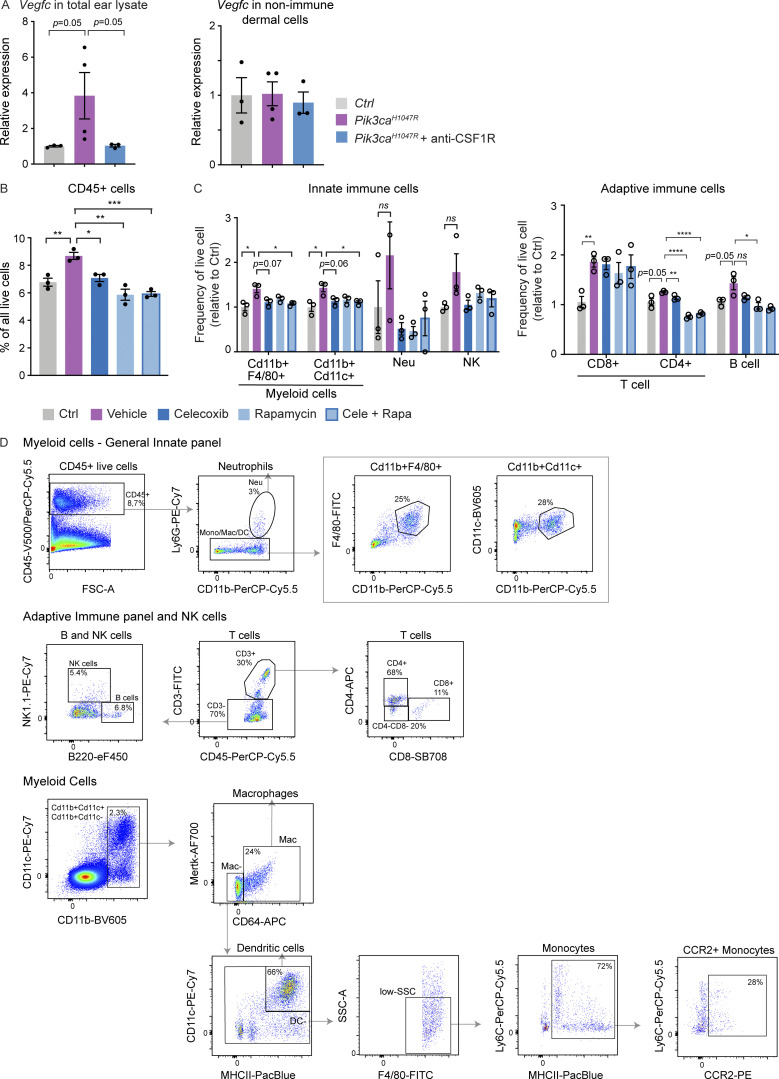
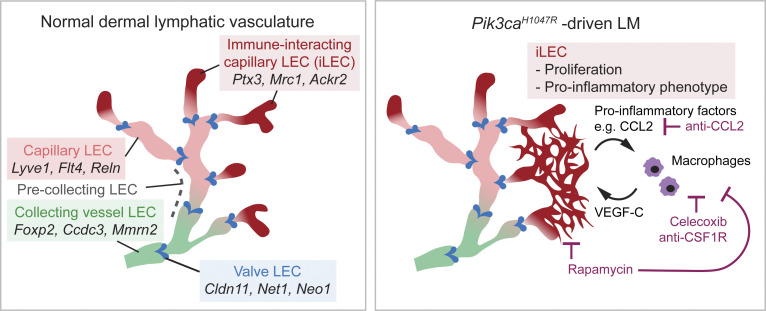
Oncogenic mutations in PIK3CA, encoding p110α-PI3K, are a common cause of venous and lymphatic malformations. Vessel type-specific disease pathogenesis is poorly understood, hampering development of efficient therapies. Here, we reveal a new immune-interacting subtype of Ptx3-positive dermal lymphatic capillary endothelial cells (iLECs) that recruit pro-lymphangiogenic macrophages to promote progressive lymphatic overgrowth. Mouse model of Pik3caH1047R-driven vascular malformations showed that proliferation was induced in both venous and lymphatic ECs but sustained selectively in LECs of advanced lesions. Single-cell transcriptomics identified the iLEC population, residing at lymphatic capillary terminals of normal vasculature, that was expanded in Pik3caH1047R mice. Expression of pro-inflammatory genes, including monocyte/macrophage chemokine Ccl2, in Pik3caH1047R-iLECs was associated with recruitment of VEGF-C-producing macrophages. Macrophage depletion, CCL2 blockade, or anti-inflammatory COX-2 inhibition limited Pik3caH1047R-driven lymphangiogenesis. Thus, targeting the paracrine crosstalk involving iLECs and macrophages provides a new therapeutic opportunity for lymphatic malformations. Identification of iLECs further indicates that peripheral lymphatic vessels not only respond to but also actively orchestrate inflammatory processes.


Conflict of interest statement

Disclosures: E. Baselga reported a patent for TOPIAL PIK3CA inhibitor issued. M. Graupera reported “other” from ArQule, Inc., a wholly owned subsidiary of Merck & Co., Inc and “other” from Venthera during the conduct of the study. No other disclosures were reported.

Figures

None
Graphical abstract
Figure 1.
Figure 1.
Vessel type–specific responses to activation of oncogenic Pik3ca signaling in the embryonic vasculature. (A) Genetic constructs and strategy for tamoxifen-inducible Pik3caH1047R expression in embryonic lymphatic (Vegfr3-CreERT2), lymphatic and blood (Cdh5-CreERT2), or specifically in blood (Vegfr1-CreERT2) endothelia. (B and C) E15 Pik3caH1047R;Vegfr3-CreERT2 (B), Pik3caH1047R;Cdh5-CreERT2 (C), and their littermate control (Ctrl) embryos treated with 4-OHT at E11. Whole-mount immunofluorescence of the back skin is shown below. Single channel images show hyperbranching of NRP2+ lymphatic vessels (red arrows) in both models, but presence of PECAM1+ blood vessel lesions (red arrowheads) only in the Cdh5-CreERT2 model. (D) Evacuation of blood upon application of pressure on a blood-filled lesion (arrowhead) in the skin of E15 Pik3caH1047R;Cdh5-CreERT2 embryo. (E) E15 Pik3caH1047R;Vegfr1-CreERT2 embryos treated with 4-OHT at E10, and whole-mount immunofluorescence of the back skin showing EMCN+ lesions (red arrowheads) in the blood vessels and normal lymphatic vasculature. (F) Whole-mount immunofluorescence of E17 skin from Pik3caH1047R;Cdh5-CreERT2 and littermate control (Ctrl) embryos treated with 4-OHT at E14. Note that lesions are present in the EMCN+ veins (arrow) and capillaries (arrowheads) but not in the αSMA+ arteries. Scale bar: 1 mm (B, C, and E, top panels) 200 µm (B–F).
Figure S1.
Figure S1.
Generation and characterization of BAC transgenic Vegfr1-CreERT2 mice. (A) Schematic of the genomic locus, a BAC for the Flt1 (Vegfr1) gene, and the engineered BAC used for generation of transgenic mice where exon 1 of Vegfr1 is replaced with the open reading frame for CreERT2, the Vegfr1 3′ UTR and hGH polyadenylation signal. In addition to the Vegfr1 gene, the engineered BAC also carries the Gm35592 ncRNA (non-coding RNA; NCBI gene ID: 102639236), the Gm35541 ncRNA (NCBI gene ID: 102639166), the Gm43156 long intergenic ncRNA (Ensembl gene ID: ENSMUSG00000106845) and the Gm35383 ncRNA (NCBI gene ID: 102638948). The locations of the genotyping primers are indicated (red arrows). Asterisk indicates stop codon. (B) Whole-mount immunofluorescence of the skin of E15 R26-tdTom;Vegfr1-CreERT2 embryo showing tdTom expression (Cre-mediated recombination) specifically in the PECAM1+LYVE1 blood vessels. Boxed area is magnified on the right. 4-OHT was administered at E10. (C) Whole mount immunofluorescence of 4-wk-old R26-mTmG;Vegfr1-CreERT2 ear skin showing GFP expression (Cre-mediated recombination) specifically in the LYVE1 blood vessels. Single channel images are shown for the boxed area. (D–F) Flow cytometry analysis of dermal ECs from R26-mTmG;Vegfr1-CreERT2 ear (D and E) showing efficient recombination (GFP expression) specifically in the BECs. Data in F represent mean (n = 5 mice) ± SD. In C–F, mice received five consecutive administrations of 1 mg of tamoxifen at 3 wk of age and were analyzed at 4 wk of age. Percentages of gated cells in the gating scheme: 2.4% ECs, from which 70.8% BECs and 27.9% LECs in D; 91.7% GFP+ LECs and 99.8% GFP BECs in E. (G and H) Cre recombination efficiency, visualized by GFP expression, in a whole-mount ear skin and the internal organs of R26-mTmG;Vegfr3-CreERT2 (G) and R26-mTmG;Vegfr1-CreERT2 (H) mice after topical application of 4-OHT to the ears. Systemic recombination was observed at a low efficiency in the intestine and diaphragm. Scale bars: 250 µm (B), 200 µm (C), 400 µm (G and H).
Figure 2.
Figure 2.
Distinct EC-autonomous responses to oncogenic Pik3ca in lymphatic and blood vessels. (A) Experimental scheme for postnatal induction of Pik3caH1047R -driven vascular overgrowth in the dermal vasculature. (B and C) Whole-mount staining of ears from 4-OHT–treated Vegfr3-CreERT2 and Vegfr1-CreERT2 mice in combination with the R26-mTmG reporter (B), or the Pik3caH1047R transgene (C), analyzed at the indicated stages after induction. Note efficient and EC type–specific recombination (GFP expression), and progressive Pik3caH1047R-driven vascular overgrowth in both models. (D and E) Whole-mount immunofluorescence of the ear skin showing the formation of vessel sprouts (arrow) and hyperbranched lymphatic vessel network in the Pik3caH1047R;Vegfr3-CreERT2 mice (D), as opposed to vessel dilations without sprouts (arrowheads) in veins (upper panels) and venules (lower panels) of Pik3caH1047R;Vegfr1-CreERT2 mice (E). Note ectopic coverage by αSMA+ SMCs of the small lesions. Scale bar: 200 µm (B and C), 100 µm (D and E).
Figure S2.
Figure S2.
Characterisation of a model of progressive vascular overgrowth in the Pik3caH1047R; Vegfr3-CreERT2 and Pik3caH1047R; Vegfr1-CreERT2 mice. (A and B) Ear tile scans of the chosen time points from time-course analysis showing vascular overgrowth phenotype in Pik3caH1047R;Vegfr3-CreERT2 (A) and Pik3caH1047R;Vegfr1-CreERT2 (B) mice. Whole-mount immunofluorescence of LECs (VEGFR3) or (venous) BECs (EMCN) in the ear skin reveals distinct responses in lymphatic (sprouting) and blood vessels (dilation). (C) Schematic representation of the key features of the Pik3ca-driven overgrowth in lymphatic and blood vessels. (D) Flow cytometry analysis of proliferating dermal LECs and BECs in Pik3caH1047R;Cdh5-CreERT2 and littermate control mice 1 or 2 wk after 4-OHT treatment (corresponding 4 or 5 wk of age respectively). Data represent mean % of Ki67+ ECs, normalized to the control (n = 4–8 mice) ± SEM. (E) qRT-PCR analysis of Mki67 in dermal LECs and BECs, FACS-sorted from the ear skin of 4-OHT–treated 5-wk-old Pik3caH1047R;Cdh5-CreERT2 and littermate control mice. Data represent mean relative expression (normalized to Hprt; n = 3–4 mice) ± SEM. Transcript levels are presented relative to control BECs and LECs. (F) The original unmasked images for Fig. 3 A, showing whole-mount immunofluorescence of ear skin analyzed at different stages after 4-OHT administration in Pik3caH1047R;Vegfr3-CreERT2 mice. EdU was administered 16 h prior to analysis. P value obtained using unpaired two-tailed Student’s t test (D); or Mann-Whitney U test for BEC and two-tailed Student’s t test with Welch’s correction for LEC (E). ****, P < 0.0001; **, P < 0.01; ns, P >0.05. Scale bars: 200 μm (A and B), 50 μm (F).
Figure 3.
Figure 3.
Different proliferation dynamics of LECs and BECs during Pik3ca-driven vascular overgrowth. (A–D) Whole-mount immunofluorescence of ear skin analyzed at different stages after 4-OHT administration, and quantification of S-phase cells (EdU+) and all cycling cells (Ki67+; arrowheads) in Pik3caH1047R;Vegfr3-CreERT2 (A and B) and Pik3caH1047R;Vegfr1-CreERT2 (C and D) mice. EdU was administered 16 h prior to analysis. LYVE1 and PROX1 were used for the identification of LECs, and EMCN for the identification of (venous) BECs. IMARIS surface mask based on LYVE1 expression was used to extract LEC-specific Ki67/EdU signals. The original unmasked images are shown in Fig. S2 F. Note initial proliferative response in both models, but sustained proliferation only in the LECs of Vegfr3-CreERT2 mice. (E) Flow cytometry analysis of proliferating dermal LECs and BECs in Pik3caH1047R;Vegfr3-CreERT2 and Pik3caH1047R;Vegfr1-CreERT2 mice, respectively, and their littermate controls at the indicated stages. Data represent mean % of Ki67+ ECs (n = 3–7 mice) ± SEM. (F) Proportion of LECs and BECs out of all ECs in the Pik3caH1047R;Vegfr3-CreERT2 and Pik3caH1047R;Vegfr1-CreERT2 animals analyzed in E. P value in B and D–F: two-tailed unpaired Student’s t test; ****, P < 0.0001; ***, P < 0.001; **, P < 0.01; ns, P > 0.05. Scale bar: 50 μm (A and C).
Figure 4.
Figure 4.
Increased inflammatory cell infiltration and pro-inflammatory cytokine levels in the Pik3ca-driven LM. (A–E) Quantification of the CD45+ area (A and B) and F4/80+ area (C–E) in the ear skin showing increase in Pik3caH1047R;Vegfr3-CreERT2 (A, C, and D) but not in Pik3caH1047R;Vegfr1-CreERT2 (B, C, and E) mice. Data represent mean (CD45: n = 4–6 images from n = 3–5 mice per genotype; F4/80: n = 3–7 images from n = 2–3 mice per genotype) ± SEM. Representative binary images are shown below the graphs. (F) Multiplex ELISA analysis of pro-inflammatory cytokines and chemokines associated with recruitment and/or activation of myeloid cells in whole-ear skin lysates from Pik3caH1047R;Vegfr3-CreERT2 mice and littermate controls. Data represent mean protein levels relative to control (n = 6–11 mice) ± SEM. (G) Flow cytometry analysis of innate and adaptive immune cells in the ear skin of 4-OHT–treated 5- and 10-wk-old Pik3caH1047R;Vegfr3-CreERT2 mice and littermate controls. Neu, neutrophil. Data represent cell frequency (of live cells) relative to the control (n = 3–9 mice) ± SEM. (H) Flow cytometry analysis of myeloid cells in the ear skin of 4-OHT–treated 5- and 7-wk-old Pik3caH1047R;Vegfr3-CreERT2 mice and littermate controls. Mac, macrophage (Cd11b+MerTK+CD64+); DC, dendritic cell (CD11c+MHCII+); Mono, monocyte (Cd11b+low-SSC F4/80+Ly-6C+MHCII+). Data represent cell frequency (of live cells) relative to the control (n = 4–7 mice) ± SEM. (I) qRT-PCR analysis of Vegfc in total myeloid population, and in Mac and DC from H. Data represent mean relative expression (normalized to Hprt; n = 3–5 mice) ± SEM, presented relative to myeloid cells in control mice. nd, not detected. P value in A, B, and D–I obtained using two-tailed unpaired Student’s t test; for Cd11b+F4/80+ cells in I, additional Welch’s correction was used; ****, P < 0.0001; ***, P < 0.001; **, P < 0.01; *, P < 0.05; ns, P > 0.05. Scale bar: 100 μm (A–E).
Figure S3.
Figure S3.
Analysis of inflammatory cells and markers in Pik3ca-driven vascular lesions. (A and B) Multiplex ELISA analysis of pro-inflammatory cytokines and chemokines associated with recruitment and/or activation of myeloid cells or T cells and B cells in whole-ear skin lysates from Pik3caH1047R;Vegfr1-CreERT2 (A) and Pik3caH1047R;Vegfr3-CreERT2 (B) mice, and respective littermate controls. (C) Similar analysis of TNFα and INFγ in blood serum of Pik3caH1047R;Vegfr3-CreERT2 mice. Data in A–C represent mean protein levels (n = 3–9 mice [A and B]) ± SEM, or n = 2 mice (C). (D) Flow cytometry analysis of the number of CD45+CD11b+F4/80+ macrophages in the ear skin of 4-OHT–treated 5-wk-old Pik3caH1047R;Vegfr3-CreERT2 (n = 5) and control (n = 3) mice. Data represent mean cell number per gram tissue ± SEM. P value, Mann–Whitney U test. (E) Whole-mount immunofluorescence of ears from a control (Ctrl) mouse, and 7- or 10-wk-old 4-OHT–treated Pik3caH1047R;Vegfr3-CreERT2 mice for myeloid marker F4/80. (F) qRT-PCR analysis of Vegfc in live non-immune dermal cell population (gated out all myeloid cells, neutrophils, NK cells, B cells, and T cells using panels shown in Fig. S5 D). Data represent mean relative expression (normalized to Hprt; n = 4 mice) ± SEM, presented relative to control mice. (G) Flow cytometry analysis of the frequency of CD45+CD11b+F4/80+ myeloid cells in the ear skin of 4-OHT–treated 5-wk-old Pik3caH1047R;Vegfr1-CreERT2 (n = 6) and control (n = 5) mice. Data represent relative cell frequency (of live cells) relative to the control ± SEM. P value obtained using two-tailed unpaired Student’s t test. (H) Flow cytometry analysis of innate (left) and adaptive (right) immune cells in the ear skin of 4-OHT–treated 10-wk-old Pik3caH1047R; Vegfr1-CreERT2 mice and littermate controls. Neu, neutrophil. Data represent relative cell frequency (of live cells) relative to the control (n = 5–8 mice for innate panel, n = 7–9 mice for adaptive panel) ± SEM. P value (in D and H) obtained using two-tailed unpaired Student’s t test. ****, P < 0.0001; **, P < 0.01; *, P < 0.05; ns, P > 0.05. Scale bar: 50 μm (E).
Figure 5.
Figure 5.
Definition of dermal LEC subtypes by single cell transcriptomics. (A) Schematic overview of dermal LEC isolation for scRNA-seq. (B) The five dermal LEC clusters from control ear skin visualized in a UMAP landscape, labeled by cluster assignment. Black line depicts trajectory calculated from UMAP embedding (unsupervised Slingshot algorithm). (C) Violin plots showing the expression of selected pan-EC, LEC, and BEC markers, as well as LEC subtype marker genes in the five clusters. Note a new LEC subtype (immune-interacting LECs, iLECs; yellow box) defined by the expression of Ptx3, Itih5, and Mrc1 that are also expressed in Ptx3-LECs in the lymph node. (D) Heatmap showing the expression of zonation markers across the five LEC clusters. Cells were ordered by the trajectory. Color indicates read counts in log-scale. (E) Whole-mount immunofluorescence of non-permeabilized ear skin showing extracellular PTX3 staining predominantly at capillary terminals. IMARIS surface mask based on podoplanin (PDPN) expression was used to extract LEC-specific PTX3 signal. The original unmasked image is shown in Fig. S4 E. Scale bar: 20 μm (H).
Figure S4.
Figure S4.
Characterization of cell clusters in scRNA-seq datasets of Pik3caH1047R mutant and control LECs. (A) Contribution of cells from different control mice (plates) in the five clusters of normal LECs. Input levels of each plate are shown, and color code indicates mouse age. (B and C) Violin plots showing the expression of selected LEC and LEC subtype marker genes in LEC clusters from the Pik3caH1047R mutant dataset (from Fig. 6 A; B) and integrated dataset containing LECs from control and Pik3caH1047R;Cdh5-CreERT2 mice (from Fig. 6 D; C). (D) Proportion of LECs from control and Pik3caH1047R;Cdh5-CreERT2 mice expressing the endogenous mouse Pik3ca transcript (control and mutant mice), and/or the transgenic Pik3caH1047R transcript (mutant mice only). Violin plots below show the expression levels. Note that the majority of LECs lack the Pik3ca transcript. (E and F) Whole-mount immunofluorescence of control and Pik3caH1047R;Vegfr3-CreERT2 ear skin showing high expression of PTX3 (E) and CCL2 (F) in the capillary terminals (Ctrl) and abnormal lymphatic sprouts (mutant; arrows). PTX3 staining is also observed in lymphatic valves (arrow). IMARIS surface mask based on PDPN expression was used to extract LEC-specific signals (images below, shown in the main figures). The original images including single channels for PDPN and PTX3 (E) or CCL2 (F) are shown (no mask). Unspecific signal from red blood cells is indicated by asterisks. Scale bars: 20 µm (E and F).
Figure 6.
Figure 6.
Expansion of Ptx3+ iLEC population in Pik3ca-driven LM. (A) The six dermal LEC clusters from Pik3caH1047R;Cdh5-CreERT2 ear skin visualized in a UMAP landscape. (B) Dot plot of LEC subtype markers for the six LEC clusters from A. Dot size illustrates percentage of cells presenting transcript sequence counts and color illustrates the average expression level (log2 fold change) within a cluster. (C) Subtype composition of LEC populations in the control and Pik3caH1047R mutant skin. Population sizes are shown relative to valve LECs (= 1). The percentage of Ptx3+ capillary LEC population of the total LEC population is indicated. (D) The seven dermal LEC clusters from the dataset integrating data from control and Pik3caH1047R;Cdh5-CreERT2 ear skin visualized in a UMAP landscape. Black line depicts trajectories calculated from UMAP embedding of the combined dataset (unsupervised Slingshot algorithm), resulting in two branches. (E) Ptx3 expression visualized in a UMAP. (F) Cell distribution based on genotype and Pik3ca transcript status visualized in a UMAP, as indicated. Ptx3+ capillary LEC clusters from Pik3caH1047R mutant mice are enriched with cells expressing the mutant transcript (red). (G) Distribution of LECs expressing the mutant Pik3caH1047R transcript showing the majority (63%) within the three Ptx3high clusters. (H) Whole-mount immunofluorescence of Pik3caH1047R;Vegfr3-CreERT2 ear skin showing high expression of PTX3 in the abnormal lymphatic sprouts (arrows) compared to morphologically normal lymphatic capillaries (arrowheads). IMARIS surface mask based on PDPN expression was used to extract LEC-specific signals. The original unmasked images are shown in Fig. S4 E. Scale bars: 20 μm (H).
Figure 7.
Figure 7.
Increased PTX3 deposition and expression in human PIK3CAH1047R -driven LM. (A–C) Immunofluorescence staining of PTX3 in paraffin sections of normal skin and LMs with a PIK3CAH1047R mutation. Boxed areas in B are magnified in C. Note deposition of PTX3 around PDPN+ lymphatic vessels in control tissue but low expression in LECs, while LECs from LM tissue show PTX3 immunoreactivity (arrowheads in C). (D and E) Quantification of PTX3 immunoreactivity in PDPN+ lymphatic vessels showing higher intensity, measured as corrected total cell fluorescence (CTCF; D), and larger PTX3+ vessel area (E) in LECs from LM in comparison with control tissue. P value in D and E: two-tailed unpaired Student’s t test; **, P < 0.01; *, P < 0.05. Scale bars: 100 μm (A), 50 μm (B), 5 μm (C).
Figure 8.
Figure 8.
Pro-inflammatory transcriptome of Pik3caH1047R -expressing iLECs. (A and B) GO analysis of genes enriched in the clusters of non-proliferative Ptx3+ capillary LECs from Pik3caH1047R in comparison with Ptx3+ capillary LECs in control mice. Selected terms for enriched immune-related biological process are shown. Dot size illustrates count number and color illustrates adjusted P value. (C) Heatmap showing the expression of upregulated immune-related genes in Ptx3+ capillary LECs from Pik3caH1047R mutant in comparison with control mice. Color illustrates the expression level (log2 fold change). (D) Whole-mount immunofluorescence of Pik3caH1047R;Vegfr3-CreERT2 ear skin showing lymphatic endothelial expression of CCL2/MCP1 in the mutant. (E) qRT-PCR analysis of primary dermal LECs isolated from Pik3caH1047R;Vegfr3-CreERT2 ears, showing increased Ccl2 expression in Pik3caH1047R-expressing (with 4-OHT) in comparison with control (without 4-OHT) LECs. Prox1 levels were unchanged. Data represent mean relative expression (normalized to Hprt; n = 5 samples) ± SEM, presented relative to control cells. P value obtained using hypergeometric test (A and B) and two-tailed unpaired Student’s t test (E). **, P < 0.01; ns, P > 0.05. Scale bars: 20 μm (D).
Figure 9.
Figure 9.
Anti-inflammatory treatment limits Pik3caH1047R-driven lymphangiogenesis. (A) Experimental scheme for depletion of monocyte/macrophage populations using anti-CSF1R antibody in the mouse model of Pik3caH1047R-driven LM. (B) Whole-mount immunofluorescence of ears from a control (Ctrl) mouse, and 7-wk-old 4-OHT–treated Pik3caH1047R;Vegfr3-CreERT2 mice following a 4-wk treatment with anti-CSF1R or vehicle, stained for myeloid marker F4/80. (C) Flow cytometry analysis of different myeloid cell populations in the ear skin of Pik3caH1047R mutants and littermate controls. Data represent cell frequency (of live cells) relative to isotype IgG-treated controls (n = 3 mice) ± SEM. (D) Whole-mount immunofluorescence of ears from A and B. (E) Quantification of lymphatic vessel area, shown as % increase in vessel area in comparison with untreated (no 4-OHT) control. Data from n = 8 (Ctrl) or 12 (anti-CSF1R) mice in three independent experiments (indicated by symbols) are represented in SuperPlot (mean ± SEM). (F and G) Left: Experimental scheme for anti-CCL2 (F) or celecoxib (G) treatment of Pik3caH1047R -driven LM. Middle: Whole-mount immunofluorescence of ears from a control (Ctrl) mouse, and 7-wk-old 4-OHT–treated Pik3caH1047R;Vegfr3-CreERT2 mice following a 4-wk (F) or 2-wk (G) treatment period. Right: Quantification of lymphatic vessel area, shown as % increase in vessel area in comparison with control. Data in F from n = 8 (Ctrl) or 9 (anti-CCL2) mice in three independent experiments (indicated by symbols) are represented in SuperPlot (mean ± SEM). Data in G represent mean (n = 6 mice) ± SEM. (H) Left: Experimental scheme for extended celecoxib treatment of established Pik3caH1047R-driven LM. Middle: Whole-mount immunofluorescence of ears from 4-OHT–treated Pik3caH1047R;Vegfr3-CreERT2 mice at the start of the treatment period (5 wk), and following a 3-wk treatment with celecoxib and/or rapamycin, or vehicle (8 wk). Right: Quantification of lymphatic vessel area, shown as % increase in vessel area in comparison with the control. Data represent mean (n = 3 mice) ± SEM. P value in C and E–H: two-tailed unpaired Student’s t test; ***, P < 0.001; **, P < 0.01; *, P < 0.05; ns, P > 0.05. Scale bars: 100 μm (B, D, and F–H).
Figure S5.
Figure S5.
Anti-inflammatory treatment in Pik3caH1047R-driven LM. (A) qRT-PCR analysis of Vegfc in total ear skin lysate (on the left) and live non-immune dermal cell population (on the right; gated out all myeloid cells, neutrophils, NK cells, B cells, and T cells using panels shown in Fig. S5 D) from Pik3caH1047R; Vegfr3-CreERT2 mice following treatment with anti-CSF1R or isotype control as in Fig. 9 A. Data represent mean relative expression (normalized to Hprt; n = 3–4 mice) ± SEM, presented relative to control mice. (B and C) Flow cytometry analysis of CD45+ cells (B), and subpopulations of innate and adaptive immune cells (C) in the ear skin of 4-OHT–treated 8-wk-old Pik3caH1047R; Vegfr3-CreERT2 mice and littermate controls following treatment as in Fig. 9 H. Neu, neutrophil. Data represent relative cell frequency (of live cells) relative to the control (n = 3 mice) ± SEM. P value obtained with Mann–Whitney U test (A) or two-tailed unpaired Student’s t test (B and C). ****, P < 0.0001; ***, P < 0.001; **, P < 0.01; *, P < 0.05; ns, P > 0.05. Value P = 0.05 indicated on the graph. (D) Gating scheme for flow cytometry analysis of dermal immune cells. Percentage of gated cells in the gating scheme of General Innate panel: 8.7% of CD45+ live cells, of which 3% are neutrophils. The rest of the immune population (97%) is gated as 25% of Cd11b+F4/80+ and 28% of Cd11b+Cd11c+ myeloid cells. Percentage of gated cells in Adaptive Immune panel and NK cells: after gating the CD45+ live cells, similar to the General Innate panel, 30% of the cells are gated as CD3+ T cells and 70% as CD3. Of the latter, 5.4% are gated as NK cells and 6.8% as B cells. The CD3+ T cells are additionally gated as 68% CD4+, 11% CD8+ and ∼20% double negative cells. Percentage of gated cells in myeloid cells panel: 2.3% CD11b+CD11c and CD11b+CD11c+ cells, of which 24% are gated as macrophages (Mac). 66% of non-Mac cells are dendritic cells (DC+). Non-DC low-SSC F4/80+ cells were further gated as 72% monocytes, of which 28% are CCR2+. The percentages in the shown example scheme vary depending on the age of the mouse and treatment.
Figure 10.
Figure 10.
Proposed model of paracrine LEC-immune cell interactions as a driver of LMs. Schematic illustration showing distinct dermal LEC subtypes within lymphatic vessel hierarchy (on the left), and pathological changes driven by oncogenic Pik3caH1047R (on the right). Pik3caH1047R drives expansion and activation of a pro-inflammatory transcriptome in iLECs to induce recruitment and activation of myeloid cells that in turn promote pathological lymphangiogenesis by secretion of pro-lymphangiogenic factors. Celecoxib and anti-CSF1R or anti-CCL2 therapy inhibit lymphangiogenesis by reducing myeloid cell numbers.

References

    1. Alishekevitz, D., Gingis-Velitski S., Kaidar-Person O., Gutter-Kapon L., Scherer S.D., Raviv Z., Merquiol E., Ben-Nun Y., Miller V., Rachman-Tzemah C., et al. . 2016. Macrophage-induced lymphangiogenesis and metastasis following paclitaxel chemotherapy is regulated by VEGFR3. Cell Rep. 17:1344–1356. 10.1016/j.celrep.2016.09.083 - DOI - PMC - PubMed
    1. Angulo-Urarte, A., and Graupera M.. 2022. When, where and which PIK3CA mutations are pathogenic in congenital disorders. Nat. Cardiovasc. Res. 1:700–714. 10.1038/s44161-022-00107-8 - DOI - PubMed
    1. Bader, A.G., Kang S., and Vogt P.K.. 2006. Cancer-specific mutations in PIK3CA are oncogenic in vivo. Proc. Natl. Acad. Sci. USA. 103:1475–1479. 10.1073/pnas.0510857103 - DOI - PMC - PubMed
    1. Baluk, P., Yao L.-C., Flores J.C., Choi D., Hong Y.-K., and McDonald D.M.. 2017. Rapamycin reversal of VEGF-C-driven lymphatic anomalies in the respiratory tract. JCI Insight. 2:90103. 10.1172/jci.insight.90103 - DOI - PMC - PubMed
    1. di Blasio, L., Puliafito A., Gagliardi P.A., Comunanza V., Somale D., Chiaverina G., Bussolino F., and Primo L.. 2018. PI3K/mTOR inhibition promotes the regression of experimental vascular malformations driven by PIK3CA-activating mutations. Cell Death Dis. 9:45. 10.1038/s41419-017-0064-x - DOI - PMC - PubMed

Publication types