. 2023 Apr 3;220(4):e20220686.
doi: 10.1084/jem.20220686. Epub 2023 Jan 23.

STAT3 regulates CD8+ T cell differentiation and functions in cancer and acute infection

Affiliations

STAT3 regulates CD8+ T cell differentiation and functions in cancer and acute infection

Qinli Sun et al. J Exp Med. .

Abstract

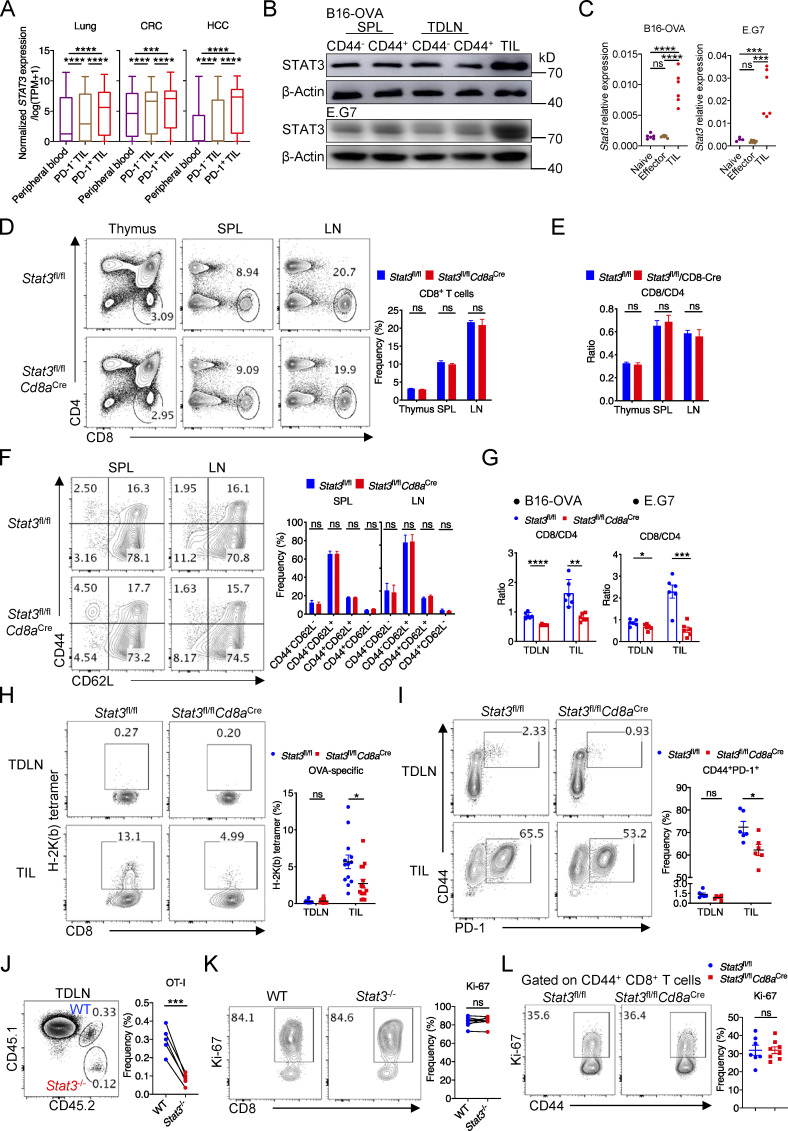
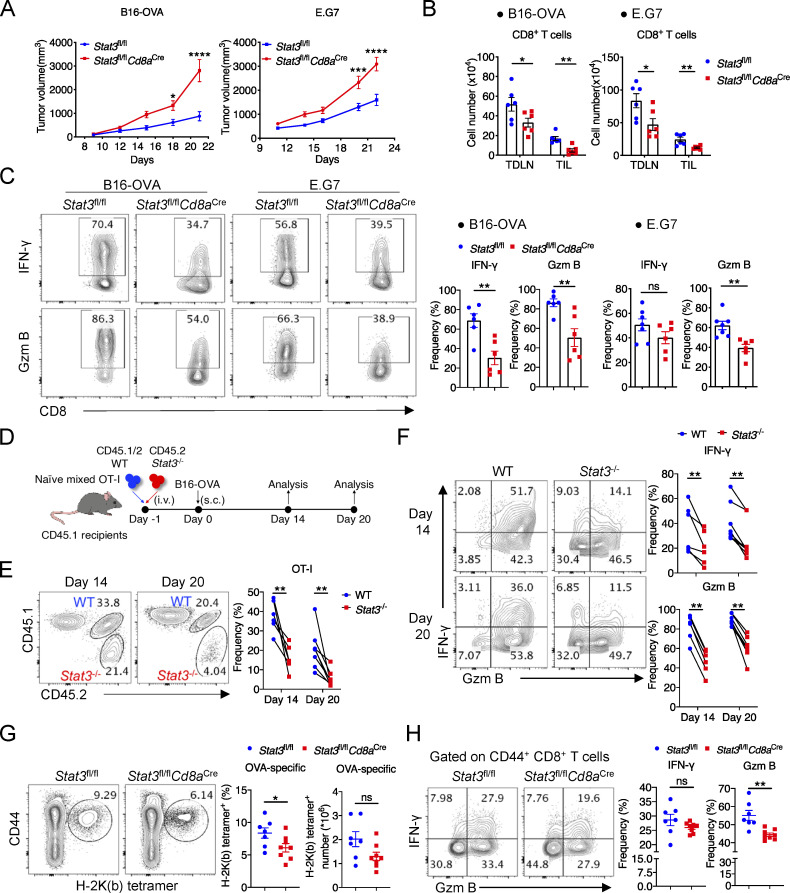
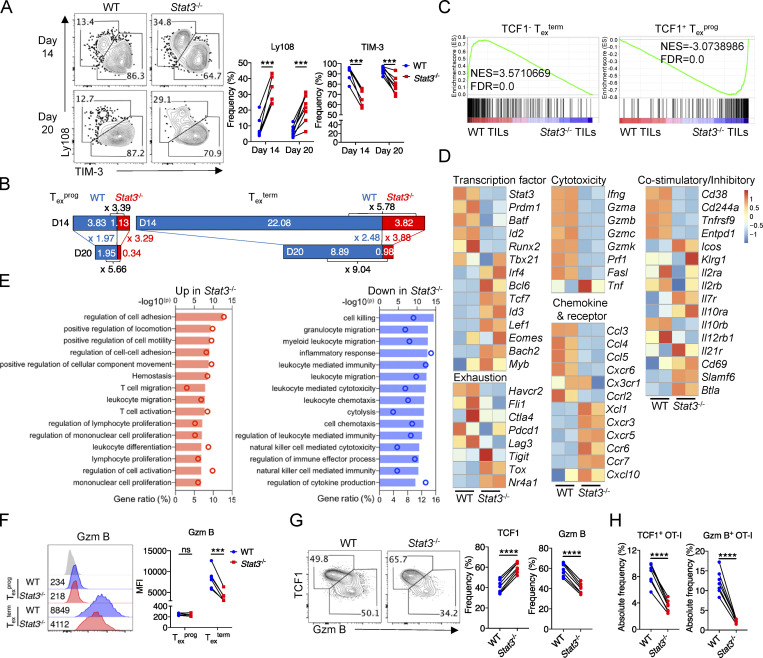
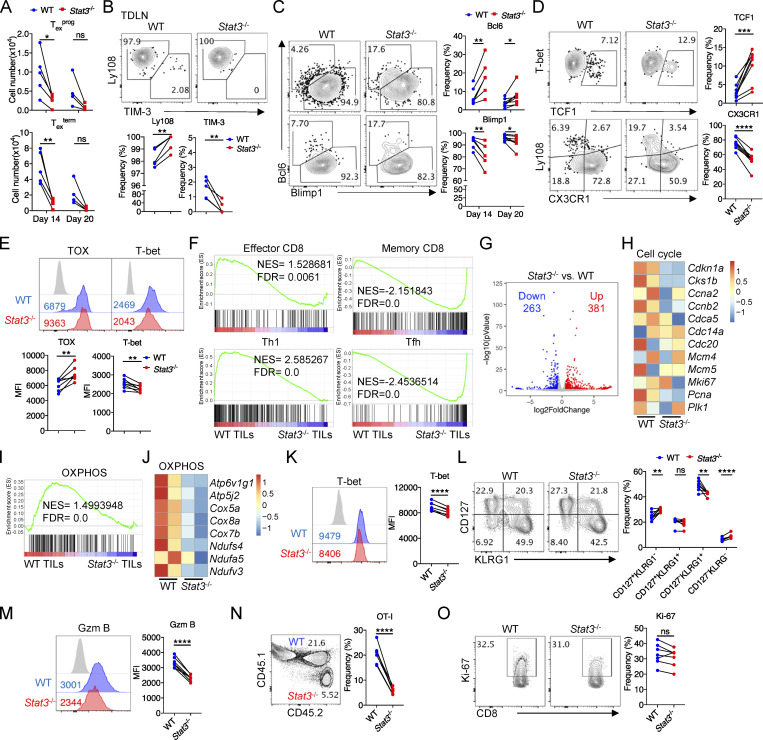
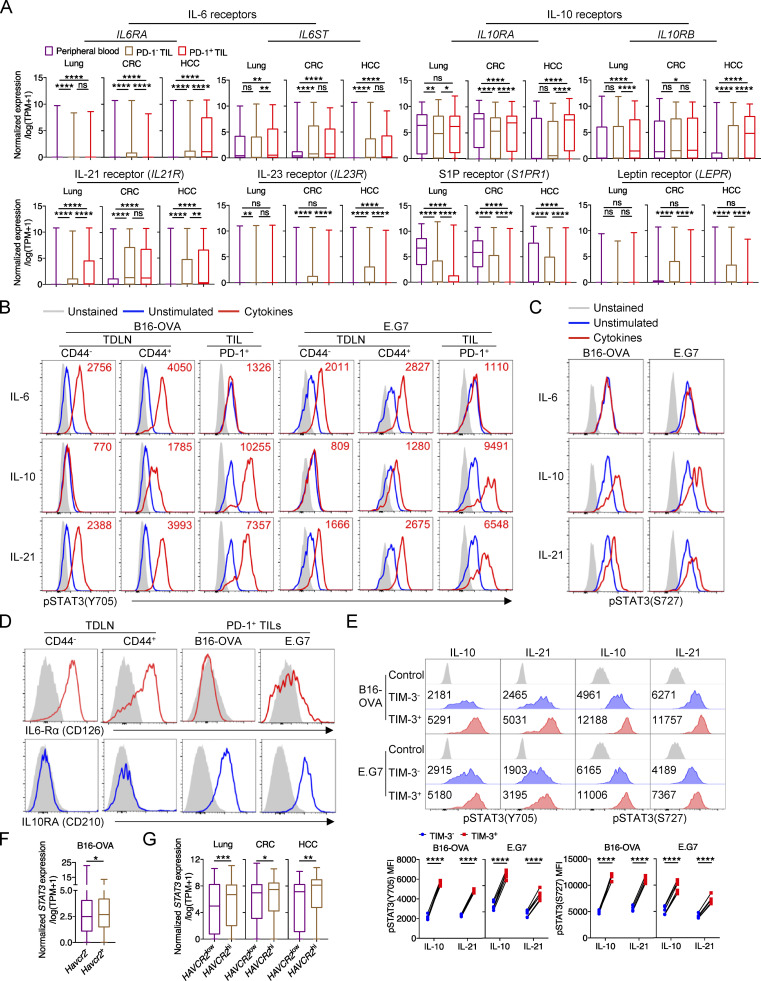
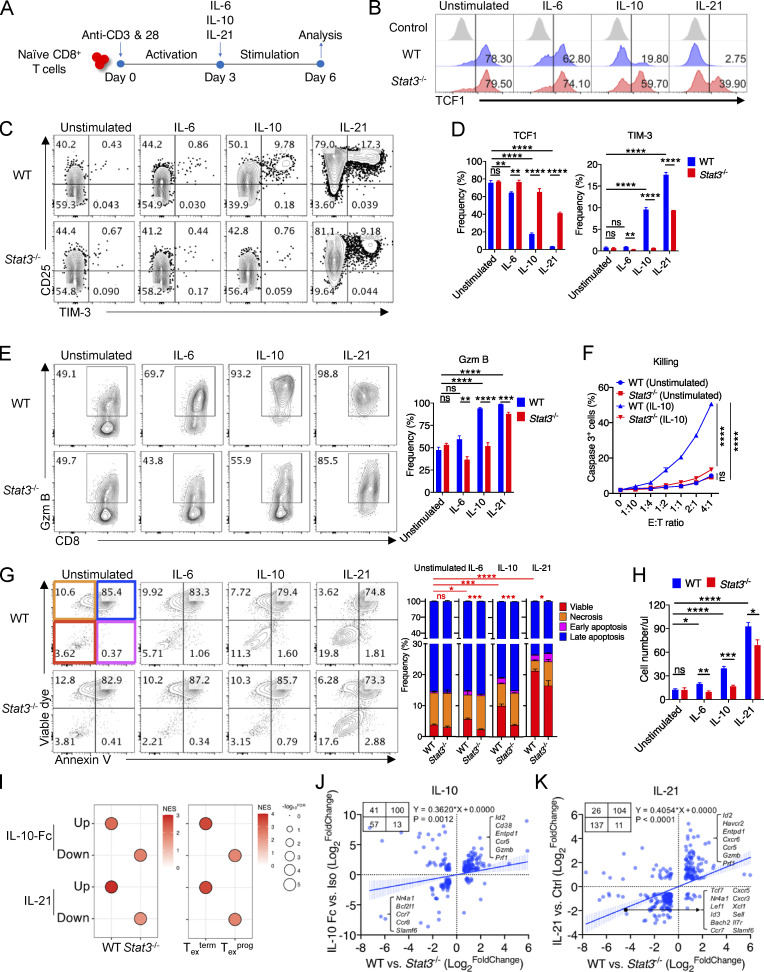
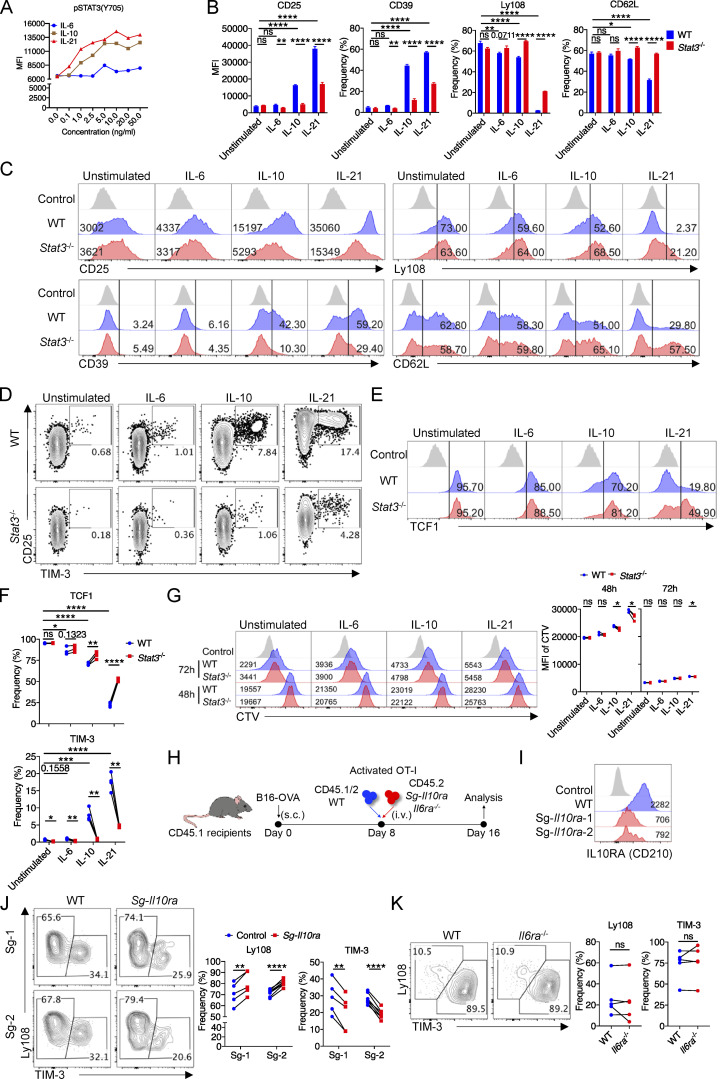
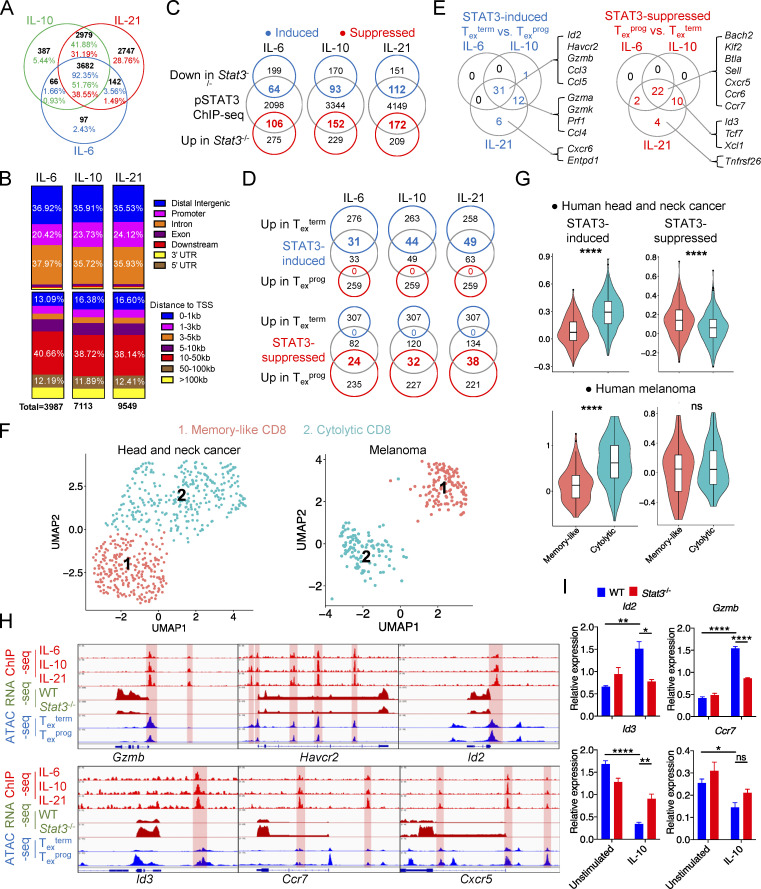
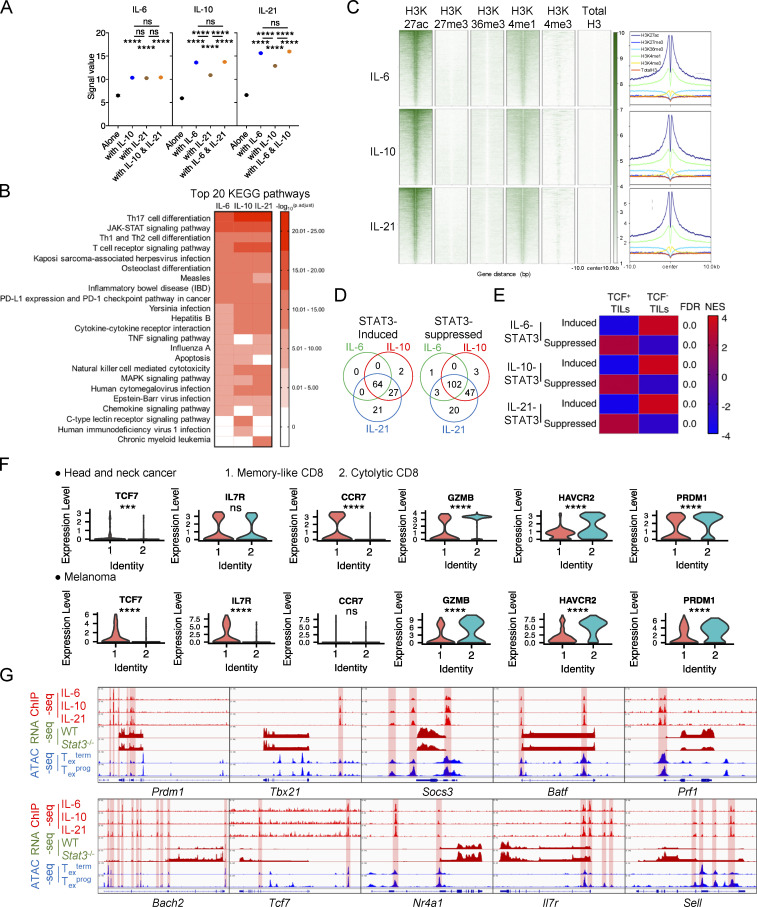
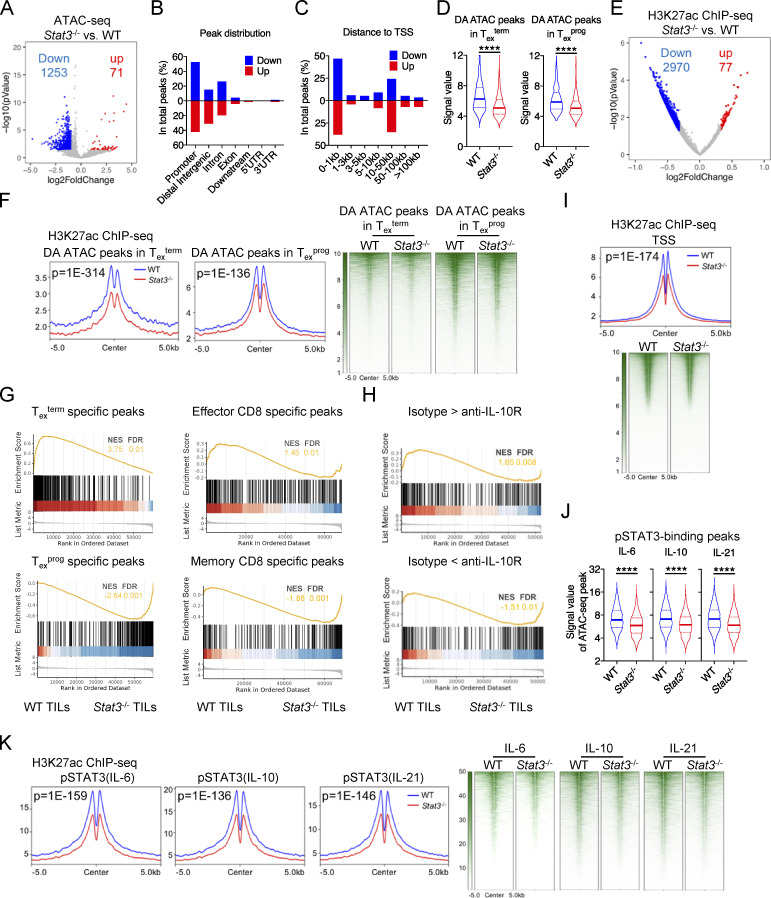
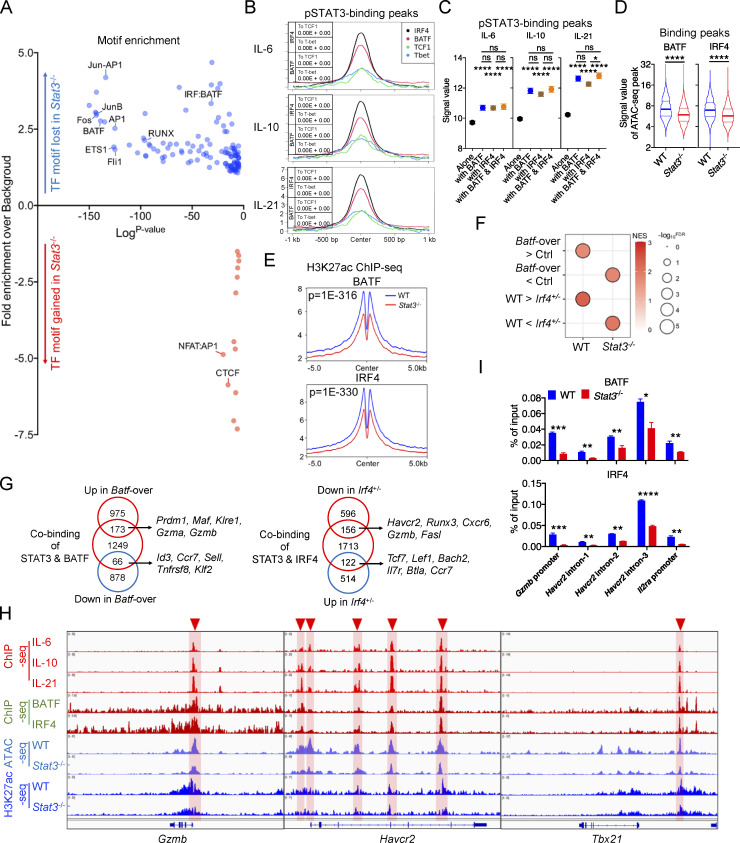
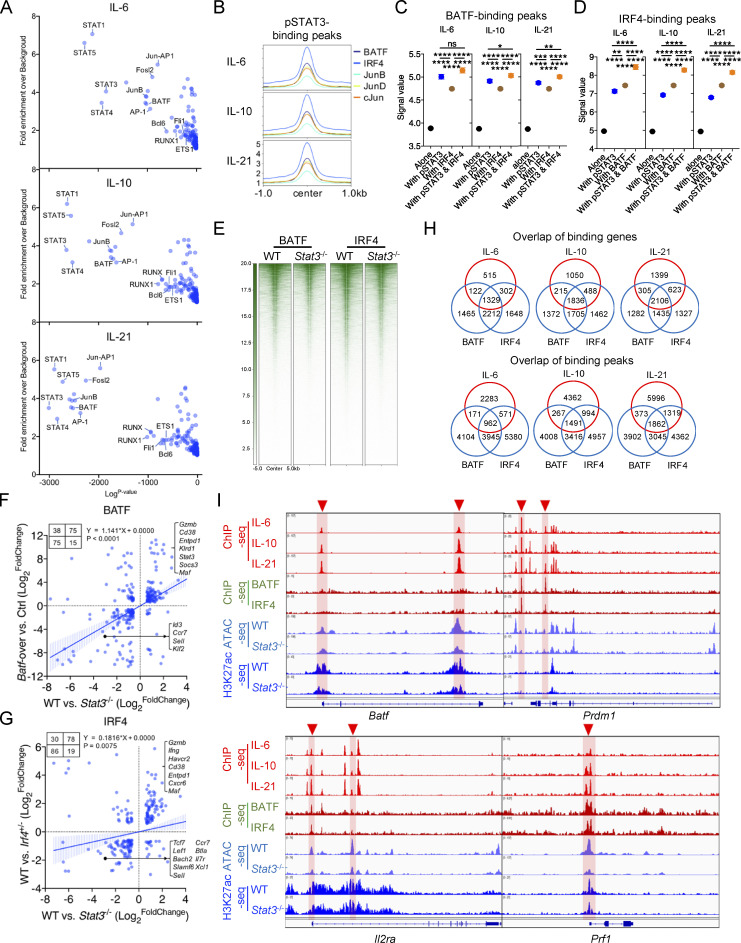
In cancer, persistent antigens drive CD8+ T cell differentiation into exhausted progenitor (Texprog) and terminally exhausted (Texterm) cells. However, how the extrinsic and intrinsic regulatory mechanisms cooperate during this process still remains not well understood. Here, we found that STAT3 signaling plays essential roles in promoting intratumor Texterm cell development by enhancing their effector functions and survival, which results in better tumor control. In tumor microenvironments, STAT3 is predominantly activated by IL-10 and IL-21, but not IL-6. Besides, STAT3 also plays critical roles in the development and function of terminally differentiated effector CD8+ T cells in acute infection. Mechanistically, STAT3 transcriptionally promotes the expression of effector function-related genes, while it suppresses those expressed by the progenitor Tex subset. Moreover, STAT3 functions in collaboration with BATF and IRF4 to mediate chromatin activation at the effector gene loci. Thus, we have elucidated the roles of STAT3 signaling in terminally differentiated CD8+ T cell development, especially in cancer, which benefits the development of more effective immunotherapies against tumors.


Conflict of interest statement

Disclosures: The authors declare no competing interests exist.

Figures

Figure S1.
Figure S1.
STAT3 is intrinsically critical for the effector function of CD8+ T cells. (A) mRNA level of STAT3 in CD8+ T cells from peripheral blood or tumors in human cancer patients (GEO accession nos. GSE99254, GSE108989, and GSE98638). scRNA-seq data of CD8+ T cells in tumors and peripheral blood from lung, CRC, and HCC patients were previously processed and uploaded by others (http://crc.cancer-pku.cn/, http://hcc.cancer-pku.cn/, http://lung.cancer-pku.cn/; Guo et al., 2018; Zhang et al., 2018; Zheng et al., 2017), and we obtained the STAT3 expression values from the above websites. The expression unit was normalized expression/log2(TPM+1). We compared the STAT3 expression values in CD8+ T cells from peripheral blood, and in PD-1–negative (PDCD1 expression value = 0) and –positive (PDCD1 expression value >0) CD8+ T cells from tumors. (B) STAT3 protein expression in CD8+ T cells from spleens, TDLNs, and tumors in B16-OVA (upper plot) and E.G7 (bottom plot) models. (C) mRNA levels of Stat3 in CD8+ T cells from TDLNs and tumors in B16-OVA (left panel) and E.G7 (right panel) models. (D) Frequencies of CD8+ T cells in thymuses, spleens, and lymph nodes in 6- to 8-wk-old Stat3fl/fl (n = 5) and Stat3fl/flCd8aCre (n = 5) mice. (E) Ratios of CD8+ T cells to CD4+ T cells in the thymuses, spleens, and lymph nodes from 6- to 8-wk-old Stat3fl/fl (n = 5) and Stat3fl/flCd8aCre (n = 5) mice. (F) Representative plots (left panel) and quantifications (right panel) of CD44 and CD62L expression on CD8+ T cells in the spleens and lymph nodes from 6- to 8-wk-old Stat3fl/fl (n = 5) and Stat3fl/flCd8aCre (n = 5) mice. (G) Ratios of CD8+ T cells to CD4+ T cells in TDLNs and tumors. (H) Representative plots (left panel) and quantifications (right panel) of H-2K(b) tetramer+ CD8+ T cells among total CD8+ T cells from TDLNs and E.G7 tumors. (I) Representative plots (left panel) and quantifications (right panel) of CD44+ PD-1+ CD8+ T cells among total CD8+ T cells from TDLNs and E.G7 tumors. (J) OT-I TIL frequencies among total CD8+T cells from TDLNs in B16-OVA model on day 20 after tumor inoculation. (K) Representative plots (left panel) and quantifications (right panel) of Ki-67 expression in OT-I TILs from B16-OVA tumors on day 20 after tumor inoculation. (L) Representative plots (left panel) and quantifications (right panel) of Ki-67 expression in splenic CD44+ CD8+ T cells on day 8 after LM-OVA infection. Data are pooled from three independent experiments (H), or are representative of two (B–F, G [left], J, and L) or three (G [right], I, and K) independent experiments. Data are shown as mean ± SEM. *, P < 0.05; **, P < 0.01; ***, P < 0.001; ****, P < 0.0001 by one-way ANOVA (A and C), unpaired two-tailed Student’s t test (D–I and L) or paired two-tailed Student’s t test (J and K). Source data are available for this figure: SourceData FS1.
Figure 1.
Figure 1.
STAT3 promotes the effector function of CD8+ T cells. (A) Mean volumes of B16-OVA tumors (left panel) in Stat3fl/fl (n = 6) and Stat3fl/flCd8aCre (n = 6) mice, or E.G7 tumors (right panel) in Stat3fl/fl (n = 7) and Stat3fl/flCd8aCre (n = 6) mice. (B) Numbers of CD8+ T cells in TDLNs and tumors from Stat3fl/fl and Stat3fl/flCd8aCre mice. (C) Representative plots (left panel) and quantifications (right panel) of IFN-γ and Granzyme B production in CD44+PD-1+ CD8+ TILs from B16-OVA (left panel) or E.G7 (right panel) tumors. (D) Experimental design for adoptive cotransfer of naive WT and Stat3−/− OT-I cells and B16-OVA tumor–challenge assay. (E) OT-I TIL frequencies among total CD8+TILs from B16-OVA tumors on day 14 and day 20 after tumor inoculation. (F) Representative plots (left panel) and quantifications (right panel) of IFN-γ and Granzyme B production in OT-I TILs from B16-OVA tumors. (G) Frequencies of OVA-specific CD8+ T cells and their numbers (P = 0.0590) in LM-OVA–infected Stat3fl/fl and Stat3fl/flCd8aCre mice on day 8. (H) Representative plots (left panel) and quantifications (right panel) of IFN-γ and Granzyme B production in splenic CD44+ CD8+ T cells on day 8 after LM-OVA infection. Data are representative of two (A [left], B [left], C [left], G, and H) or three (A [right], B [right], C [right], and D–F) independent experiments. Data are shown as mean ± SEM. *, P < 0.05; **, P < 0.01; ***, P < 0.001; ****, P < 0.0001 by two-way ANOVA (A), unpaired two-tailed Student’s t test (B, C, G, and H), or paired two-tailed Student’s t test (E and F).
Figure 2.
Figure 2.
STAT3 promotes the development of terminally differentiated CD8+ T cells. (A) Representative plots (left panel) and quantifications (right panel) of Ly108 and TIM-3 expression on OT-I cells from B16-OVA tumors on day 14 and day 20 after tumor inoculation. (B) Stacked bar graphs showing the numbers (× 104) of Ly108+TIM-3 Texprog and Ly108TIM-3+ Texterm cells based on experimental results in Fig. S2 A. The width of the stacked bar represents cell numbers (× 104). (C) GSEA results for identifying gene signatures of WT and Stat3−/− OT-I TILs compared with other T cell subsets (GEO accession no. GSE114631). NES, normalized enrichment score; FDR, false discovery rate q-value. (D) Heatmaps illustrating the relative expression of signature genes in WT and Stat3−/− OT-I TILs. (E) Lists of top 15 Gene Ontology (GO) biological pathways for DEGs of WT and Stat3−/− OT-I TILs. P value presented as −log10(P value). Columns designate −log10(P value) and circles designate gene ratio (%). (F) Representative plots (left panel) and quantification (right panel) of Granzyme B production level in TIM-3 Texprog and TIM-3+ Texterm OT-I cells from B16-OVA tumors. (G) Representative plots (left panel) and quantifications (right panel) of TCF1 and Granzyme B expression in splenic OT-I cells on day 8 after LM-OVA infection. (H) Absolute frequencies of TCF1+ and Granzyme B+ OT-I cells in the spleen, which were the product of OT-I cell frequencies and TCF1+ or Granzyme B+ cell ratios. Data are representative of two (G and H) or three (A–C and F) independent experiments. Data are shown as mean ± SEM. *, P < 0.05; **, P < 0.01; ***, P < 0.001; ****, P < 0.0001 by paired two-tailed Student’s t test (A and F–H).
Figure S2.
Figure S2.
STAT3 promotes the development of terminally differentiated CD8+ T cells. (A) Numbers of Texprog (upper panel) and Texterm (bottom panel) OT-I cells from B16-OVA tumors on day 14 and day 20 after tumor inoculation. (B) Representative plots (upper panel) and quantifications (bottom panel) of Ly108 and TIM-3 expression on OT-I cells from TDLNs in B16-OVA tumor model on day 20 after tumor inoculation. (C) Representative plots (left panel) and quantifications (right panel) of Bcl6 and Blimp1 expression in OT-I cells from B16-OVA tumors on day 14 and day 20 after tumor inoculation. (D) Representative plots (left panel) and quantifications (right panel) of TCF1 and CX3CR1 expression in/on OT-I cells from B16-OVA tumors on day 20 after tumor inoculation. (E) Representative plots (upper panel) and quantifications (bottom panel) of TOX and T-bet expression in OT-I cells from B16-OVA tumors on day 20 after tumor inoculation. (F) GSEA results for identifying gene signatures of WT and Stat3−/− OT-I TILs compared with other T cell subsets (GEO accession nos. GSE65660 and GSE8678). NES, normalized enrichment score; FDR, false discovery rate q-value. (G) Volcanic plot showing DEGs in WT and Stat3−/− OT-I TILs. (H) Heatmap illustrating the relative expression of signature genes related to cell cycle pathway in WT and Stat3−/− OT-I TILs. (I) GSEA result for identifying gene signatures of WT and Stat3−/− OT-I TILs compared to OXPHOS feature genes (GSEA: MM3893). NES, normalized enrichment score; FDR, false discovery rate q-value. (J) Heatmap illustrating the relative expression of signature genes related to OXPHOS pathway in WT and Stat3−/− OT-I TILs. (K) Representative plots (left panel) and quantification (right panel) of T-bet expression in splenic OT-I cells on day 8 after LM-OVA infection. (L) Representative plots (left panel) and quantifications (right panel) of CD127 and KLRG1 expression on splenic OT-I cells on day 8 after LM-OVA infection. (M) Representative plots (left panel) and quantification (right panel) of Granzyme B expression in TCF1Granzyme B+ splenic OT-I cells on day 8 after LM-OVA infection. (N) OT-I cell frequencies among total splenic CD8+T cells on day 8 after LM-OVA infection. (O) Representative plots (left panel) and quantification (right panel) of Ki-67 expression in splenic OT-I cells on day 8 after LM-OVA infection. Data are representative of two (K–O) or three (A–E) independent experiments. Data are shown as mean ± SEM. *, P < 0.05; **, P < 0.01; ***, P < 0.001; ****, P < 0.0001 by paired two-tailed Student’s t test (A–E and K–O).
Figure 3.
Figure 3.
IL-10 and IL-21 promote STAT3 activation in Texterm cells in cancer. (A) mRNA levels of cytokine receptors in CD8+ T cells from peripheral blood and tumors in human cancer patients (GEO accession nos. GSE99254, GSE108989, and GSE98638). (B) Representative plots of phosphorylated STAT3 at the Y705 site in CD8+ T cells from TDLNs and B16-OVA tumors (left panel) or E.G7 tumors (right panel). Cells were stimulated by IL-6, IL-10, or IL-21 for 30 min in vitro. (C) Representative plots of phosphorylated STAT3 at the S727 site in CD8+ T cells from B16-OVA (left panel) and E.G7 (right panel) tumors. Cells were stimulated by IL-6, IL-10, or IL-21 for 30 min in vitro. (D) IL6-Rα (CD126) and IL10RA (CD210) expression on CD8+ T cells from TDLNs and tumors. (E) Representative plots (upper panel) and quantifications (bottom panel) of pSTAT3(Y705) and pSTAT3(S727) in PD-1+TIM-3 and PD-1+TIM-3+ CD8+ TILs from B16-OVA (left panel) or E.G7 (right panel) tumors. Cells were stimulated by IL-10 or IL-21 for 30 min in vitro. (F) mRNA level of Stat3 in Pdcd1hiHavcr2 and Pdcd1hiHavcr2+ CD8+ T cells from B16-OVA tumors (GEO accession no. GSE122675). Pdcd1hi, Pdcd1 expression value >1; Havcr2+, Havcr2 expression value >0; Havcr2, Havcr2 expression value = 0. (G) mRNA level of STAT3 in PDCD1hiHAVCR2low and PDCD1hiHAVCR2hi CD8+ T cells from tumors in human cancer patients (GEO accesssion nos. GSE99254, GSE108989, and GSE98638). PDCD1hi, PDCD1 expression value >5; PDCD1hi cells were ranked by HAVCR2 expression value, top 50% are HAVCR2hi, and the other 50% are HAVCR2low. Data are representative of three (B–D) or two (E) independent experiments. Data are shown as mean ± SEM. *, P < 0.05; **, P < 0.01; ***, P < 0.001; ****, P < 0.0001 by one-way ANOVA (A), paired two-tailed Student’s t test (E) and unpaired two-tailed Student’s t test (F and G).
Figure 4.
Figure 4.
IL-10 and IL-21 signaling intrinsically promotes the development of Texterm cells. (A) Experimental design for in vitro culture of WT and Stat3−/− CD8+ T cells with the stimulation of IL-6, IL-10, or IL-21. (B–D) Representative plots (B and C) and quantifications (D) of TCF1 and TIM-3 expression in/on in vitro–stimulated WT and Stat3−/− CD8+ T cells (n = 4 in each group). (E) Representative plots (left panel) and quantification (right panel) of Granzyme B production in in vitro–stimulated WT and Stat3−/− CD8+ T cells (n = 4 in each group). (F) Killing assay of WT and Stat3−/− OT-I cells to B16-OVA tumor cells indicated by intracellular cleaved caspase 3 (n = 3 in each group). Activated CD8+ T cells were stimulated with IL-10 for 3 d or not. (G) Representative plots (left panel) and quantifications (right panel) of viable dye and Annexin V staining on in vitro–stimulated WT and Stat3−/− CD8+ T cells (n = 4 in each group). (H) Numbers of in vitro–stimulated WT and Stat3−/− CD8+ T cells (n = 4 in each group). (I) GSEA results for comparing the enrichment of IL-10-Fc– or IL-21–regulated feature genes in the transcriptomes of WT and Stat3−/− OT-I TILs (left panel), or Texterm and Texprog cells (right panel) (GEO accession nos. GSE168990, GSE143903, and GSE114631). NES, normalized enrichment score; FDR, false discovery rate q-value. FDR presented as −log10(FDR). (J) Correlation analysis for DEGs identified in IL-10-Fc– and STAT3-relevant RNA-seq (GEO accession no. GSE168990). DEGs were filtered by fold change >1.5 and P value <0.05. (K) Correlation analysis for DEGs identified in IL-21– and STAT3-relevant RNA-seq (GEO accession no. GSE143903). DEGs were filtered by fold change >1.5 and P value <0.05. Data are representative of three (B–E and H) or two (F and G) independent experiments. Data are shown as mean ± SEM. *, P < 0.05; **, P < 0.01; ***, P < 0.001; ****, P < 0.0001 by unpaired two-tailed Student’s t test (D, E, G, and H) and two-way ANOVA (F).
Figure S3.
Figure S3.
IL-10 and IL-21 signaling intrinsically promotes the development of Texterm cells. (A) Phosphorylation levels of STAT3 at the Y705 site in in vitro activated CD8+ T cells with the stimulation of IL-6, IL-10, or IL-21 for 30 min. (B and C) Quantifications (B) and representative plots (C) and of CD25, CD39, Ly108, and CD62L expression on in vitro–stimulated WT and Stat3−/− CD8+ T cells. (D–F) Representative plots (D and E) and quantifications (F) of TIM-3 and TCF1 expression on/in in vitro cocultured WT and Stat3−/− CD8+ T cells with the stimulation of IL-6, IL-10, or IL-21 for 3 d. (G) Proliferation of in vitro cocultured WT and Stat3−/− CD8+ T cells marked by CTV dilution. (H) Experimental design for adoptive cotransfer of WT and Sg-Il10ra or Il6ra−/− OT-I cells and B16-OVA tumor–challenge assay. (I) Representative plots of IL10RA (CD210) expression on WT and Sg-Il10ra OT-I TILs from B16-OVA tumors. (J) Representative plots (left panel) and quantifications (right panel) of Ly108 and TIM-3 expression on WT and Sg-Il10ra OT-I TILs from B16-OVA tumors. (K) Representative plots (left panel) and quantifications (right panel) of Ly108 and TIM-3 expression on WT and Il6ra−/− OT-I TILs from B16-OVA tumors. Data are representative of three (B–F, I, and K) or two (A, G, and J) independent experiments. Data are shown as mean ± SEM. *, P < 0.05; **, P < 0.01; ***, P < 0.001; ****, P < 0.0001 by unpaired two-tailed Student’s t test (B) and paired two-tailed Student’s t test (F, G, J, and K).
Figure 5.
Figure 5.
STAT3 transcriptionally regulates Tex cell differentiation. (A) Venn diagram of pSTAT3-binding peaks in IL-6–, IL-10–, and IL-21–stimulated CD8+ T cells across the whole mouse genome (mm10). (B) Genetic feature distribution (upper panel) or distribution relative to TSS (bottom panel) of pSTAT3-binding peaks in CD8+ T cells. (C) Venn diagrams of pSTAT3-binding genes and DEGs in WT or Stat3−/− CD8+ OT-I TILs. (D) Venn diagrams of STAT3-regulated genes and DEGs in Texterm or Texprog TILs (GEO accession no. GSE114631). (E) Representative STAT3-regulated feature genes of Texterm (left panel) or Texprog (right panel) cells. (F) UMAP plots identifying tumor-infiltrating memory-like and cytolytic CD8+ T cell clusters from human head and neck cancer (left panel) or melanoma (right panel) patient (GEO accession nos. GSE103322 and GSE120575). (G) Average expression of STAT3-induced (left panel) or -suppressed (right panel) signature gene clusters in memory-like or cytolytic tumor-infiltrating CD8+ T cells. STAT3-induced or -suppressed signature genes are listed in Table S3. (H) pSTAT3 ChIP-seq tracks aligned with RNA-seq tracks of WT and Stat3−/− CD8+ TILs, and ATAC-seq tracks of Texprog or Texterm cells at the specific gene loci (GEO accession no. GSE123236). (I) mRNA levels of specific genes in in vitro activated WT and Stat3−/− CD8+ T cells with the stimulation of IL-10 for 2 d or not. Data are representative of three (I) independent experiments. Data are shown as mean ± SEM. *, P < 0.05; **, P < 0.01; ***, P < 0.001; ****, P < 0.0001 by unpaired two-tailed Student’s t test (G and I).
Figure S4.
Figure S4.
STAT3 transcriptionally regulates Tex cell differentiation. (A) Signal values of pSTAT3-binding peaks in IL-6–, IL-10–, and IL-21–stimulated CD8+ T cells. (B) Top 20 KEGG pathways for pSTAT3-binding genes in in vitro activated CD8+ T cells with the stimulation of IL-6, IL-10, or IL-21. (C) Heatmaps and peak plots for read density profiles of H3K27ac, H3K27me3, H3K36me3, H3K4me1, and H3K4me3 occupations centered on pSTAT3-binding peaks (GEO accession no. GSE54191). Values were normalized to the total number of reads. (D) Venn diagrams of STAT3-regulated genes in in vitro activated CD8+ T cells with the stimulation of IL-6, IL-10, or IL-21. (E) GSEA results for comparing the enrichment of IL-6/10/21-STAT3 regulated genes in the transcriptomes of TCF1 Texterm and TCF1+ Texprog cells (GEO accession no. GSE114631). NES, normalized enrichment score; FDR, false discovery rate q-value. FDR presented as −log10(FDR). (F) Violin plots illustrating the mRNA amounts of signature genes between tumor-infiltrating memory-like and cytolytic CD8+ T cells. (accession nos. GSE103322 and GSE120575). (G) pSTAT3 ChIP-seq tracks aligned with RNA-seq tracks of WT and Stat3−/− CD8+ TILs, and ATAC-seq tracks of Texprog or Texterm cells at the specific gene loci (GEO accession no. GSE123236). Data are shown as mean ± SEM. *, P < 0.05; **, P < 0.01; ***, P < 0.001; ****, P < 0.0001 by unpaired two-tailed Student’s t test (A and F).
Figure 6.
Figure 6.
STAT3 regulates the epigenetic landscape of Tex cells in cancer. (A) Volcanic plot showing OCR peak changes between WT and Stat3−/− OT-I TILs. (B) Genetic feature distribution of changed OCR peaks between WT and Stat3−/− OT-I TILs. (C) Distribution relative to TSS of changed OCR peaks between WT and Stat3−/− OT-I TILs. (D) Violin plots showing the signal values of OCR peaks in WT and Stat3−/− OT-I TILs at Texterm or Texprog DA peaks (GEO accession no. GSE123236). (E) Volcanic plot showing differentially H3K27ac modified regions (DMRs) between IL-10–stimulated WT and Stat3−/− CD8+ T cells. DMRs were filtered by fold change >1.25 and P value <0.05. (F) Peak plots (left panel) and heatmaps (right panel) showing the deposition of H3K27ac modification centered on Texterm or Texprog DA peaks in WT and Stat3−/− OT-I TILs (GEO accession no. GSE123236). P value by Fisher test was added in the plot. (G and H) PSEA results for comparing the enrichment of signature OCR peaks in other CD8+ T cell subsets in WT and Stat3−/− OT-I TILs (GEO accession nos. GSE123236, GSE86797, and GSE116389). NES, normalized enrichment score; FDR, false discovery rate q-value. (I) Peak plot (upper panel) and heatmap (bottom panel) showing the deposition of H3K27ac modification centered on TSS in WT and Stat3−/− OT-I TILs. P value by Fisher test was added in the plot. (J) Violin plots showing the signal values of OCR peaks in WT and Stat3−/− OT-I TILs at pSTAT3-binging sites. (K) Peak plots (left panel) and heatmaps (right panel) showing the deposition of H3K27ac modification centered on pSTAT3-binding peaks in WT and Stat3−/− OT-I TILs. P value by Fisher test was added in the plot. *, P < 0.05; **, P < 0.01; ***, P < 0.001; ****, P < 0.0001 by unpaired two-tailed Student’s t test (D and J).
Figure 7.
Figure 7.
STAT3 cooperates with BATF and IRF4 to mediate Texterm cell development. (A) Enrichment of known transcription factor–binding motifs in DA OCR peaks between WT and Stat3−/− OT-I TILs. The x and y axes represent the logP value and fold change of motif enrichment separately. Targeted motifs were compared to the whole genome background to calculate the P value and fold change. (B) Peak plots for read density profiles of BATF, IRF4, TCF1, and T-bet occupations centered on pSTAT3-binding peaks in CD8+ T cells (GEO accession nos. GSE54191, GSM5016615, and GSE96724). Values were normalized to the total number of reads. P value by Chi-squared test was added in the plot. (C) Signal values of pSTAT3-binding peaks in IL-6–, IL-10–, and IL-21–stimulated CD8+ T cells at BATF- or IRF4-binding sites or not. (D) Violin plots showing the signal values of OCR peaks in WT and Stat3−/− OT-I TILs at BATF- or IRF4-binging sites. (E) Peak plots showing the deposition of H3K27ac modification centered on BATF- or IRF4-binging sites in WT and Stat3−/− OT-I TILs. P value by Fisher test was added in the plot. (F) GSEA results for comparing the enrichment of BATF- and IRF4-regulated feature genes in the transcriptomes of WT and Stat3−/− OT-I TILs (GEO accession nos. GSE154745 and GSE84820). NES, normalized enrichment score; FDR, false discovery rate q-value. FDR presented as −log10(FDR). (G) Venn diagrams of pSTAT3 and BATF-cobinding genes and BATF-regulated genes (left panel), or of pSTAT3 and IRF4-cobinding genes and IRF4-regulated genes (right panel) in CD8+ T cells. (H) Aligned ChIP-seq tracks of pSTAT3, BATF, and IRF4 in CD8+ T cells, ATAC-seq tracks of WT and Stat3−/− OT-I TILs, and H3K27ac ChIP-seq tracks of WT and Stat3−/− CD8+ T cells at the specific gene loci. (I) ChIP assays were performed with in vitro IL-10–stimulated WT and Stat3−/− CD8+ T cells with anti-BATF or anti-IRF4. The relative amount of immune-precipitated DNA was detected by real-time PCR and normalized relative to the input control. Data are representative of two (I) independent experiments. Data are shown as mean ± SEM. *, P < 0.05; **, P < 0.01; ***, P < 0.001; ****, P < 0.0001 by unpaired two-tailed Student’s t test (C, D, and I).
Figure S5.
Figure S5.
STAT3 cooperates with BATF and IRF4 to mediate Texterm cell development. (A) Enrichment of known transcription factor–binding motifs in pSTAT3-binding peaks. The x and y axes represent the logP value and fold change of the motif enrichment separately. Targeted motifs were compared to the whole genome background to calculate P value and fold change. (B) Peak plots showing the read density profiles of BATF, IRF4, JunB, JunD, and c-Jun occupations centered on pSTAT3-binding peaks in CD8+ T cells (GEO accession no. GSE54191). Values were normalized to the total number of reads. (C) Signal values of BATF-binding peaks in CD8+ T cells at pSTAT3- or IRF4-binding sites or not (GEO accession no. GSE54191). (D) Signal values of IRF4-binding peaks in CD8+ T cells at pSTAT3- or BATF-binding sites or not (GEO accession no. GSE54191). (E) Heatmaps showing the deposition of H3K27ac modification centered on BATF- or IRF4-binding peaks in WT and Stat3−/− OT-I TILs (accession GEO: GSE54191). (F) Correlation analysis for DEGs identified in BATF- and STAT3-relevant RNA-seq (GEO accession no. GSE154745). DEGs were filtered by fold change >1.5 and P value <0.05. (G) Correlation analysis for DEGs identified in IRF4- and STAT3-relevant RNA-seq (GEO accession no. GSE84820). DEGs were filtered by fold change >1.5 and P value <0.05. (H) Venn diagram of pSTAT3-, BATF-, and IRF4-binding peaks and genes. (I) Aligned ChIP-seq tracks of pSTAT3, BATF, and IRF4 in CD8+ T cells, ATAC-seq tracks of WT and Stat3−/− OT-I TILs, and H3K27ac ChIP-seq tracks of WT and Stat3−/− CD8+ T cells at the specific gene loci. Data are shown as mean ± SEM. *, P < 0.05; **, P < 0.01; ***, P < 0.001; ****, P < 0.0001 by unpaired two-tailed Student’s t test (C and D).

References

    1. Angelosanto, J.M., Blackburn S.D., Crawford A., and Wherry E.J.. 2012. Progressive loss of memory T cell potential and commitment to exhaustion during chronic viral infection. J. Virol. 86:8161–8170. 10.1128/JVI.00889-12 - DOI - PMC - PubMed
    1. Böttcher, J.P., Schanz O., Garbers C., Zaremba A., Hegenbarth S., Kurts C., Beyer M., Schultze J.L., Kastenmüller W., Rose-John S., and Knolle P.A.. 2014. IL-6 trans-signaling-dependent rapid development of cytotoxic CD8+ T cell function. Cell Rep. 8:1318–1327. 10.1016/j.celrep.2014.07.008 - DOI - PubMed
    1. Callahan, M.K., Postow M.A., and Wolchok J.D.. 2016. Targeting T cell Co-receptors for cancer Therapy. Immunity. 44:1069–1078. 10.1016/j.immuni.2016.04.023 - DOI - PubMed
    1. Chang, D., Xing Q., Su Y., Zhao X., Xu W., Wang X., and Dong C.. 2020. The conserved non-coding sequences CNS6 and CNS9 control cytokine-induced rorc transcription during T helper 17 cell differentiation. Immunity. 53:614–626.e4. 10.1016/j.immuni.2020.07.012 - DOI - PubMed
    1. Chapuis, A.G., Lee S.M., Thompson J.A., Roberts I.M., Margolin K.A., Bhatia S., Sloan H.L., Lai I., Wagener F., Shibuya K., et al. . 2016. Combined IL-21-primed polyclonal CTL plus CTLA4 blockade controls refractory metastatic melanoma in a patient. J. Exp. Med. 213:1133–1139. 10.1084/jem.20152021 - DOI - PMC - PubMed

Publication types

Substances