. 2022 May;1(5):e43.
doi: 10.1002/jex2.43. Epub 2022 Apr 3.

Biogenesis of JC polyomavirus associated extracellular vesicles

Affiliations

Biogenesis of JC polyomavirus associated extracellular vesicles

Jenna Morris-Love et al. J Extracell Biol. 2022 May.

Abstract

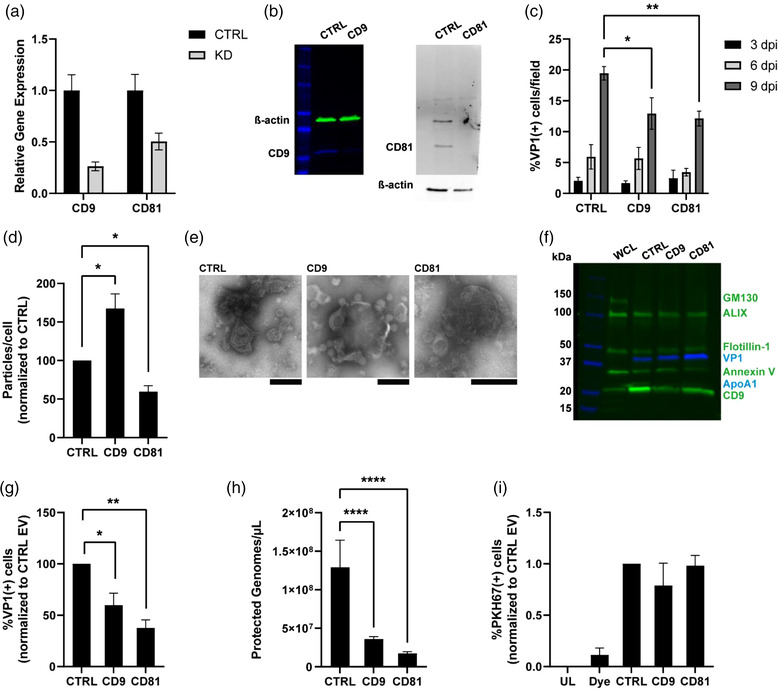
JC polyomavirus (JCPyV) is a small, non-enveloped virus that persists in the kidney in about half the adult population. In severely immune-compromised individuals JCPyV causes the neurodegenerative disease progressive multifocal leukoencephalopathy (PML) in the brain. JCPyV has been shown to infect cells by both direct and indirect mechanisms, the latter involving extracellular vesicle (EV) mediated infection. While direct mechanisms of infection are well studied indirect EV mediated mechanisms are poorly understood. Using a combination of chemical and genetic approaches we show that several overlapping intracellular pathways are responsible for the biogenesis of virus containing EV. Here we show that targeting neutral sphingomyelinase 2 (nSMase2) with the drug cambinol decreased the spread of JCPyV over several viral life cycles. Genetic depletion of nSMase2 by either shRNA or CRISPR/Cas9 reduced EV-mediated infection. Individual knockdown of seven ESCRT-related proteins including HGS, ALIX, TSG101, VPS25, VPS20, CHMP4A, and VPS4A did not significantly reduce JCPyV associated EV (JCPyV(+) EV) infectivity, whereas knockdown of the tetraspanins CD9 and CD81 or trafficking and/or secretory autophagy-related proteins RAB8A, RAB27A, and GRASP65 all significantly reduced the spread of JCPyV and decreased EV-mediated infection. These findings point to a role for exosomes and secretory autophagosomes in the biogenesis of JCPyV associated EVs with specific roles for nSMase2, CD9, CD81, RAB8A, RAB27A, and GRASP65 proteins.

Keywords: JC polyomavirus; biogenesis; extracellular vesicles.


Conflict of interest statement

CONFLICT OF INTEREST DISCLOSURE No conflicts of interest are declared by the authors.

Figures

FIGURE 1
FIGURE 1
Disruption of neutral sphingomyelinase 2 reduces EV mediated spread of JCPyV. (A) SVG‐A cells were infected with JCPyV then treated with either DMSO vehicle control or 10 μM cambinol. Spread of virus was evaluated at 3, 6, and 9 days post infection (dpi) for %VP1(+) cells. (B) shRNA targeting SMPD3 or an empty vector was used to produce control (CTRL) or SMPD3 knockdown (KD) cell lines. RT‐qPCR was used to confirm sufficient knockdown of gene expression. (C) CTRL or SMPD3 KD cells were infected with virus and viral spread was evaluated at 3, 6, and 9 dpi. (D) Nanoparticle tracking analysis (NTA) was used to evaluate the concentration of particles/mL and compared to the initial cell count the supernatant was harvested from to determine particles produced per cell. Values are compared to CTRL. (E) Transmission electron microscopy (TEM) was used to evaluate virus(+) EVs derived from CTRL and SMPD3 KD cells. Scale bars are 200 nm. (F) Western blot analysis was used to evaluate relative purity of EV samples. 7.5 μg of whole cell lysate (WCL), EVs derived from CTRL and SMPD3 KD cells were run and probed for common EV markers (ALIX, Flotillin‐1, Annexin V, CD9, LC3A/B‐I and ‐II), potential contaminants (GM130 and ApoA1), and the major viral capsid protein VP1. ApoA1 was not detected in any lane. (G) Virus(+) EVs derived from CTRL or SMPD3 KD lines were used to infect naïve wild‐type SVG‐A cells and evaluated for infection after 3 days. (H) qPCR was used to evaluate the quantity of viral genomes associated with EVs derived from CTRL or SMPD3 KD cells. (I) EVs were labeled with PKH67 and used in an uptake assay. Internalization of EVs was determined by flow cytometry before and after a trypan blue quench. Percent PKH67(+) cells from each sample type were normalized to the CTRL EVs for presentation. Only post‐trypan blue quench values are shown
FIGURE 2
FIGURE 2
CRISPR/Cas9 knockout of SMPD3 decreases JCPyV(+) EV. (A) SVG‐A cells were targeted with a CRISPR/Cas9 system to knockout SMPD3. Two clones were grown and sequenced against wild‐type SVG‐A cells. Sequencing results around the induced mutations are presented against the recorded NCBI sequence for SMPD3. The purple box represents the target sequence carried by the guideRNA. Populations (P#) represent CRISPR variants detected during next generation sequencing, with two major populations detected for KO1 and three for KO2. Graphic created in Unipro UGENE (Okonechnikov et al., 2012). (B) Wild‐type (WT) or knockout (KO) cells were infected with JCPyV and evaluated for initial viral infection at 3 dpi. (C) EVs were evaluated for particles produced per cell by comparing the NTA data to the initial cell count. Values are compared to WT. (D) Negative stains paired with TEM was used to evaluate virus(+) EVs derived from WT, KO1, and KO2 cells. Scale bars are 200 nm. (E) Western blot analysis was used to see presence of EV markers and absence of potential contaminants across all EVs compared to whole cell lysate (WCL). 1.8 μg of each sample was probed for common EV markers (ALIX, Flotillin‐1, Annexin V, CD9), potential contaminants (GM130 and ApoA1), and the major viral capsid protein VP1. ApoA1 was not detected in any lane. (F) Virus(+) EVs derived from each cell line were used to infect naïve wild‐type SVG‐A cells and evaluated for infection after 3 days. (G) qPCR was used to evaluate the quantity of viral genomes associated with EVs derived from each line. (H) Infectious EVs derived from each cell line were labeled with PKH67 and used in an uptake assay. Internalization of EVs was determined by flow cytometry before and after a trypan blue quench. Percent PKH67(+) cells from each sample type were normalized to the WT EVs for presentation, showing only post‐trypan blue quench values. Graph represents two independent experiments in triplicate
FIGURE 3
FIGURE 3
Knockdown of tetraspanin CD9 or CD81 releases fewer infectious EVs. (A) SVG‐A cells were targeted with shRNA against CD9 or CD81. RT‐qPCR was used to confirm sufficient knockdown compared to control line. (B) Depletion of respective proteins (left: CD9 KD, right: CD81 KD) was confirmed using Western blot analysis with antibodies against CD9, CD81, and β‐actin. (C) Spread of virus was evaluated at 3, 6, and 9 dpi in knockdown versus control cells. (D) EVs harvested from infected cells were assessed via NTA and initial cell counts for particles produced per cell. Each was normalized to control. (E) EV morphology and spatial relationship to JCPyV particles was observed by TEM using a negative stain. Scale bars are 200 nm. (F) EVs were characterized by Western blot analysis and probed for common EV markers (ALIX, Flotillin‐1, Annexin V, and CD9), potential contaminants (GM130 and ApoA1), and the viral protein VP1. ApoA1 was not detected in any lane. (G) EVs derived from CTRL or either knockdown line were used in an EV‐reinfection assay with infectivity evaluated at 3 dpi for %VP1(+) cells. Values are normalized to control for representation. (H) Viral genomes associated with EVs derived from each line were calculated using qPCR. (I) EVs were labeled with PKH67 and tested for uptake potential by flow cytometry before and after a trypan blue quench. Percent PKH67(+) cells (internalized EVs) post trypan blue quench are shown compared to the control for each sample. Graph represents two independent experiments run in triplicate
FIGURE 4
FIGURE 4
Single knockdown of ESCRT related proteins does not affect JCPyV(+) EV production. (A) shRNA was used to knockdown seven separate ESCRT‐related proteins. Gene knockdown was confirmed by RT‐qPCR for the respective gene compared to control cells. (B) Each knockdown line was infected with JCPyV to evaluate spread of virus over 3, 6, and 9 days. (C) Particles produced per cell was determined using NTA for EV particle concentration compared to the initial cell count. Values are normalized to control. (D) TEM was used to examine EV morphology and spatial relationship to JCPyV particles using a negative stain. Scale bar = 200 nm. (E) EVs derived from each cell line were characterized by Western blot analysis and probed for EV markers (ALIX, HSC70, Flotillin‐1, Annexin V, CD9, LC3A/B‐I and ‐II), potential EV contaminants (GM130), and the viral protein VP1. ApoA1 was tested on a separate Western and not detected in any lane. (F) Virus(+) EVs derived from each cell line was evaluated for re‐infection potential at 3 dpi. Percent VP1(+) cells were each normalized to control. (G) qPCR was used to determine the quantity of viral genomes associated with EVs
FIGURE 5
FIGURE 5
Secretory autophagy related proteins contribute to infectious JCPyV(+) EV populations. (A) RT‐qPCR was used to confirm sufficient knockdown of RAB8A, RAB27A, or GRASP65 compared to control cells. (B) Depletion of respective proteins was confirmed using Western blot analysis using antibodies against RAB8A, RAB27A, GRASP65, and β‐actin. Top panel shows CTRL vs RAB8A KD, middle panel shows CTRL vs RAB27A KD, bottom panel shows CTRL vs GRASP65 KD. (C) Spread of JCPyV was evaluated at 3, 6, and 9 dpi in KD versus CTRL cells. (D) Particles produced per cell for each EV population was assessed using NTA against the initial cell count. Each is normalized to control. (E) EV morphology and spatial relationship to JCPyV particles was observed by TEM. Scale bar = 200 nm. (F) EV characterization via Western blot analysis with common EV markers (ALIX, Flotillin‐1, Annexin V, and CD9), potential contaminants (GM130 and ApoA1), and the viral protein VP1 was performed for each EV against WCL. ApoA1 was not detected in any lane. (G) EVs were used to infect naïve SVG‐A cells with infectivity evaluated at 3 dpi for %VP1(+) cells. Values are normalized to control for representation. (H) Viral genomes associated with EVs derived from each line were calculated using absolute qPCR. (I) EVs were labeled with PKH67 and tested for uptake potential by flow cytometry before and after a trypan blue quench. Percent PKH67(+) cells (internalized EVs) post trypan blue quench are shown compared to the control EVs for each sample

References

    1. Abbott, N. J. (2002). Astrocyte‐endothelial interactions and blood‐brain barrier permeability. Journal of Anatomy, 200(6), 629–638. - PMC - PubMed
    1. Abdulrahman, B. A. , Abdelaziz, D. H. , & Schatzl, H. M. (2018). Autophagy regulates exosomal release of prions in neuronal cells. Journal of Biological Chemistry, 293(23), 8956–8968. - PMC - PubMed
    1. Adang, L. , & Berger, J. (2015). Progressive multifocal leukoencephalopathy. F1000Res, 4, 1424. - PMC - PubMed
    1. Alemu, E. A. , Lamark, T. , Torgersen, K. M. , Birgisdottir, A. B. , Larsen, K. B. , Jain, A. , Olsvik, H. , Øvervatn, A. , Kirkin, V. , & Johansen, T. (2012). ATG8 family proteins act as scaffolds for assembly of the ULK complex: Sequence requirements for LC3‐interacting region (LIR) motifs. Journal of Biological Chemistry, 287(47), 39275–39290. - PMC - PubMed
    1. Altan‐Bonnet, N. , Perales, C. , & Domingo, E. (2019). Extracellular vesicles: Vehicles of en bloc viral transmission. Virus Research, 265, 143–149. - PubMed