. 2019 Jun 20;6(6):709-715.
doi: 10.1364/optica.6.000709. Epub 2019 May 23.

Three-dimensional biplane spectroscopic single-molecule localization microscopy

Affiliations

Three-dimensional biplane spectroscopic single-molecule localization microscopy

Ki-Hee Song et al. Optica. .

Abstract

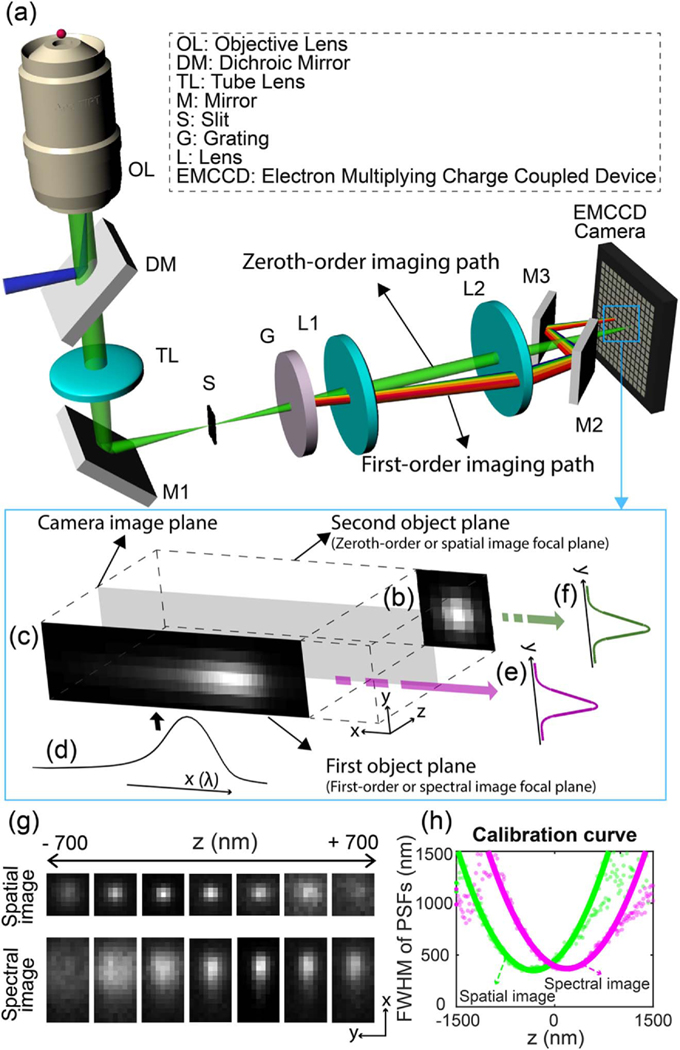
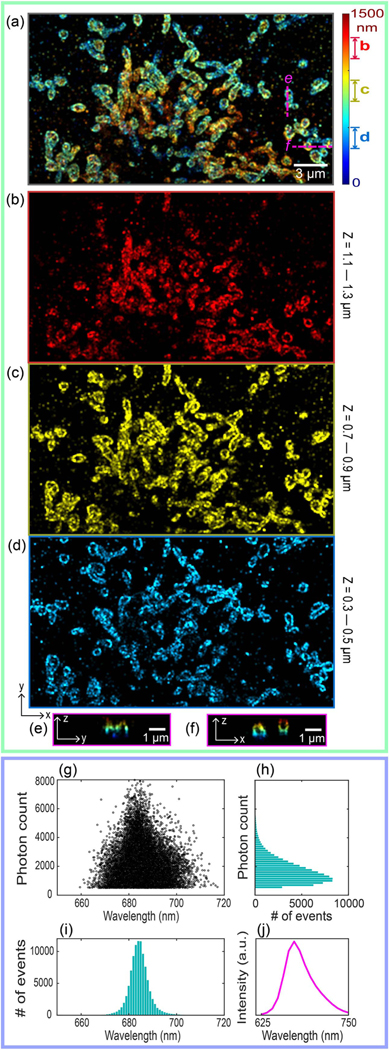
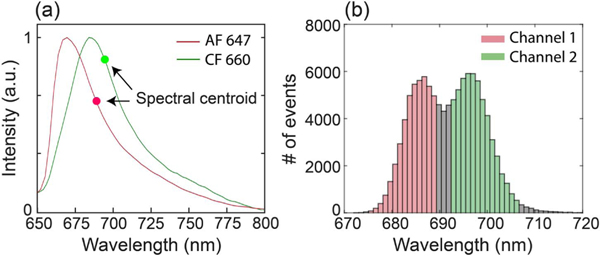
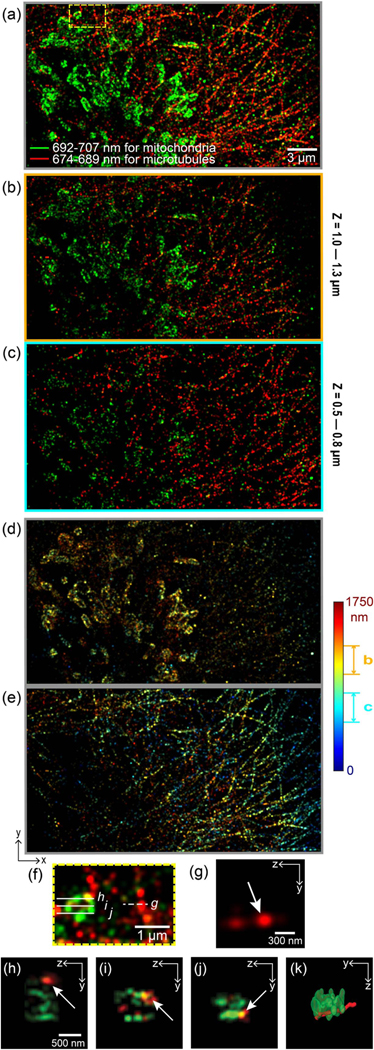
Spectroscopic single-molecule localization microscopy (sSMLM) captures the full emission spectra of individual molecules while simultaneously localizing their spatial locations at a precision greatly exceeding the optical diffraction limit. To achieve this, sSMLM uses a dispersive optical component to separate the emitted photons into dedicated spatial and spectral imaging channels for simultaneous acquisition. While adding a cylindrical lens in the spatial imaging channel enabled three-dimensional (3D) imaging in sSMLM, the inherent astigmatism leads to technical hurdles in spectral calibration and nonuniform lateral resolution at different depths. We found that implementing the biplane method based on the already established spatial and spectral imaging channels offers a much more attractive solution for 3D sSMLM. It allows for more efficient use of the limited photon budget and provides homogeneous lateral resolution compared with the astigmatism-based method using a cylindrical lens. Here we report 3D biplane sSMLM and demonstrate its multi-color 3D imaging capability by imaging microtubules and mitochondria in fixed COS-7 cells immunostained with Alexa Fluor 647 and CF 660C dyes, respectively. We showed a lateral localization precision of 20 nm at an average photon count of 550, a spectral precision of 4 nm at an average photon count of 1250, and an axial localization resolution of 50 nm.


Conflict of interest statement

Disclosures. C. Sun and H. F. Zhang have financial interests in Opticent Inc., which did not support this work. The other authors declare no conflicts of interest related to this work.

Figures

Fig. 1.
Fig. 1.
(a) Schematic and (b–f) working principle of 3D biplane sSMLM. (b) The detected spatial image and (c) the spectral image of a single-molecule emission. (c) The spectral image is the result of the convolution of the diffraction-limited PSF of individual stochastic fluorescent-emitting molecules in the spectral imaging plane and (d) the linearly spread spectroscopic signature. By integrating the spectral and spatial images along the x axis, (e), (f) 1D PSFys are retrieved from both images and used for biplane imaging. (g) The experimentally acquired spatial (top row) and spectral (bottom) images at the different axial positions from single emitters. (h) The experimentally obtained depth calibration curve.
Fig. 2.
Fig. 2.
(a) Overall projection image of the reconstructed 3D sSMLM with pseudocolors corresponding to the z-axis positions of individual molecules. (b–d) The projection images from three 200 nm thick sections as highlighted in (a). The cross-sectional images in (e) the yz plane and (f) xz plane corresponding to the three magenta-dashed lines as highlighted in (a). (g–j) Spectral analyses of same single AF647 molecules. (g) The scatterplot of the photo count versus the spectral centroids. (h) and (i) respectively show the statistics of the emission photon count versus the number of emission events and centroid wavelengths versus the number of emission events. (j) The averaged spectrum of AF647 of all emission events in (g).
Fig. 3.
Fig. 3.
(a) Normalized emission spectra of AF647 (red) and CF660C (green) with their centroids (686 nm for AF647 and 695 nm for CF660C), respectively. (b) The histogram of spectral centroid of multi-color 3D sSMLM image of tubulin and TOM20, labeled with AF647 and CF660C, respectively. To separate the two dyes, we defined two different color channels: (1) 674 to 689 nm for AF647 and (2) 692 nm to 707 nm for CF660C.
Fig. 4.
Fig. 4.
(a) Overall 2D projection view over a whole depth range of 1.75 μm. The red and green colors represent AF647-labeled microtubules and CF660C-labeled mitochondria, respectively. (a) The projection images for different axial ranges from (b) 1.0 to 1.3 μm and from (c) 0.5 to 0.8 μm [color-coded along the spectral centroid in (a–c)]. The separated 3D sSMLM images for different color channels, (d) 692 to 707 nm for mitochondria and (e) 674–689 nm for microtubules [color-coded along the axial axis in (d–e)]. (f) The magnified view of the region indicated by the yellow-dashed box in (a). (g) The cross-section image corresponding to the white-dashed lines in(f).(h–j)Thecross-section images corresponding to the three white-solid lines in (f) [color-coded along the spectral centroid in (f–j)]. (k) The volumetric rendering of the region covering (h–j). The rendering was visualized with the interpolation for a microtubule.

References

    1. Zhang Z, Kenny SJ, Hauser M, Li W, and Xu K, “Ultrahigh-throughput single-molecule spectroscopy and spectrally resolved super-resolution microscopy,” Nat. Methods 12, 935–938 (2015). - PubMed
    1. Dong B, Almassalha L, Urban BE, Nguyen TQ, Khuon S, Chew TL, Backman V, Sun C, and Zhang HF, “Super-resolution spectroscopic microscopy via photon localization,” Nat. Commun. 7, 12290 (2016). - PMC - PubMed
    1. Mlodzianoski MJ, Curthoys NM, Gunewardene MS, Carter S, and Hess ST, “Super-resolution imaging of molecular emission spectra and single molecule spectral fluctuations,” PLoS One 11, e0147506 (2016). - PMC - PubMed
    1. Bongiovanni MN, Godet J, Horrocks MH, Tosatto L, Carr AR, Wirthensohn DC, Ranasinghe RT, Lee JE, Ponjavic A, Fritz JV, Dobson CM, Klenerman D, and Lee SF, “Multi-dimensional super-resolution imaging enables surface hydrophobicity mapping,” Nat. Commun. 7, 13544 (2016). - PMC - PubMed
    1. Dong B, Soetikno BT, Chen X, Backman V, Sun C, and Zhang HF,“Parallel three-dimensional tracking of quantum rods using polarization-sensitive spectroscopic photon localization microscopy,” ACS Photon. 4,1747–1752 (2017).

LinkOut - more resources