. 2023 Jun;16(3):644-661.
doi: 10.1007/s12265-022-10346-6. Epub 2023 Jan 23.

Comparative Study of Different Acupoints for Treating Acute Myocardial Ischemia in Mice

Affiliations

Comparative Study of Different Acupoints for Treating Acute Myocardial Ischemia in Mice

Hao Hong et al. J Cardiovasc Transl Res. 2023 Jun.

Abstract

Acupuncture point specificity has been recognized as a key scientific issue in traditional Chinese medicine (TCM), but there is limited clinical trial or animal study to verify the characteristics of PC6, BL15, and ST36 in the protection from myocardial injury. We aimed to compare the effects among these three acupoints on the acute myocardial infarction mice model and to explore possible mechanisms for the first time. We found that PC6 is the most appropriate acupoint to deliver efficacy and safety to treat acute MI in mice. BL15 stimulation improved the systolic function, but increased the risk of arrhythmia. ST36 only slightly attenuated systolic function and had no effect on arrhythmia during MI. RNA profiles of skin tissue in local acupoints demonstrated that the most altered DEGs and related pathways may partly support its best effects of PC6 treatment on MI injury, and support the observed phenomenon of the acupoint specificity.

Keywords: Acupoint specificity; Acupuncture; Fibrosis; Inflammation; Myocardial infarction.


Conflict of interest statement

The authors declare no competing interests.

Figures
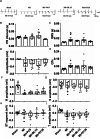
Fig. 1
Fig. 1
Electrophysiology and cardiac function in the Sham, MI, MI + PC6, MI + BL15, and MI + ST36 groups. A Representative electrocardiogram recordings in the Sham, MI, MI + PC6, MI + BL15, and MI + ST36 groups. BI Summary of the electrophysiology, including the PR interval, QRS width, QTc, Q amplitude, R amplitude, S amplitude, ST segment, and T amplitude in the Sham (n = 9), MI (n = 7), MI + PC6 (n = 8) groups, MI + BL15 (n = 8), and MI + ST36 (n = 8) groups. J Representative echocardiograms from parasternal short-axis images at the midpapillary level in the Sham (n = 9), MI (n = 7), MI + PC6 (n = 8), MI + BL15 (n = 8), and MI + ST36 (n = 8) groups. A summary of echocardiographic parameters is listed below (KN). K Ejection fraction (EF). L Fractional shortening (FS). M Heart rate (HR). N Stroke volume (SV). A represents p < 0.05 vs. the Sham group, B represents p < 0.05 vs. the MI group
Fig. 1
Fig. 1
Electrophysiology and cardiac function in the Sham, MI, MI + PC6, MI + BL15, and MI + ST36 groups. A Representative electrocardiogram recordings in the Sham, MI, MI + PC6, MI + BL15, and MI + ST36 groups. BI Summary of the electrophysiology, including the PR interval, QRS width, QTc, Q amplitude, R amplitude, S amplitude, ST segment, and T amplitude in the Sham (n = 9), MI (n = 7), MI + PC6 (n = 8) groups, MI + BL15 (n = 8), and MI + ST36 (n = 8) groups. J Representative echocardiograms from parasternal short-axis images at the midpapillary level in the Sham (n = 9), MI (n = 7), MI + PC6 (n = 8), MI + BL15 (n = 8), and MI + ST36 (n = 8) groups. A summary of echocardiographic parameters is listed below (KN). K Ejection fraction (EF). L Fractional shortening (FS). M Heart rate (HR). N Stroke volume (SV). A represents p < 0.05 vs. the Sham group, B represents p < 0.05 vs. the MI group
Fig. 2
Fig. 2
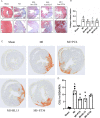
Acupuncture reduced fibrosis, improved myocardial enzyme and anti-inflammatory in heart and serum. A Tissue sections and fibrosis in the ventricle determined by calculating collagen deposition after Masson’s trichrome staining in the Sham, MI, MI + PC6, MI + BL15, and MI + ST36 group mice. Scale bar: 200 μm. B Collagen deposition index in these groups, n = 3 in each group. CD Representative COL1-α immunohistochemical staining and analysis of heart tissues in the Sham, MI, MI + PC6, MI + BL15, and MI + ST36 groups, n = 3 in each group. E The serum CK level. F The serum CK-MB level. G The serum LDH level. H The serum cTnT level in the Sham, MI, MI + PC6, MI + BL15, and MI + ST36 groups. n = 7 ~ 9 in each group. I The serum IL-6 level. J The serum IL-10 level. K The serum TNF-α level. L the serum INF-γ level, in the Sham, MI, MI + PC6, MI + BL15, and MI + ST36 groups, n = 7 ~ 9 in each group. M Hematoxylin and eosin staining (HE) staining of heart tissue, n = 3 in each group. N Representative TNF-α immunohistochemical staining and analysis of heart tissues in the Sham, MI, MI + PC6, MI + BL15, and MI + ST36 groups, n = 3 in each group. A represents p < 0.05 vs. the Sham group, B represents p < 0.05 vs. the MI group
Fig. 2
Fig. 2
Acupuncture reduced fibrosis, improved myocardial enzyme and anti-inflammatory in heart and serum. A Tissue sections and fibrosis in the ventricle determined by calculating collagen deposition after Masson’s trichrome staining in the Sham, MI, MI + PC6, MI + BL15, and MI + ST36 group mice. Scale bar: 200 μm. B Collagen deposition index in these groups, n = 3 in each group. CD Representative COL1-α immunohistochemical staining and analysis of heart tissues in the Sham, MI, MI + PC6, MI + BL15, and MI + ST36 groups, n = 3 in each group. E The serum CK level. F The serum CK-MB level. G The serum LDH level. H The serum cTnT level in the Sham, MI, MI + PC6, MI + BL15, and MI + ST36 groups. n = 7 ~ 9 in each group. I The serum IL-6 level. J The serum IL-10 level. K The serum TNF-α level. L the serum INF-γ level, in the Sham, MI, MI + PC6, MI + BL15, and MI + ST36 groups, n = 7 ~ 9 in each group. M Hematoxylin and eosin staining (HE) staining of heart tissue, n = 3 in each group. N Representative TNF-α immunohistochemical staining and analysis of heart tissues in the Sham, MI, MI + PC6, MI + BL15, and MI + ST36 groups, n = 3 in each group. A represents p < 0.05 vs. the Sham group, B represents p < 0.05 vs. the MI group
Fig. 3
Fig. 3
Expression of representative genes of inflammation, myocardial contraction and fibrosis after different acupoint stimulation. AC P2 × 7, Tnf-α, Il-6 mRNA expression in the heart. DE Cav 1.2, Serca mRNA expression in the heart. FG Cthrc1, Col1-α mRNA expression in the heart. A represents p < 0.05 vs. the Sham group, B represents p < 0.05 vs. the MI group, n = 3 in each group
Fig. 4
Fig. 4
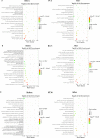
Differentially expressed genes (DEGs) altered in acupoints by acupuncture treatment. A Top 20 Go ontology (GO) analysis of the DEGs altered in PC6 acupoint before and after acupuncture. B Top 20 GO analysis of the DEGs altered in BL15 acupoint before and after acupuncture. C Top 20 GO analysis of the DEGs altered in ST36 acupoint before and after acupuncture treatment. D, E Top 15 KEGG pathways of the DEGs altered in PC6, BL15, and ST36 acupoint before and after acupuncture treatment separately, n = 3 in each group
Fig. 4
Fig. 4
Differentially expressed genes (DEGs) altered in acupoints by acupuncture treatment. A Top 20 Go ontology (GO) analysis of the DEGs altered in PC6 acupoint before and after acupuncture. B Top 20 GO analysis of the DEGs altered in BL15 acupoint before and after acupuncture. C Top 20 GO analysis of the DEGs altered in ST36 acupoint before and after acupuncture treatment. D, E Top 15 KEGG pathways of the DEGs altered in PC6, BL15, and ST36 acupoint before and after acupuncture treatment separately, n = 3 in each group
Fig. 5
Fig. 5
Further analysis of unique genes in the MI + PC6, MI + BL15, and MI + ST36 groups and qPCR verification of some unique genes for different acupoints. A, B Venn diagram of the DEGs in PC6 acupoint before and after acupuncture. C, D GO analysis of the co-regulated genes in the PC6 acupoint before and after acupuncture. E, F Venn diagram of the DEGs in BL15 acupoint before and after acupuncture. G, H Venn diagram of the DEGs in ST36 acupoint before and after acupuncture. There is no GO analysis both in BL15 acupoint and ST36 acupoint due to very few co-regulated genes exist. IM Il-5R, Wfdc12, Wnt4, Doc2b, Erdr1 mRNA expression in the acupoints. Some acupoints unique genes displayed no signal in the qPCR assay. Panel A represents p < 0.05 vs. the Sham group. Panel B represents p < 0.05 vs. the MI group, n = 3 in each group
Fig. 5
Fig. 5
Further analysis of unique genes in the MI + PC6, MI + BL15, and MI + ST36 groups and qPCR verification of some unique genes for different acupoints. A, B Venn diagram of the DEGs in PC6 acupoint before and after acupuncture. C, D GO analysis of the co-regulated genes in the PC6 acupoint before and after acupuncture. E, F Venn diagram of the DEGs in BL15 acupoint before and after acupuncture. G, H Venn diagram of the DEGs in ST36 acupoint before and after acupuncture. There is no GO analysis both in BL15 acupoint and ST36 acupoint due to very few co-regulated genes exist. IM Il-5R, Wfdc12, Wnt4, Doc2b, Erdr1 mRNA expression in the acupoints. Some acupoints unique genes displayed no signal in the qPCR assay. Panel A represents p < 0.05 vs. the Sham group. Panel B represents p < 0.05 vs. the MI group, n = 3 in each group
Fig. 6
Fig. 6
Graphical abstract of the mechanism for the protective effect of acupuncture on different acupoints

Similar articles

Cited by

References

    1. Roth GA, Mensah GA, Johnson CO, Addolorato G, Ammirati E, Baddour LM, et al. Global burden of cardiovascular diseases and risk factors, 1990–2019: update from the GBD 2019 study. J Am Coll Cardiol. 2020;76:2982–3021. doi: 10.1016/j.jacc.2020.11.010. - DOI - PMC - PubMed
    1. Anzai T. Inflammatory mechanisms of cardiovascular remodeling. Circ J. 2018;82:629–635. doi: 10.1253/circj.CJ-18-0063. - DOI - PubMed
    1. Zhao L, Li DH, Zheng H, Chang XR, Cui J, Wang R, et al. Acupuncture as adjunctive therapy for chronic stable angina: a randomized clinical trial. JAMA Intern Med. 2019;179:1388–1397. doi: 10.1001/jamainternmed.2019.2407. - DOI - PMC - PubMed
    1. Fu SP, He SY, Xu B, Hu CJ, Lu SF, Shen WX, et al. Acupuncture promotes angiogenesis after myocardial ischemia through H3K9 acetylation regulation at VEGF gene. PLoS One. 2014;9:e94604. doi: 10.1371/journal.pone.0094604. - DOI - PMC - PubMed
    1. Zeng Q, He H, Wang XB, Zhou YQ, Lin HX, Tan ZP, et al. Electroacupuncture preconditioning improves myocardial infarction injury via enhancing AMPK-dependent autophagy in rats. Biomed Res Int. 2018;2018:1238175. doi: 10.1155/2018/1238175. - DOI - PMC - PubMed

Publication types