

Gene expression studies of WT1 mutant Wilms tumor cell lines in the frame work of published kidney development data reveals their early kidney stem cell origin
- PMID: 36689432
- PMCID: PMC9870146
- DOI: 10.1371/journal.pone.0270380
Gene expression studies of WT1 mutant Wilms tumor cell lines in the frame work of published kidney development data reveals their early kidney stem cell origin
Abstract
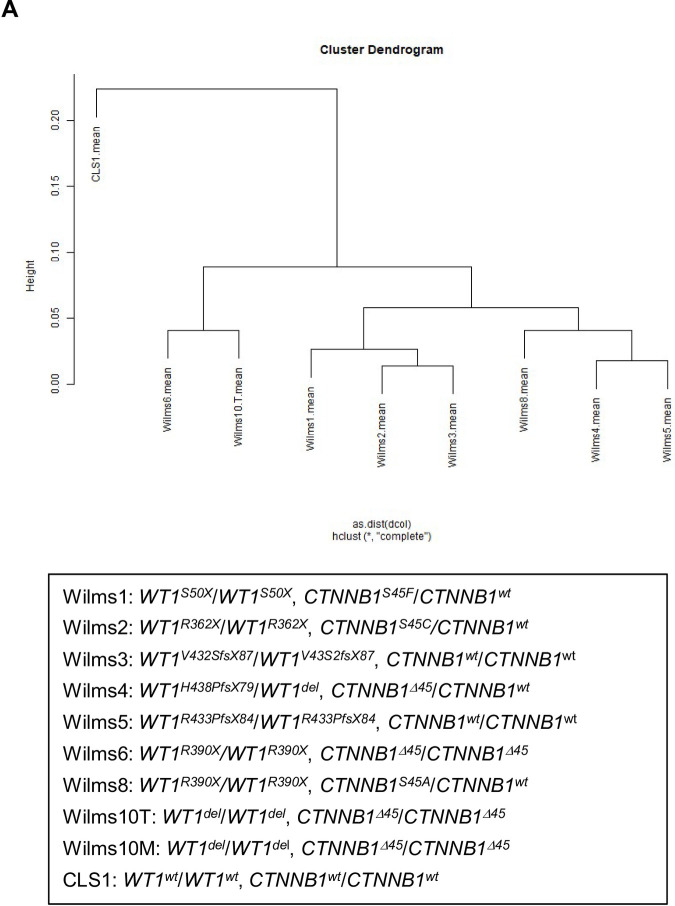
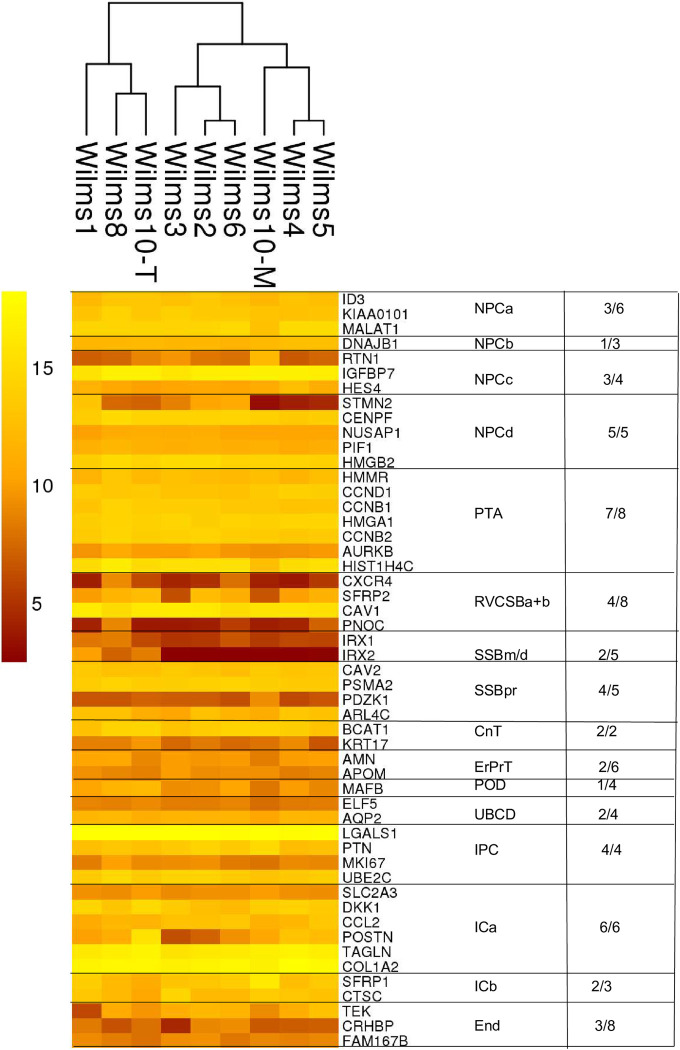
In order to get a better insight into the timing of WT1 mutant Wilms tumor development, we compared the gene expression profiles of nine established WT1 mutant Wilms tumor cell lines with published data from different kidney cell types during development. Publications describing genes expressed in nephrogenic precursor cells, ureteric bud cells, more mature nephrogenic epithelial cells and interstitial cell types were used. These studies uncovered that the WT1 mutant Wilms tumor cells lines express genes from the earliest nephrogenic progenitor cells, as well as from more differentiated nephron cells with the highest expression from the stromal/interstitial compartment. The expression of genes from all cell compartments points to an early developmental origin of the tumor in a common stem cell. Although variability of the expression of specific genes was evident between the cell lines the overall expression pattern was very similar. This is likely dependent on their different genetic backgrounds with distinct WT1 mutations and the absence/presence of mutant CTNNB1.
Copyright: © 2023 Royer-Pokora et al. This is an open access article distributed under the terms of the Creative Commons Attribution License, which permits unrestricted use, distribution, and reproduction in any medium, provided the original author and source are credited.
Conflict of interest statement
The authors have declared that no competing interests exist.
Figures


Similar articles
-
Wilms tumour histology is determined by distinct types of precursor lesions and not epigenetic changes.J Pathol. 2008 Aug;215(4):377-87. doi: 10.1002/path.2366. J Pathol. 2008. PMID: 18484682
-
Clinically relevant subsets identified by gene expression patterns support a revised ontogenic model of Wilms tumor: a Children's Oncology Group Study.Neoplasia. 2012 Aug;14(8):742-56. doi: 10.1593/neo.12714. Neoplasia. 2012. PMID: 22952427 Free PMC article.
-
WT1-Mutant Wilms Tumor Progression Is Associated With Diverting Clonal Mutations of CTNNB1.J Pediatr Hematol Oncol. 2021 Mar 1;43(2):e180-e183. doi: 10.1097/MPH.0000000000001697. J Pediatr Hematol Oncol. 2021. PMID: 31876779
-
Wilms tumor and the WT1 gene.Exp Cell Res. 2001 Mar 10;264(1):74-99. doi: 10.1006/excr.2000.5131. Exp Cell Res. 2001. PMID: 11237525 Review.
-
The development of Wilms tumor: from WT1 and microRNA to animal models.Biochim Biophys Acta. 2014 Aug;1846(1):180-7. doi: 10.1016/j.bbcan.2014.07.003. Epub 2014 Jul 11. Biochim Biophys Acta. 2014. PMID: 25018051 Review.
Cited by
-
Wilms' Tumor: A Review of Clinical Characteristics, Treatment Advances, and Research Opportunities.Medicina (Kaunas). 2025 Mar 12;61(3):491. doi: 10.3390/medicina61030491. Medicina (Kaunas). 2025. PMID: 40142302 Free PMC article. Review.
-
Exploiting embryonic niche conditions to grow Wilms tumor blastema in culture.Front Oncol. 2023 Mar 16;13:1091274. doi: 10.3389/fonc.2023.1091274. eCollection 2023. Front Oncol. 2023. PMID: 37007076 Free PMC article.
-
Comprehensive prognostic gene identification and functional characterization of GRAMD1A in Wilms tumor: development of risk prediction models and therapeutic implications.Front Oncol. 2024 Nov 26;14:1501718. doi: 10.3389/fonc.2024.1501718. eCollection 2024. Front Oncol. 2024. PMID: 39659787 Free PMC article.
-
Cytokine Signaling in Pediatric Kidney Tumor Cell Lines WT-CLS1, WT-3ab and G-401.Int J Mol Sci. 2024 Feb 14;25(4):2281. doi: 10.3390/ijms25042281. Int J Mol Sci. 2024. PMID: 38396958 Free PMC article.
-
Altered binding affinity of SIX1-Q177R correlates with enhanced WNT5A and WNT pathway effector expression in Wilms tumor.Dis Model Mech. 2023 Nov 1;16(11):dmm050208. doi: 10.1242/dmm.050208. Epub 2023 Nov 17. Dis Model Mech. 2023. PMID: 37815464 Free PMC article.
References
-
- Mugford JW, Sipilä P, McMahon JA, McMahon AP. Osr1 expression demarcates a multi-potent population of intermediate mesoderm that undergoes progressive restriction to an Osr1-dependent nephron progenitor compartment within the mammalian kidney. Dev Biol. 2008; 324:88–98 doi: 10.1016/j.ydbio.2008.09.010 - DOI - PMC - PubMed
Publication types
MeSH terms
Substances
LinkOut - more resources
Full Text Sources
Medical
Molecular Biology Databases
Miscellaneous
