. 2023 Jan 23;21(1):e3001950.
doi: 10.1371/journal.pbio.3001950. eCollection 2023 Jan.

Yeast derlin Dfm1 employs a chaperone-like function to resolve misfolded membrane protein stress

Affiliations

Yeast derlin Dfm1 employs a chaperone-like function to resolve misfolded membrane protein stress

Rachel Kandel et al. PLoS Biol. .

Abstract

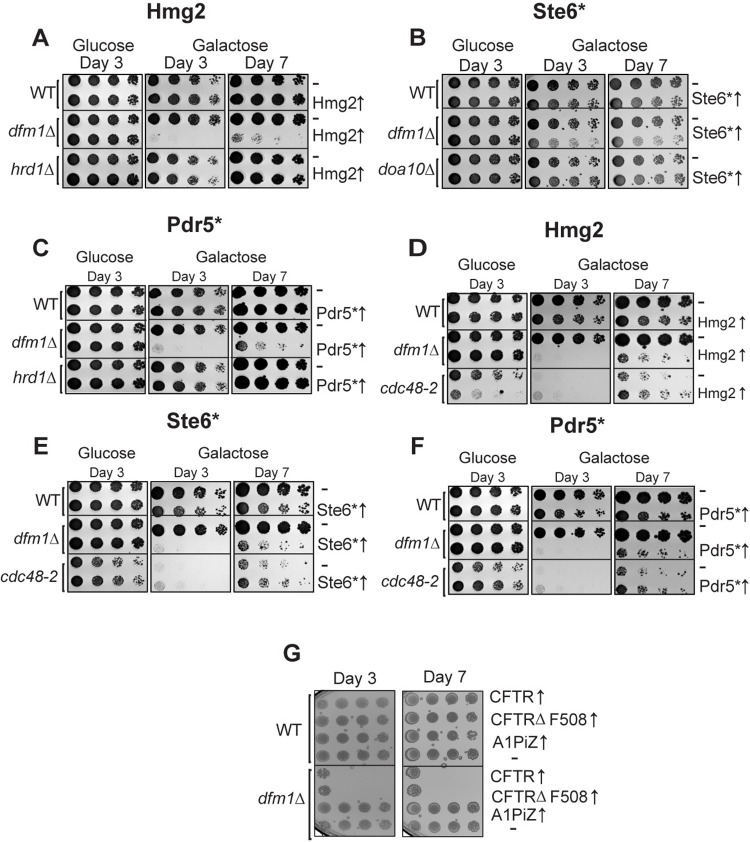
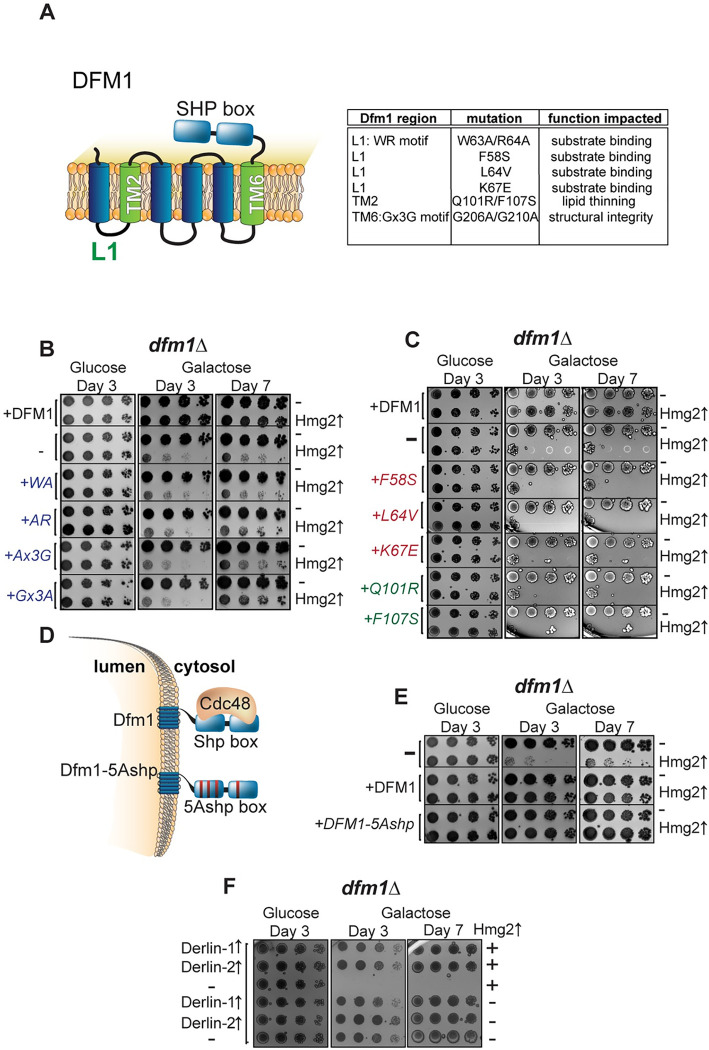
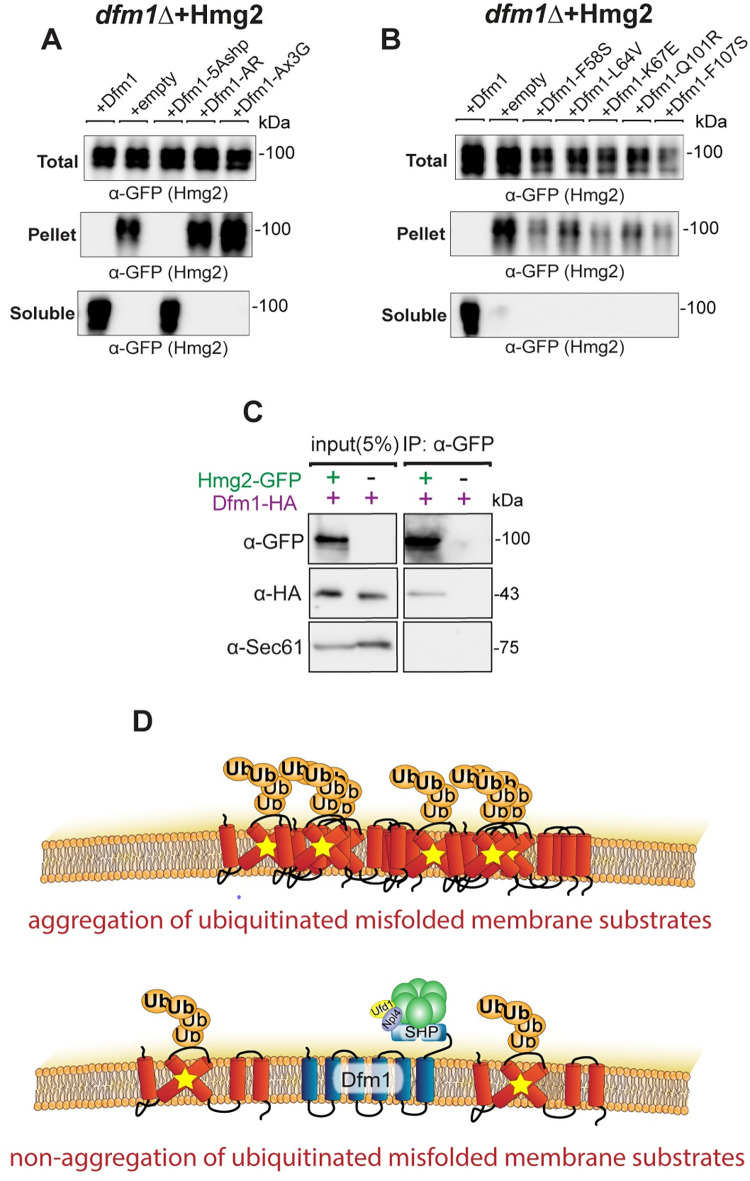
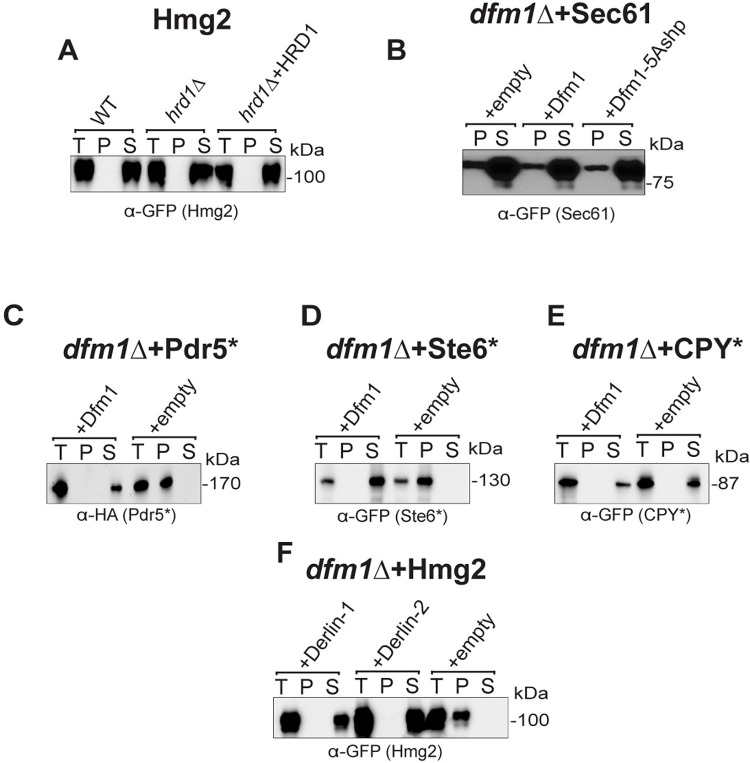
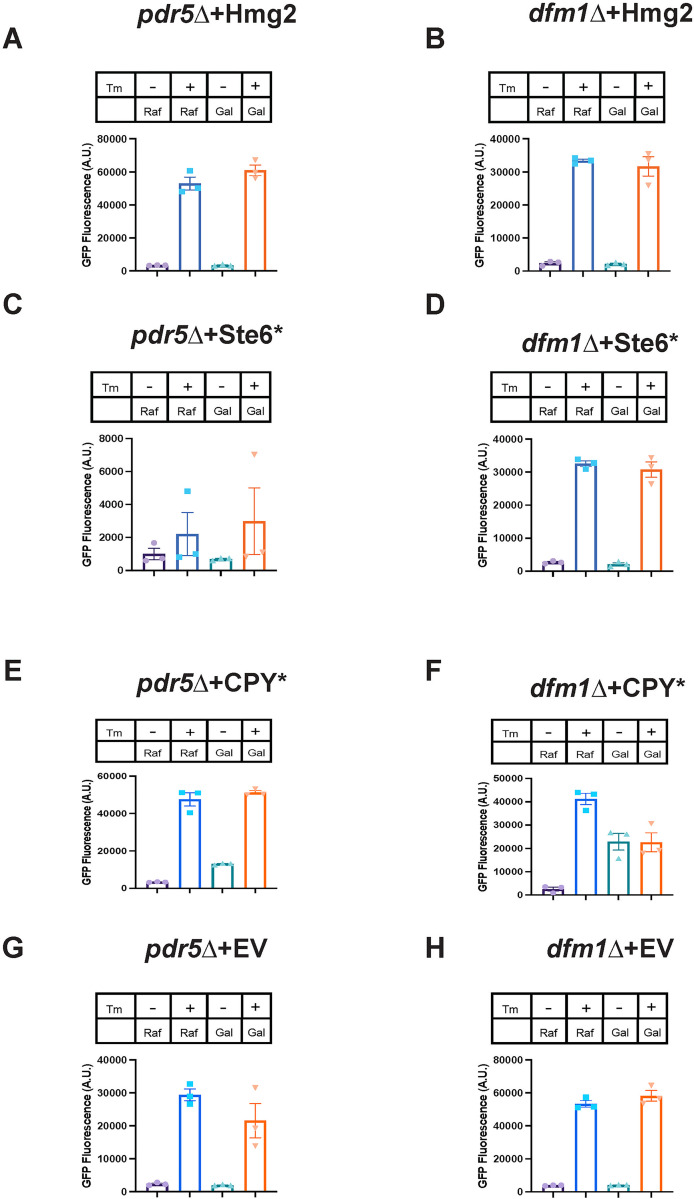
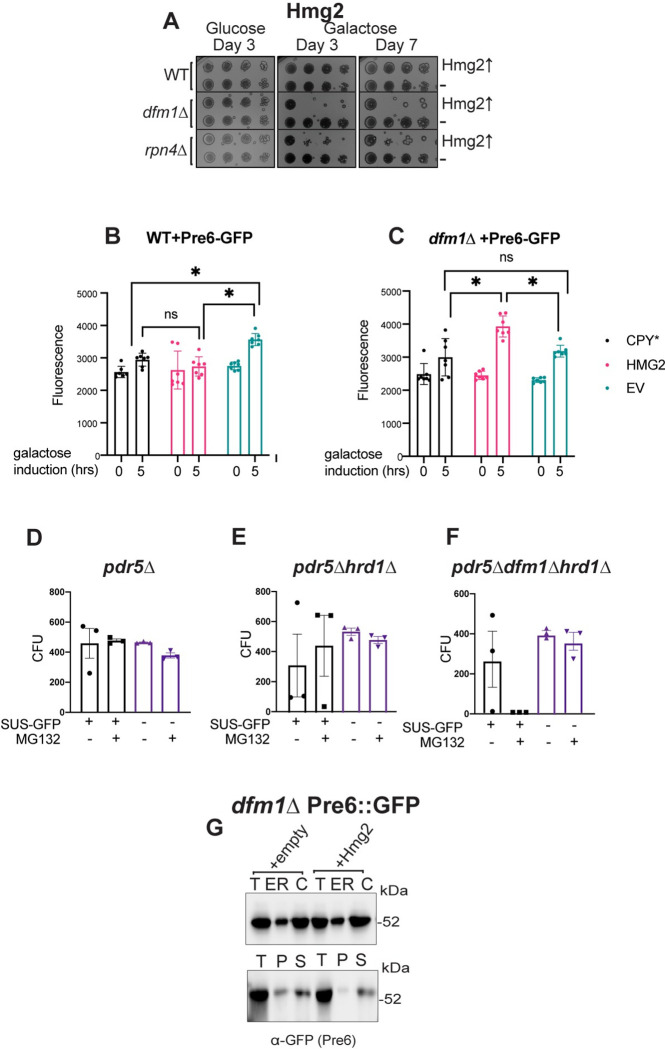
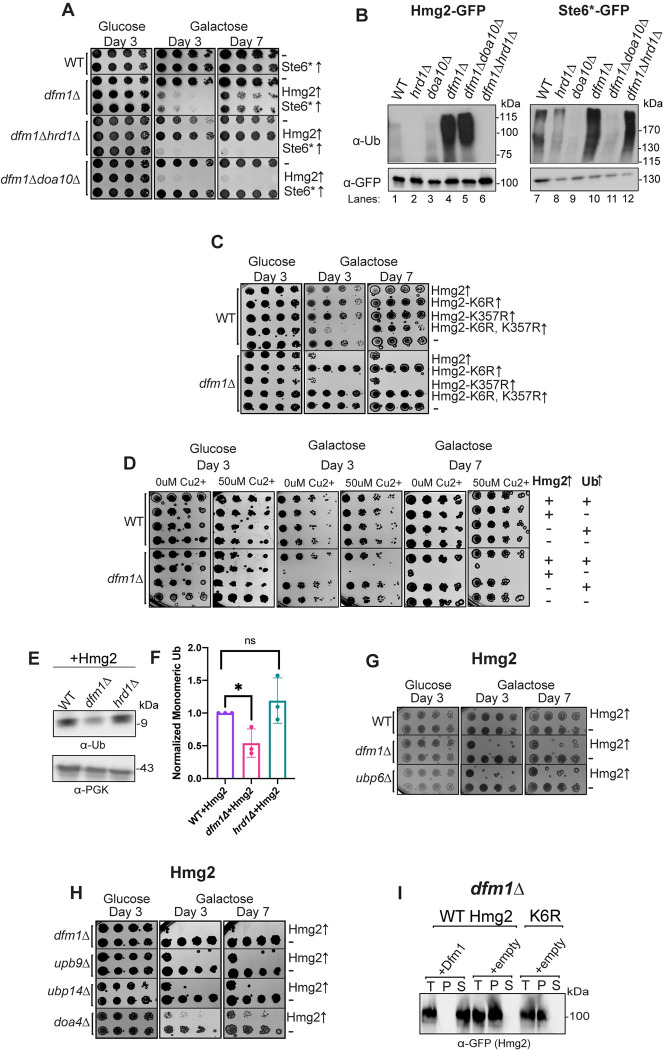
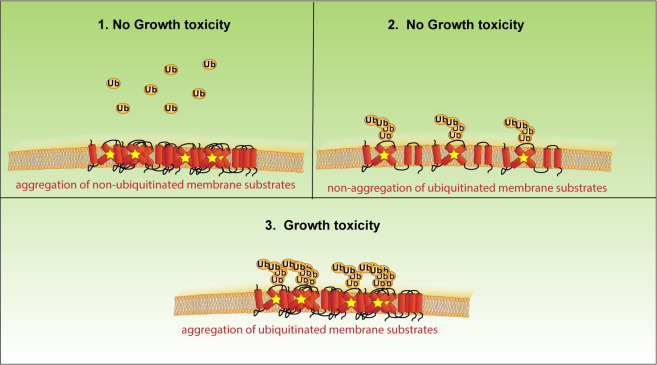
Protein aggregates are a common feature of diseased and aged cells. Membrane proteins comprise a quarter of the proteome, and yet, it is not well understood how aggregation of membrane proteins is regulated and what effects these aggregates can have on cellular health. We have determined in yeast that the derlin Dfm1 has a chaperone-like activity that influences misfolded membrane protein aggregation. We establish that this function of Dfm1 does not require recruitment of the ATPase Cdc48 and it is distinct from Dfm1's previously identified function in dislocating misfolded membrane proteins from the endoplasmic reticulum (ER) to the cytosol for degradation. Additionally, we assess the cellular impacts of misfolded membrane proteins in the absence of Dfm1 and determine that misfolded membrane proteins are toxic to cells in the absence of Dfm1 and cause disruptions to proteasomal and ubiquitin homeostasis.


Conflict of interest statement

The authors have declared no competing interests exist.

Figures

Fig 1
Fig 1. Integral membrane protein overexpression causes a growth defect in dfm1Δ cells in an ERAD independent manner.
(A) WT, dfm1Δ, and hrd1Δ cells containing either GALpr-HMG2-GFP or EV were compared for growth by dilution assay. Each strain was spotted 5-fold dilutions on glucose or galactose-containing plates to drive HMG2-GFP overexpression, and plates were incubated at 30°C. (B) Dilution assay as described in (A) except using WT, dfm1Δ, and doa10Δ cells containing either GALpr-STE6*-GFP or EV. (C) Dilution assay as described in (A) except using WT, dfm1Δ, and hrd1Δ cells containing either GALpr-PDR5*-HA or EV. (D) Dilution assay as described in (A) except using WT, dfm1Δ, and cdc48-2 cells. (E) Dilution assay as described in (B) except using WT, dfm1Δ, and cdc48-2 cells. (F) Dilution assay as described in (C) except using WT, dfm1Δ, and cdc48-2 cells. (G) Dilution assay as described in (A) except using WT or dfm1Δ cells expressing human CFTR, CFTRΔF508, or A1PiZ and plated only on glucose-containing plates. All dilution growth assays were performed in 3 biological and 2 technical replicates (N = 3). CFTR, cystic fibrosis transmembrane receptor; ERAD, endoplasmic reticulum-associated degradation; EV, empty vector.
Fig 2
Fig 2. Dfm1 retrotranslocation defective mutants show differing abilities to restore growth.
(A) Depiction of Dfm1, which highlights L1, TM2, TM6, and its SHP box domain. The table indicates the Dfm1 region, amino acid mutation, and the corresponding function that is specifically impaired. All mutants have been previously identified as being required for retrotranslocation and when mutated did not restore growth in dfm1Δ cells expressing an integral membrane protein (GALpr-HMG2-GFP). (B) dfm1Δ cells with an add-back of either WT DFM1-HA, EV, DFM1-WA-HA, DFM1-AR-HA, DFM1-Ax3G-HA, or DFM1-Gx3A-HA containing either GALpr-HMG2-GFP or EV were compared for growth by dilution assay. Each strain was spotted 5-fold dilutions on glucose or galactose-containing plates to drive Hmg2-GFP overexpression, and plates were incubated at 30°C. (C) Dilution assay as described in (B) except using an add-back of either WT Dfm1-HA, EV, Dfm1-F57S-HA, Dfm1-L64V-HA, Dfm1-K67E-HA, Dfm1-Q101R-HA, or Dfm1-F107S-HA. (D) Depiction of Dfm1 and Dfm1-5Ashp. Dfm1 is an ER-localized membrane proteins with 6 TMDs. Both versions of Dfm1 have a cytoplasmic shp box, but the 5Ashp mutant is unable to recruit the cytosolic ATPase Cdc48. (E) Dilution assay as described in (B) except using add-back of either EV, WT DFM1-HA, or DFM1-5Ashp-HA mutant. (F) Dilution assay as described in (B) except with add-back of human Derlin-1-Myc or Derlin-2-Myc. All dilution growth assays were performed in 3 biological replicates and 2 technical replicates (N = 3). ER, endoplasmic reticulum; EV, empty vector; TMD, transmembrane domain.
Fig 3
Fig 3. Dfm1 reduces misfolded membrane protein toxicity through a chaperone-like activity.
(A) Western blot of aggregated (pelleted) versus non-aggregated (soluble) membrane proteins at the ER. Lysates from dfm1Δ cells containing HMG2-GFP, with either add-back of WT DFM1-HA, EV, DFM1-5Ashp-HA, DFM1-AR-HA, and DFM1-AxxxG-HA were blotted using anti-GFP to detect Hmg2. Top: Total fraction. Middle: ER pelleted fraction. Bottom: ER DDM solublilized fraction. (B) Western blot of aggregated versus non-aggregated membrane proteins at the ER as in (A) but with add-back of either WT DFM1-HA, EV, DFM1-F58S-HA, DFM1-L64V-HA, DFM1-K67E-HA, DFM1-Q101R-HA, and DFM1-F107S-HA. (C) DDM solubilized Hmg2-GFP binding to Dfm1-HA was analyzed by Co-IP, using anti-GFP to detect Hmg2 and anti-HA to detect Dfm1-HA. As negative control, cells not expressing Hmg2-GFP were used. Sec61 was analyzed as another negative control for nonspecific binding using anti-Sec61 (3 biological replicates, N = 3). (D) Graphic depicting integrated model of Dfm1’s function in misfolded membrane protein stress. Top: Misfolded membrane proteins in the absence of Dfm1 forming aggregates within the ER membrane. Bottom: Cells with WT Dfm1 or 5Ashp-Dfm1 promoting non-aggregated misfolded membrane proteins and preventing cellular toxicity. Data Information: All detergent solubility assays were performed with 3 biological replicates (N = 3). DDM, dodecyl maltoside; ER, endoplasmic reticulum; EV, empty vector.
Fig 4
Fig 4. Dfm1 specifically influences solubility of misfolded membrane proteins.
(A) Western blot of aggregated versus non-aggregated membrane proteins at the ER. Lysates from WT, hrd1Δ, or hrd1Δ+HRD1 cells containing HMG2-GFP were blotted using anti-GFP to detect Hmg2. T is total protein, P is pellet (ER aggregated) fraction, and S is soluble (ER non-aggregated) fraction. (B) Western blot of aggregated versus non-aggregated membrane proteins at the ER as in (A) except with dfm1Δ cells containing SEC61-GFP with add-back of EV, WT DFM1-HA, or DFM1-5Ashp-HA. Anti-GFP was used to detect SEC61-GFP. (C) Western blot of aggregated versus non-aggregated membrane proteins at the ER as in (A) except with dfm1Δ cells containing PDR5*-HA with add-back of WT DFM1-HA or EV. Anti-HA was used to detect PDR5*-HA. (D) Western blot of aggregated versus non-aggregated membrane proteins at the ER as in (A) except with dfm1Δ cells containing STE6*-GFP with add-back of WT DFM1-HA or EV. Anti-GFP was used to detect STE6*-GFP. (E) Western blot of aggregated versus non-aggregated membrane proteins at the ER as in (A) except with dfm1Δ cells containing CPY*-GFP with add-back of EV or WT DFM1-HA. Anti-GFP was used to detect CPY*-GFP. (F) Western blot of aggregated versus non-aggregated membrane proteins at the ER as in (A) except with dfm1Δ cells containing HMG2-GFP with add-back of EV, DERLIN-1-Myc, and DERLIN-2-Myc. Anti-Myc was used to detect DERLIN-1-Myc and DERLIN-2-Myc. Data information: All detergent solubility assays were performed with 3 biological replicates (N = 3). ER, endoplasmic reticulum; EV, empty vector.
Fig 5
Fig 5. Misfolded membrane protein stress in dfm1Δ cells does not activate the UPR.
(A) UPR activation for indicated strains with overexpression of a misfolded integral membrane protein. pdr5Δ cells containing GALpr-Hmg2-6Myc and 4xUPRE-GFP (a reporter that expresses GFP with activation of the UPR) were measured for GFP expression using flow cytometry every hour for 5 hours starting at the point of galactose induction and tunicamycin or equivalent volume of DMSO was added at the 1-hour time point. Figure depicts the GFP fluorescence in A.U. for indicated conditions 5 hours post-galactose addition. In figure legend, “Gal” indicates addition of 0.2% galactose to cultures and “Raf” indicates addition of 0.2% raffinose to culture, and “Tm” indicates presence (+) or absence (-) of 2 μg/mL tunicamycin. (B) Flow cytometry-based UPR activation assay as described in (A) except using dfm1Δ cells. (C, E, and G) Flow cytometry-based UPR activation assay as described in (A) except using cells containing GALpr-Ste6*-GFP, GALpr-CPY*-HA, or EV, respectively. (D, F, and H) Flow cytometry-based UPR activation assay as described in (B) except using cells containing GALpr-Ste6*-GFP, GALpr-CPY*-HA, or EV, respectively. Data information: All data are measured mean ± SEM; N = 3 biological replicates. The data underlying this figure can be found in Table A–H in S1 Data (Sheet 1). A.U., arbitrary unit; EV, empty vector; UPR, unfolded protein response.
Fig 6
Fig 6. Misfolded membrane protein toxicity results in proteasome impairment.
(A) WT, dfm1Δ, and rpn4Δ cells containing either GALpr-HMG2-GFP or EV were compared for growth by dilution assay. Each strain was spotted 5-fold dilutions on glucose or galactose-containing plates to drive Hmg2-GFP overexpression, and plates were incubated at 30°C. Three biological replicates and 2 technical replicates (N = 3). (B) PRE6-GFP levels as measured by flow cytometry at 0 versus 5 hours post-galactose induction in WT cells containing either EV, GALpr-CPY*-HA, or GALpr-HMG2-GFP. (C) Pre6-GFP levels as in (B) except in dfm1Δ cells. (D) Quantification of CFUs formed on appropriate selection plates from proteasome sensitivity inhibition assay. pdr5Δ cells containing SUS-GFP or EV in log phase were treated with 25 uM of proteasome inhibitor MG132 or equivalent volume of DMSO for 8 hours and samples were diluted 1:500 and 50 uL of each sample was plated. (E) Proteasome sensitivity assay as in (D) except using hrd1Δpdr5Δ cells. (F) Proteasome sensitivity assay as in (D) except using dfm1Δhrd1Δpdr5Δ cells. Data information: For (B) and (C), all data are mean ± SEM, with 7 biological replicates (N = 7). For (D), (E), and (F), all data are mean ± SEM, 3 biological replicates and 2 technical replicates (N = 3); statistical significance is displayed as two-tailed unpaired t test, *P < 0.05, ns, not significant. (G) Western blot of Pre6 in cytosol versus ER (top panel) and aggregated (pelleted) versus non-aggregated (soluble) Pre6 at the ER (bottom panel). Lysates from dfm1Δ, cells containing Pre6-GFP and HMG2-6Myc or EV were blotted using anti-GFP to detect Pre6. T is total protein, ER is endoplasmic reticulum protein fraction, C is cystolosic protein fraction, P is pellet (ER aggregated) fraction, and S is soluble (ER non-aggregated) fraction. The data underlying this figure can be found in Table I–K in S1 Data (Sheet 2). CFU, colony-forming unit; EV, empty vector.
Fig 7
Fig 7. Ubiquitin stress contributes to misfolded membrane protein toxicity.
(A) WT, dfm1Δ, dfm1Δhrd1Δ, and dfm1Δdoa10Δ cells containing either GALpr-Hmg2-GFP, GALpr-STE6*-GFP, or EV were compared for growth by dilution assay. Each strain was spotted 5-fold dilutions on glucose or galactose-containing plates to drive Hmg2-GFP overexpression, and plates were incubated at 30°C. (B) Indicated strains expressing either Hmg2-GFP or Ste6*-GFP were grown to log-phase, lysed, and microsomes were collected and immunoprecipitated with α-GFP conjugated to agarose beads. Samples were then subjected to SDS-PAGE and immunoblotted by α-Ubiquitin and α-GFP. Three biological replicates (N = 3). (C) Dilution assay as described in (A) except using WT and dfm1Δ cells containing either GALpr-Hmg2-GFP, GALpr-Hmg2-K6R-GFP, GALpr-Hmg2-K357R-GFP, GALpr-Hmg2- (K6R and K357R)-GFP, or EV. (D) WT and dfm1Δ cells containing either CUP1pr-Ub or EV and GALpr-HMG2-GFP or EV were compared for growth by dilution assay. Each strain was spotted 5-fold dilutions on glucose or galactose-containing plates to drive Hmg2-GFP overexpression, and plates were incubated at 30°C. Galactose plates containing 50 μM Cu2+ were used to allow expression of Ub driven by the CUP1 promoter. (E) Western blot of monomeric ubiquitin in WT, dfm1Δ, and hrd1Δ expressing HMG2-GFP. Anti-ubiquitin was used to blot for ubiquitin and anti-PGK1 was used to blot for PGK1 as a loading control. (F) Quantification of western blots from (E). Each strain was normalized to PGK1 and the monomeric ubiquitin quantification of WT+HMG2-GFP was used to normalize all strains. (G) Dilution assay as described in (A) dfm1Δ, ubp9Δ, ubp14Δ, and doa4Δ cells. (H) Dilution assay as described in (A) except using WT, dfm1Δ, and ubp6Δ cells containing either GALpr-HMG2-GFP or EV. (I) Western blot of aggregated versus soluble membrane proteins at the ER. Lysates from dfm1Δ cells containing HMG2-GFP or HMG2-K6R-GFP with EV or DFM1-HA were blotted using anti-GFP to detect Hmg2. T is total fraction, P is pellet (ER aggregated) fraction, and S is soluble (ER non-aggregated) fraction. Data information: All dilution growth assays were performed in 3 biological replicates and 2 technical replicates (N = 3). For (F), all data are mean ± SEM, 3 biological replicates (N = 3); statistical significance is displayed as two-tailed unpaired t test, *P < 0.05, ns, not significant. Detergent solubility assay in (H) was performed with 3 biological replicates (N = 3). The data underlying this figure can be found in Table L in S1 Data (Sheet 3). ER, endoplasmic reticulum; EV, empty vector.
Fig 8
Fig 8. Model for misfolded membrane protein-induced toxicity.
A model depicting how accumulation of ER-resident misfolded membrane proteins would induce growth toxicity. (1) No growth toxicity is observed when misfolded membrane proteins aggregate but are not ubiquitinated. (2) No growth toxicity is observed when misfolded membrane proteins are ubiquitinated, but not aggregated. (3) Growth toxicity is observed when misfolded membrane proteins are both ubiquitinated and aggregated. ER, endoplasmic reticulum.

Similar articles

Cited by

References

    1. Hampton RY. ER-associated degradation in protein quality control andcellular regulation. Curr Opin Cell Biol. 2002;14:476–482. doi: 10.1016/s0955-0674(02)00358-7 - DOI - PubMed
    1. Werner ED, Brodsky JL, McCracken AA. Proteasome-dependent endoplasmic reticulum-associated protein degradation: An unconventional route to a familiar fate. Proc Natl Acad Sci U S A. 1996; 93:13797–13801. doi: 10.1073/pnas.93.24.13797 - DOI - PMC - PubMed
    1. Nakatsukasa K, Brodsky JL, Kamura T. A stalled retrotranslocation complex reveals physical linkage between substrate recognition and proteasomal degradation during ER-associated degradation. doi: 10.1091/mbc.E12-12-0907 - DOI - PMC - PubMed
    1. Bhamidipati A, Denic V, Quan EM, Weissman JS. Exploration of the topological requirements of ERAD identifies Yos9p as a lectin sensor of misfolded glycoproteins in the ER lumen. Mol Cell. 2005;19:741–751. doi: 10.1016/j.molcel.2005.07.027 - DOI - PubMed
    1. Stanley AM, Carvalho P, Rapoport T. Recognition of an ERAD-L substrate analyzed by site-specific in vivo photocrosslinking. FEBS Lett. 2011;585:1281–1286. doi: 10.1016/j.febslet.2011.04.009 - DOI - PMC - PubMed

Publication types

MeSH terms

Substances