. 2023 Apr 14;29(8):1631-1642.
doi: 10.1158/1078-0432.CCR-22-2977.

Small-Molecule Polθ Inhibitors Provide Safe and Effective Tumor Radiosensitization in Preclinical Models

Affiliations

Small-Molecule Polθ Inhibitors Provide Safe and Effective Tumor Radiosensitization in Preclinical Models

Gonzalo Rodriguez-Berriguete et al. Clin Cancer Res. .

Abstract

Purpose: DNA polymerase theta (Polθ, encoded by the POLQ gene) is a DNA repair enzyme critical for microhomology mediated end joining (MMEJ). Polθ has limited expression in normal tissues but is frequently overexpressed in cancer cells and, therefore, represents an ideal target for tumor-specific radiosensitization. In this study we evaluate whether targeting Polθ with novel small-molecule inhibitors is a feasible strategy to improve the efficacy of radiotherapy.

Experimental design: We characterized the response to Polθ inhibition in combination with ionizing radiation in different cancer cell models in vitro and in vivo.

Results: Here, we show that ART558 and ART899, two novel and specific allosteric inhibitors of the Polθ DNA polymerase domain, potently radiosensitize tumor cells, particularly when combined with fractionated radiation. Importantly, noncancerous cells were not radiosensitized by Polθ inhibition. Mechanistically, we show that the radiosensitization caused by Polθ inhibition is most effective in replicating cells and is due to impaired DNA damage repair. We also show that radiosensitization is still effective under hypoxia, suggesting that these inhibitors may help overcome hypoxia-induced radioresistance. In addition, we describe for the first time ART899 and characterize it as a potent and specific Polθ inhibitor with improved metabolic stability. In vivo, the combination of Polθ inhibition using ART899 with fractionated radiation is well tolerated and results in a significant reduction in tumor growth compared with radiation alone.

Conclusions: These results pave the way for future clinical trials of Polθ inhibitors in combination with radiotherapy.


Figures

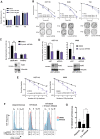
Figure 1. The Polθ inhibitor ART558 radiosensitizes tumor cells. A and B, Clonogenic survival of HCT116, H460, and T24 cells treated with ART558 and/or IR. A, Plating efficiency for unirradiated cells. B, Surviving fractions as a function of the irradiation dose. Representative wells for 0 Gy and 6 Gy ± 1 μmol/L ART558 are shown for each cell line. C, Clonogenic survival of U2OS WT and Polθ KO cells treated with 3 μmol/L ART558 and 6 Gy IR. Bar graphs show the surviving fraction at 6 Gy. The Western blot insets confirm the lack of Polθ expression in the U2OS Polθ KO cells. D, Clonogenic survival of HCT116 and H460 cells transfected with either a control, nontargeting siRNA (siNT) or an siRNA targeted against POLQ (siPOLQ) and treated with 3 μmol/L ART558 and 6 Gy IR. Bar graphs show the surviving fraction at 6 Gy. Western blots show Polθ expression at the time of irradiation. E, Clonogenic survival of H460 and HCT116 treated with 3 μmol/L ART558 and 2×5 Gy (2 Gy once per day for 1 to 5 days). F and G, Clonogenic survival following irradiation and treatment with 3 μmol/L ART558 of synchronized HeLa cells. F, Representative histograms showing the cell-cycle distribution at the time of IR (synchronized in G1 by DT block or after 6 hours release from DT block, compared with asynchronous cultures). G, Degree of radiosensitization estimated by the ratio between the surviving fraction of DMSO- and ART558-treated cells after IR (SF DMSO/SF ART558). Data correspond to average ± SD from three independent experiments (*, P < 0.05; **, P < 0.01; ***, P < 0.001; ****, P < 0.0001).
Figure 1.
The Polθ inhibitor ART558 radiosensitizes tumor cells. A and B, Clonogenic survival of HCT116, H460, and T24 cells treated with ART558 and/or IR. A, Plating efficiency for unirradiated cells. B, Surviving fractions as a function of the irradiation dose. Representative wells for 0 Gy and 6 Gy ± 1 μmol/L ART558 are shown for each cell line. C, Clonogenic survival of U2OS WT and Polθ KO cells treated with 3 μmol/L ART558 and 6 Gy IR. Bar graphs show the surviving fraction at 6 Gy. The Western blot insets confirm the lack of Polθ expression in the U2OS Polθ KO cells. D, Clonogenic survival of HCT116 and H460 cells transfected with either a control, nontargeting siRNA (siNT) or an siRNA targeted against POLQ (siPOLQ) and treated with 3 μmol/L ART558 and 6 Gy IR. Bar graphs show the surviving fraction at 6 Gy. Western blots show Polθ expression at the time of irradiation. E, Clonogenic survival of H460 and HCT116 treated with 3 μmol/L ART558 and 5×2 Gy (2 Gy once per day for 1 to 5 days). F and G, Clonogenic survival following irradiation and treatment with 3 μmol/L ART558 of synchronized HeLa cells. F, Representative histograms showing the cell-cycle distribution at the time of IR (synchronized in G1 by DT block or after 6 hours release from DT block, compared with asynchronous cultures). G, Degree of radiosensitization estimated by the ratio between the surviving fraction of DMSO- and ART558-treated cells after IR (SF DMSO / SF ART558). Data correspond to average ± SD from three independent experiments (*, P < 0.05; **, P < 0.01; ***, P < 0.001; ****, P < 0.0001).
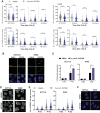
Figure 2. ART558 treatment leads to increased residual IR-induced DNA damage foci. A, γH2AX and 53BP1 foci in HCT116 and H460 cells treated with 3 μmol/L ART558 and 4 Gy IR, assessed at the indicated times points after IR. B, Representative images from irradiated cells from the experiment described in A, at 16 hours after IR. C, Micronuclei in HCT116 and H460 cells treated with 3 μmol/L ART558 and 4 Gy IR, assessed 48 hours after IR. Data points indicate the mean ± SD from triplicate wells and graphs are representative from three separate experiments. D, Representative images from irradiated cells from the experiment described in C. Micronuclei are indicated with arrow heads. E, RAD51 foci in HCT116 and H460 cells treated with 3 μmol/L ART558 and 4 Gy IR, assessed 6 hours after IR. F, Representative images from irradiated cells from the experiment described in E. Lines and error bars in A and E correspond to average ± SD representative from three independent experiments, and statistical significance was calculated using nonparametric one-way ANOVA (Kruskal–Wallis) with Dunn correction for multiple comparisons (*, P < 0.05; **, P < 0.01; ***, P < 0.001; ****, P < 0.0001).
Figure 2.
ART558 treatment leads to increased residual IR-induced DNA damage foci. A, γH2AX and 53BP1 foci in HCT116 and H460 cells treated with 3 μmol/L ART558 and 4 Gy IR, assessed at the indicated times points after IR. B, Representative images from irradiated cells from the experiment described in A, at 16 hours after IR. C, Micronuclei in HCT116 and H460 cells treated with 3 μmol/L ART558 and 4 Gy IR, assessed 48 hours after IR. Data points indicate the mean ± SD from triplicate wells and graphs are representative from three separate experiments. D, Representative images from irradiated cells from the experiment described in C. Micronuclei are indicated with arrow heads. dsDNA, double-stranded DNA. E, RAD51 foci in HCT116 and H460 cells treated with 3 μmol/L ART558 and 4 Gy IR, assessed 6 hours after IR. F, Representative images from irradiated cells from the experiment described in E. Lines and error bars in A and E correspond to average ± SD representative from three independent experiments, and statistical significance was calculated using nonparametric one-way ANOVA (Kruskal–Wallis) with Dunn correction for multiple comparisons (*, P < 0.05; **, P < 0.01; ***, P < 0.001; ****, P < 0.0001).
Figure 3. ART558-mediated radiosensitization under hypoxic conditions. A, Clonogenic survival of H460 cells irradiated upon hypoxia (0.5% and <0.1% oxygen). For OERs, see Supplementary Fig. S4. The 6 Gy data points are replotted in a bar graph in B to allow better visual comparison between the different treatment arms (*, P < 0.05; **, P < 0.01; ***, P < 0.001; ****, P < 0.0001).
Figure 3.
ART558-mediated radiosensitization under hypoxic conditions. A, Clonogenic survival of H460 cells irradiated upon hypoxia (0.5% and <0.1% oxygen). For OERs, see Supplementary Fig. S4. The 6 Gy data points are replotted in a bar graph in B to allow better visual comparison between the different treatment arms (*, P < 0.05; **, P < 0.01; ***, P < 0.001; ****, P < 0.0001).
Figure 4. Characterization of ART899 as a specific and potent Polθ inhibitor with improved stability. A, Chemical structures of the Polθ inhibitors ART558 and ART899. The table shows the in vitro intrinsic clearance values of ART558 and ART899 after exposure to rat and mouse liver microsomes. B, Nano-luciferase MMEJ assay showing ART899-mediated inhibition of MMEJ activity in HEK-293 cells. The nano-luciferase readings were normalized to control luciferase (firefly) readings, and these were then normalized to DMSO. Data points show the mean ± SEM of four technical replicates; representative of two independent experiments. C, Confirmation of MMEJ assay specificity. Same experiment described in B but showing both the nanoluc and firefly readings normalized to their own DMSO reading, confirming negligible inhibition by ART899 of the control firefly luciferase signal. D, Clonogenic survival of HCT116 and H460 cells treated with ART899. Graphs show the surviving fraction after 5 × 2 Gy IR. E, Confirmation of ART899 specificity in U2OS WT and Polθ KO cells. Cells were treated as described in D. F, Effect of ART899 in noncancerous cells. MRC-5 and AG01552 fibroblasts were treated as described in D. The effect of ART899 in unirradiated cells from D to F is shown in Supplementary Fig. S5A. Graphs shown in D to F correspond to average ± SD from triplicate wells (representative from three separate experiments; *, P < 0.05; **, P < 0.01; ***, P < 0.001; ****, P < 0.0001). G, Viability of HIEC-6 cells treated with ART899 and irradiated with 2×5 Gy, as determined by the alamar blue assay 8 days after the first IR fraction. Graph shows the viability normalized to unirradiated controls (Supplementary Fig. S5C); representative from three independent experiments.
Figure 4.
Characterization of ART899 as a specific and potent Polθ inhibitor with improved stability. A, Chemical structures of the Polθ inhibitors ART558 and ART899. The table shows the in vitro intrinsic clearance values of ART558 and ART899 after exposure to rat and mouse liver microsomes. B, Nano-luciferase MMEJ assay showing ART899-mediated inhibition of MMEJ activity in HEK-293 cells. The nano-luciferase readings were normalized to control luciferase (firefly) readings, and these were then normalized to DMSO. Data points show the mean ± SEM of four technical replicates; representative of two independent experiments. C, Confirmation of MMEJ assay specificity. Same experiment described in B but showing both the nanoluc and firefly readings normalized to their own DMSO reading, confirming negligible inhibition by ART899 of the control firefly luciferase signal. D, Clonogenic survival of HCT116 and H460 cells treated with ART899. Graphs show the surviving fraction after 5 × 2 Gy IR. E, Confirmation of ART899 specificity in U2OS WT and Polθ KO cells. Cells were treated as described in D. F, Effect of ART899 in noncancerous cells. MRC-5 and AG01552 fibroblasts were treated as described in D. The effect of ART899 in unirradiated cells from D to F is shown in Supplementary Fig. S5A. Graphs shown in D to F correspond to average ± SD from triplicate wells (representative from three separate experiments; *, P < 0.05; **, P < 0.01; ***, P < 0.001; ****, P < 0.0001). G, Viability of HIEC-6 cells treated with ART899 and irradiated with 5 × 2 Gy, as determined by the alamar blue assay 8 days after the first IR fraction. Graph shows the viability normalized to unirradiated controls (Supplementary Fig. S5C); representative from three independent experiments.
Figure 5. Polθ inhibitor ART899 combined with radiation causes significant tumor growth delay in vivo and is well tolerated. A, ART899 plasma concentration following oral dosage of ART899 at 50 or 150 mg/kg. Mouse plasma samples (n = 3 per treatment group) were collected at 30 minutes, 1, 2, 4, 8, and 12 hours after last dose. B–E, HCT116 tumor-bearing mice treated with 150 mg/kg Polθ inhibitor ART899 BID for 12 days and/or 10 × 2 Gy (days 1–5 and 8–12). Vehicle (n = 9); ART899 (n = 10); 10 × 2 Gy + vehicle (n = 10); 10 × 2 Gy + ART899 (n = 10). B, Mean ± SEM relative tumor size. P value from mixed effect model and Dunnett posttest. Comparison of tumor size at the latest common timepoint for 10 × 2 Gy versus 10 × 2 Gy + ART899 are shown in Supplementary Fig. S6A. C, Individual mouse graphs. D, Kaplan–Meier plot for a tumor size threshold of 1,000 mm3. HR: Hazard ratio (hazard rate of IR arm/hazard rate of IR + ART899 arm); P value from the log-rank (Mantel-Cox) test comparing IR alone and IR+ART558. The median time to a tumor size of 1,000 mm3 for the IR + ART899 arm versus the IR arm and the corresponding ratio are shown in Supplementary Fig. S6B. E, Average mouse weight ± SD from all treatment groups over time. Individual mouse weights are shown in Supplementary Fig. S6C.
Figure 5.
Polθ inhibitor ART899 combined with radiation causes significant tumor growth delay in vivo and is well tolerated. A, ART899 plasma concentration following oral dosage of ART899 at 50 or 150 mg/kg. Mouse plasma samples (n = 3 per treatment group) were collected at 30 minutes, 1, 2, 4, 8, and 12 hours after last dose. B–E, HCT116 tumor-bearing mice treated with 150 mg/kg Polθ inhibitor ART899 twice daily for 12 days and/or 10 × 2 Gy (days 1–5 and 8–12). Vehicle (n = 9); ART899 (n = 10); 10 × 2 Gy + vehicle (n = 10); 10 × 2 Gy + ART899 (n = 10). B, Mean ± SEM relative tumor size. P value from mixed effect model and Dunnett post-test. Comparison of tumor size at the latest common timepoint for 10 × 2 Gy versus 10 × 2 Gy + ART899 are shown in Supplementary Fig. S6A. C, Individual mouse graphs. D, Kaplan–Meier plot for a tumor size threshold of 1,000 mm3. HR: Hazard ratio (hazard rate of IR arm / hazard rate of IR + ART899 arm); P value from the log-rank (Mantel-Cox) test comparing IR alone and IR + ART558. The median time to a tumor size of 1,000 mm3 for the IR + ART899 arm versus the IR arm and the corresponding ratio are shown in Supplementary Fig. S6B. E, Average mouse weight ± SD from all treatment groups over time. Individual mouse weights are shown in Supplementary Fig. S6C.

References

    1. Wilkinson E. New technical guidance to boost global radiotherapy access. Lancet Oncol 2021;22:589–90. - PubMed
    1. Hanna TP, Shafiq J, Delaney GP, Vinod SK, Thompson SR, Barton MB. The population benefit of evidence-based radiotherapy: 5-year local control and overall survival benefits. Radiother Oncol 2018;126:191–7. - PubMed
    1. Higgins GS, O'Cathail SM, Muschel RJ, McKenna WG. Drug radiotherapy combinations: review of previous failures and reasons for future optimism. Cancer Treat Rev 2015;41:105–13. - PubMed
    1. Kawamura K, Bahar R, Seimiya M, Chiyo M, Wada A, Okada S, et al. . DNA polymerase theta is preferentially expressed in lymphoid tissues and upregulated in human cancers. Int J Cancer 2004;109:9–16. - PubMed
    1. Higgins GS, Harris AL, Prevo R, Helleday T, McKenna WG, Buffa FM. Overexpression of POLQ confers a poor prognosis in early breast cancer patients. Oncotarget 2010;1:175–84. - PMC - PubMed

Publication types