. 2023 Jan 1;39(1):btad022.
doi: 10.1093/bioinformatics/btad022.

PANACEA: network-based methods for pharmacotherapy prioritization in personalized oncology

Affiliations

PANACEA: network-based methods for pharmacotherapy prioritization in personalized oncology

Ege Ulgen et al. Bioinformatics. .

Abstract

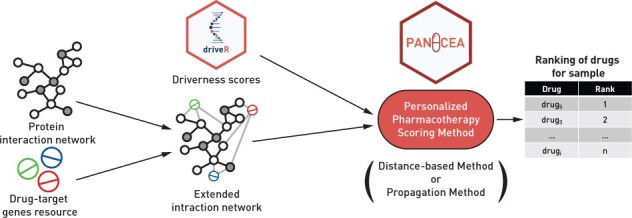
Motivation: Identifying appropriate pharmacotherapy options from genomics results is a significant challenge in personalized oncology. However, computational methods for prioritizing drugs are underdeveloped. With the hypothesis that network-based approaches can improve the performance by extending the use of potential drug targets beyond direct interactions, we devised two network-based methods for personalized pharmacotherapy prioritization in cancer.

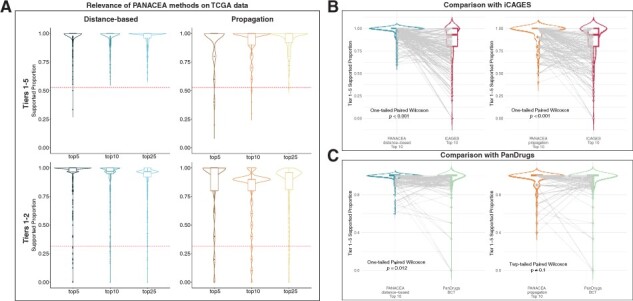
Results: We developed novel personalized drug prioritization approaches, PANACEA: PersonAlized Network-based Anti-Cancer therapy EvaluAtion. In PANACEA, initially, the protein interaction network is extended with drugs, and a driverness score is assigned to each altered gene. For scoring drugs, either (i) the 'distance-based' method, incorporating the shortest distance between drugs and altered genes, and driverness scores, or (ii) the 'propagation' method involving the propagation of driverness scores via a random walk with restart framework is performed. We evaluated PANACEA using multiple datasets, and demonstrated that (i) the top-ranking drugs are relevant for cancer pharmacotherapy using TCGA data; (ii) drugs that cancer cell lines are sensitive to are identified using GDSC data; and (iii) PANACEA can perform adequately in the clinical setting using cases with known drug responses. We also illustrate that the proposed methods outperform iCAGES and PanDrugs, two previous personalized drug prioritization approaches.

Availability and implementation: The corresponding R package is available on GitHub. (https://github.com/egeulgen/PANACEA.git).

Supplementary information: Supplementary data are available at Bioinformatics online.


Figures

Fig. 1.
Fig. 1.
Overview of the personalized pharmacotherapy scoring methods
Fig. 2.
Fig. 2.
Heatmaps of proportions of selected (Top 5) drugs in each tier for each method (THCA-US data, STRING PIN). For each heatmap, rows are for samples, and columns are for drug tiers. Right-hand row-side stacked bar plot displays the proportion of selected drugs in each tier per sample. Top box plots show the distributions of proportions of selected drugs per tier. The legend for drug tiers is provided on the top right. There were no genes with driveR score >0.05 for 12 samples, separately displayed in the dendrogram for the distance-based method
Fig. 3.
Fig. 3.
Assessment of relevance of selected drugs. (A) Violin and boxplots, displaying the distribution of proportions of supported (either Tiers 1–5 or Tiers 1–2) selected drugs per drug prioritization method (THCA-US data). Dashed red lines indicate the overall/expected proportion of Tier 1–5 and Tier 1–2 drugs in DGIdb. (B) Comparison of selected drugs between PANACEA methods—Top 10 and iCAGES—Top 10. (C) Comparison of selected drugs between PANACEA methods Top 10 and PanDrugs—best candidate therapy
Fig. 4.
Fig. 4.
Performance on GDSC cell line drug–response data. (A) Comparison of drug response (as measured by AUC) between PANACEA methods and naïve methods (directly targeting and directly or adjacent targeting). (B) Comparison of drug response (as measured by AUC) between PANACEA methods—top drug and iCAGES—top drug. (C) Comparison of drug response (as measured by AUC) between PANACEA methods—top drug and PanDrugs—top drug

References

    1. Barretina J. et al. (2012) The Cancer Cell Line Encyclopedia enables predictive modelling of anticancer drug sensitivity. Nature, 483, 603–607. - PMC - PubMed
    1. Davis A.P. et al. (2021) Comparative Toxicogenomics Database (CTD): update 2021. Nucleic Acids Res., 49, D1138–D1143. - PMC - PubMed
    1. Di J. et al. (2019) Prioritization of candidate cancer drugs based on a drug functional similarity network constructed by integrating pathway activities and drug activities. Mol. Oncol., 13, 2259–2277. - PMC - PubMed
    1. Dong C. et al. (2016) iCAGES: integrated CAncer GEnome Score for comprehensively prioritizing driver genes in personal cancer genomes. Genome Med., 8, 135. - PMC - PubMed
    1. Freshour S.L. et al. (2021) Integration of the Drug–Gene Interaction Database (DGIdb 4.0) with open crowdsource efforts. Nucleic Acids Res., 49, D1144–D1151. - PMC - PubMed

Publication types