. 2023 Jan 23;21(1):e3001978.
doi: 10.1371/journal.pbio.3001978. eCollection 2023 Jan.

A dynamic interplay between chitin synthase and the proteins Expansion/Rebuf reveals that chitin polymerisation and translocation are uncoupled in Drosophila

Affiliations

A dynamic interplay between chitin synthase and the proteins Expansion/Rebuf reveals that chitin polymerisation and translocation are uncoupled in Drosophila

Ettore De Giorgio et al. PLoS Biol. .

Abstract

Chitin is a highly abundant polymer in nature and a principal component of apical extracellular matrices in insects. In addition, chitin has proved to be an excellent biomaterial with multiple applications. In spite of its importance, the molecular mechanisms of chitin biosynthesis and chitin structural diversity are not fully elucidated yet. To investigate these issues, we use Drosophila as a model. We previously showed that chitin deposition in ectodermal tissues requires the concomitant activities of the chitin synthase enzyme Kkv and the functionally interchangeable proteins Exp and Reb. Exp/Reb are conserved proteins, but their mechanism of activity during chitin deposition has not been elucidated yet. Here, we carry out a cellular and molecular analysis of chitin deposition, and we show that chitin polymerisation and chitin translocation to the extracellular space are uncoupled. We find that Kkv activity in chitin translocation, but not in polymerisation, requires the activity of Exp/Reb, and in particular of its conserved Nα-MH2 domain. The activity of Kkv in chitin polymerisation and translocation correlate with Kkv subcellular localisation, and in absence of Kkv-mediated extracellular chitin deposition, chitin accumulates intracellularly as membrane-less punctae. Unexpectedly, we find that although Kkv and Exp/Reb display largely complementary patterns at the apical domain, Exp/Reb activity nonetheless regulates the topological distribution of Kkv at the apical membrane. We propose a model in which Exp/Reb regulate the organisation of Kkv complexes at the apical membrane, which, in turn, regulates the function of Kkv in extracellular chitin translocation.


Conflict of interest statement

The authors have declared that no competing interests exist.

Figures
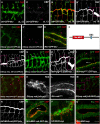
Fig 1
Fig 1. Analysis of the role of the Nα-MH2 domain of Exp/Reb.
All images show projections of confocal sections, except D, I, L, O, and Q, which show single confocal sections. (A, B) The overexpression of GFP-kkv in the trachea leads to the presence of intracellular chitin vesicles at early stages (pink arrowheads) (A, A’). At later stages, intracellular chitin vesicles are not present, and chitin is deposited extracellularly in the lumen (blue arrowheads and inset) (B, B’). (C, C’) In exp reb mutants, the overexpression of GFP-kkv in the trachea produces intracellular chitin punctae until late stages (pink arrowheads). (D) The overexpression of GFP-kkv in salivary glands produces intracellular chitin vesicles (pink arrowheads). (E) Schematic representation of Exp protein. (F, G) In exp reb mutants, the expression of a wild-type form of exp/reb rescues the lack of extracellular chitin deposition (F, white arrow and inset), while expΔMH2/rebΔMH2 do not (G, white arrow points to absence of CBP). (H, I) The co-overexpression of GFP-kkv and expΔMH2 in control embryo does not produce morphogenetic defects in trachea (H) or extracellular chitin deposition in salivary glands (white arrow) (I); however, intracellular chitin punctae are present (pink arrowheads in H, I, and inset in H). (J) The coexpression of GFP-kkv and expΔMH2 in exp reb mutants produces intracellular chitin particles (pink arrowheads) but does not rescue the lack of extracellular chitin deposition. (K, L) RebΔMH2 localises apically in trachea (K) and in salivary glands (L). (M) MH2-reb is not able to rescue the absence of extracellular chitin deposition in exp reb mutants. (N, O) The simultaneous expression of MH2-reb and GFP-kkv does not produce morphogenetic defects or ectopic chitin deposition in trachea (N) and in salivary glands (white arrow in O), but intracellular chitin vesicles are present (pink arrowhead in O). (P, Q) MH2-Exp protein does not localize apically in trachea (P) or in salivary gland (Q). Scale bars A-C, F-H, J, M, N: 25 μm; D, I, K, L, O-Q: 10 μm.
Fig 2
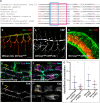
Fig 2. Analysis of the role of the CM2 domain of Exp/Reb.
(A) Alignment of amino acids (aa) sequences of the isoform B of Exp (aa 356–433) and homologs; the blue square indicates 8 aa highly conserved, the red square includes 9 aa less conserved. (B-D) Show projections of confocal sections and (E-F) show single confocal sections. (B) The overexpression of expΔCM2 in an exp reb mutant background rescues the lack of extracellular chitin deposition. (C, D) The simultaneous expression of expΔCM2 and GFP-kkv produces morphogenetic defects in the trachea (arrowheads in C) and ectopic chitin deposition in the lumen of salivary glands (D). (E, F) Overexpressed Exp localises mainly in the apical region (orange arrowheads) with respect the basal domain (yellow arrowheads), while the apical accumulation of overexpressed ExpΔCM2 is less conspicuous (F). (G) Quantifications of accumulation of Exp and ExpΔCM2 in apical versus basal region. n corresponds to the number of ratios analysed (apical/basal ratio per cell), and brackets indicate the number of embryos used. Ratios were obtained from the apical (orange line in E) and basal (yellow line in E) domains of single cells in trachea and salivary glands. The underlying data for quantifications can be found in the S1 Data. Scale bars B, C: 25 μm; D-F: 10 μm.
Fig 3
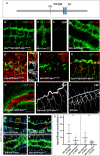
Fig 3. Analysis of the WGTRE and CC domains of Kkv.
(A) Schematic representation of Kkv protein (CD, catalytic domain; WGTRE; CC, coiled-coil domain). (B, C, G, I, J) Show projections of confocal sections and (D-F, H, K-N) show single confocal sections. (B) The overexpression of GFP-kkvΔWGTRE in a kkv mutant background does not rescue the absence of extracellular chitin deposition (white arrow, note the absence of CBP) and the protein accumulates in a generalised pattern. (C-D) The overexpression of GFP-KkvΔWGTRE does not produce intracellular chitin punctae, neither in trachea at early stages (C-C’) nor in salivary glands (D). (E-E”‘) GFP-kkvΔWGTRE colocalise with the ER marker KDEL. (F) GFP-KkvΔWGTRE does not colocalise with the marker FK2. (G) The overexpression of GFP-kkvΔCC in a kkv mutant background rescues the lack of extracellular chitin deposition in the trachea (note the presence of CBP staining). (H, I) The simultaneous expression of reb and GFP-kkvΔCC in salivary glands produces ectopic extracellular chitin (H), and no defects in trachea (I). (J) The overexpression of reb in trachea leads to morphogenetic defects. (K, L) Overexpressed GFP-Kkv localises mainly apically (orange arrowheads) although a bit of the protein can be detected in the basal region (yellow arrowheads). (M, N) Apical accumulation of overexpressed GFP-KkvΔCC is less conspicuous. (O) Quantifications of accumulation of GFP-Kkv and GFP-KkvΔCC in apical versus basal region. n corresponds to the number of ratios analysed (apical/basal ratio per cell), and brackets indicate the number of embryos used. Ratios were obtained from the apical (orange line in K) and basal (yellow line in K) domains of single cells in trachea and salivary glands. The underlying data for quantifications can be found in the S1 Data. Scale bars B, C, G, I, J: 25 μm; D-F, H, K-N: 10 μm.
Fig 4
Fig 4. Analysis of intracellular chitin deposition.
All images show salivary glands. (A, C, E-L, N, O) Show single confocal sections and (B, D, M) show projections of several sections. (A-A’) The concomitant expression of reb and GFP-kkv leads to luminal chitin deposition (blue arrow in orthogonal section in A’). (B, C) Coexpression of expΔMH2 and GFP-kkv produces intracellular chitin punctae, some of which partially colocalise with GFP-Kkv vesicles (yellow arrowhead) while others do not (red arrowhead). GFP-Kkv vesicles without chitin are also observed (green arrowhead). Note the accumulation of chitin in the apical domain (white arrow in C) that is not deposited extracellularly in the lumen (blue arrow in orthogonal section in C’). (D) In Rab5DN background, intracellular chitin punctae are still present (white arrowheads). (E-L) Analysis of the nature of GFP-Kkv vesicles and chitin punctae using markers Golgin245 (E-F), Hrs 27–4 (G-H), Arl8 (I-J), and Rab11 (K-L); arrowheads indicate colocalisation between Kkv and each specific marker. (M, N) All GFP-Kkv vesicles colocalise with the membrane marker CD4-mIFP (white arrowheads), and few of them also with chitin (orange arrowheads); single chitin punctae do not colocalise with CD4-mIFP (red arrowheads). (O-O”) Frames from live imaging movie show that partially colocalising GFP-Kkv and chitin punctae (yellow arrow) can separate from each other; however, many GFP-Kkv (green arrow) and chitin puncta (red arrow) do not colocalise. Scale bars A-D, M: 10 μm; E-L, N-N”‘: 1 μm; O-O”: 5 μm.
Fig 5
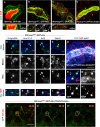
Fig 5. Analysis of Kkv trafficking.
All images are single confocal sections except A-C, which are projections of confocal sections. (A, A’) In trachea of wild-type embryos, Kkv is present in the apical region (blue arrows) and in intracellular vesicles (yellow arrowheads). (B) In kkv mutants unable to polymerise chitin, Kkv is not properly localised. (C) GFP-Kkv localises to the apical region (blue arrows) and in intracellular vesicles (yellow arrowheads). (D) When reb and GFP-kkv are coexpressed in salivary glands, Kkv is present in the apical membrane (blue arrow), in intracellular vesicles (yellow arrowhead), and also in punctae in the lumen (pink arrowheads). This is clearly observed in orthogonal sections (D’). (E) These luminal punctae corresponded to membranous structures. (F, F’) In contrast, when GFP-kkv is expressed alone, luminal punctae are absent, and Kkv is only found apically (blue arrow) and in intracellular vesicles (yellow arrowhead). (G) Luminal punctae (pink arrowheads) are also observed in the trachea of embryos overexpressing reb and GFP-kkv. (H) When endocytosis is prevented, the coexpression of reb and GFP-kkv in salivary glands still leads to formation of Kkv luminal punctae (pink arrowheads). (I) Quantifications of the number of intracellular Kkv vesicles in salivary glands when expressing GFP-kkv (I’), reb and GFP-kkv (I”), and GFP-kkvΔCC. n is the number of salivary glands analysed. The underlying data for quantifications can be found in the S1 Data. Scale bars: 10 μm.
Fig 6
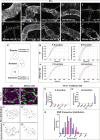
Fig 6. Analysis of Kkv apical distribution.
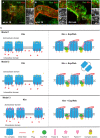
All images are projections of confocal sections, of super-resolution microscopy. (A, B) Kkv localises apically in the trachea of wild-type embryos (A) and in absence of exp reb (B). (C, D) The localisation of Kkv is apical also in presence of exp ΔMH2 in trachea (C) and in presence of MH2-exp in salivary glands (D). (E, F) At stage 14, in wild-type embryos (E) and in embryos deficient for exp and reb (F), Kkv is present in the apical membrane and in many intracellular vesicles (yellow arrowheads). (G) At stage 16, in wild-type embryo, Kkv apical distribution follows the pattern of taenidial folds and intracellular vesicles are mostly absent. (H) At stage 16, in exp reb mutant embryos, Kkv is apical but shows altered distribution pattern. (I, J) At stage 15, in control embryos, Kkv pattern is apical and covers the whole membrane leaving minimal spatial gaps (I); instead, in exp reb mutant embryos, Kkv distribution changes to a less organised pattern at the apical membrane (J). (K) Three different types of spatial distribution within a selected area. The positions of the defined objects can be random and exhibit characteristics of attraction (clustered pattern) or repulsion (regular pattern). The F-Function tends to be larger (≈1) for clustered patterns and smaller (≈0) for regular. The G-Function tends to be smaller (≈0) for clustered and larger (≈1) for regular patterns. (L) Kkv punctae (magenta) on the apical cell area marked by Armadillo (green) in the trachea of a control embryo. (L’) Positions of Kkv punctae on the selected area marked by black dots. (L”) Random pattern of distribution for the same area created by the spatial statistics 2D/3D image analysis plugin. (M) The corresponding observed F and G functions (blue) are displayed above and below the reference simulated random distributions (black) and the 95% confidence interval (light gray), respectively, indicating a nonrandom spatial pattern. (N) SDI histogram for the F-Function of the control (blue) and the Df(exp reb) samples. A significant difference between the frequency distributions for each group of individuals has been observed. (Kolmogorov–Smirnov D = 0.5833, p < 0.05) (N’) SDI histogram for the G-Function of the control (blue) and the Df(exp reb) samples. Statistical analysis of the distributions did not reveal significant differences between the two groups of individuals for this parameter (Kolmogorov–Smirnov D = 0.25, p > 0.05). (O) Kkv punctae (magenta) on the apical cell area marked by Armadillo (green) in the trachea of a exp reb mutant embryo. (O’) Positions of Kkv punctae on the selected area marked by black dots. (O”) Random pattern of distribution for the same area created by the spatial statistics 2D/3D image analysis plugin. (P) The corresponding observed F and G functions (blue) are displayed above and below the reference simulated random distributions (black), respectively. Both curves largely overlap with the 95% confidence interval (light gray), indicating a tendency towards a random spatial pattern. (Q) Frequency distribution histograms for the nearest neighbour distances between Kkv punctae in control (blue) and exp reb mutant samples. The distribution of values between the two groups is found significantly different (Kolmogorov–Smirnov D = 0.2036, p < 0.005). The underlying data for quantifications can be found in the S1 Data. Scale bars A-J: 10 μm; L, O: 2 μm.
Fig 7
Fig 7. Accumulation of Kkv and Reb.
All images are super-resolution single confocal sections except B, which is a projection of super-resolution confocal sections. (A, B) In the trachea of wild-type embryos, Reb and Kkv do not colocalise, and they show a complementary pattern (A’-A”’) at the local subcellular level. (C) In salivary gland of embryos expressing Reb, the patterns of Kkv and Reb are complementary. (D) Models for the role of kkv and exp/reb in chitin deposition. Kkv oligomerises in complexes that localise to the apical membrane (as proposed in [2]). In the absence of exp/reb activity, Kkv can polymerise chitin from sugar monomers (discontinuous red lines), but it cannot translocate it because the channel is closed, and polymerised chitin remains in the cytoplasm. In addition, Kkv is not homogeneously distributed. Exp/Reb form a complex with other proteins, which localises to the apical membrane. The presence of Exp/Reb complex regulates Kkv apical distribution and activity. In model 1, we propose that a factor/s recruited by Exp/Reb (Factor X) can induce a posttranslation or conformational modification to Kkv protein that opens the channel promoting translocation of chitin fibers to the extracellular domain. In model 2, we propose that a factor/s recruited by Exp/Reb (Factor X’) can induce changes in membrane composition/curvature that will then promote a conformational change in Kkv that opens the channel to translocate chitin. These membrane changes lead to Kkv shedding extracellularly. In model 3, we propose that Exp/Reb complex can bind and relocalise Factor X”, which normally inhibits Kkv-translocating activity. This neutralises the activity of Factor X” allowing chitin translocation. Scale bars: 5 μm.

Similar articles

Cited by

References

    1. Zhao X, Zhang J, Zhu KY. Chito-Protein Matrices in Arthropod Exoskeletons and Peritrophic Matrices. In: Cohen E, Merzendorfer H. editors. Extracellular Sugar-Based Biopolymers Matrices Biologically-Inspired Systems. 12. Cham: Springer; 2019.
    1. Zhu KY, Merzendorfer H, Zhang W, Zhang J, Muthukrishnan S. Biosynthesis, Turnover, and Functions of Chitin in Insects. Annu Rev Entomol. 2016;61:177–196. doi: 10.1146/annurev-ento-010715-023933 . - DOI - PubMed
    1. Behr M, Ganesan K. Improving Polysaccharide-Based Chitin/Chitosan-Aerogel Materials by Learning from Genetics and Molecular Biology. Materials. 2022;15(3). doi: 10.3390/ma15031041 ; PubMed Central PMCID: PMC8839503. - DOI - PMC - PubMed
    1. Casadidio C, Peregrina DV, Gigliobianco MR, Deng S, Censi R, Di Martino P. Chitin and Chitosans: Characteristics, Eco-Friendly Processes, and Applications in Cosmetic Science. Mar Drugs. 2019;17(6). doi: 10.3390/md17060369 ; PubMed Central PMCID: PMC6627199. - DOI - PMC - PubMed
    1. Elieh-Ali-Komi D, Hamblin MR. Chitin and Chitosan: Production and Application of Versatile Biomedical Nanomaterials. Int J Adv Res. 2016;4(3):411–427. ; PubMed Central PMCID: PMC5094803. - PMC - PubMed

Publication types

LinkOut - more resources