. 2023 Apr 3;11(4):435-449.
doi: 10.1158/2326-6066.CIR-22-0121.

Tissue-Resident Memory T Cells in Pancreatic Ductal Adenocarcinoma Coexpress PD-1 and TIGIT and Functional Inhibition Is Reversible by Dual Antibody Blockade

Affiliations

Tissue-Resident Memory T Cells in Pancreatic Ductal Adenocarcinoma Coexpress PD-1 and TIGIT and Functional Inhibition Is Reversible by Dual Antibody Blockade

Hayden Pearce et al. Cancer Immunol Res. .

Abstract

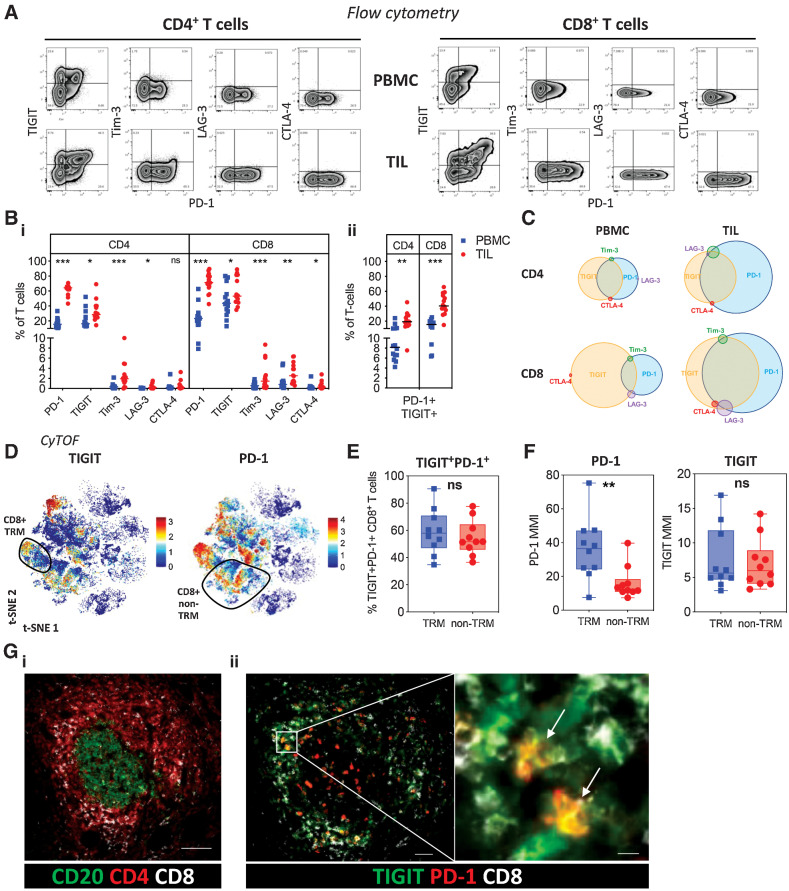
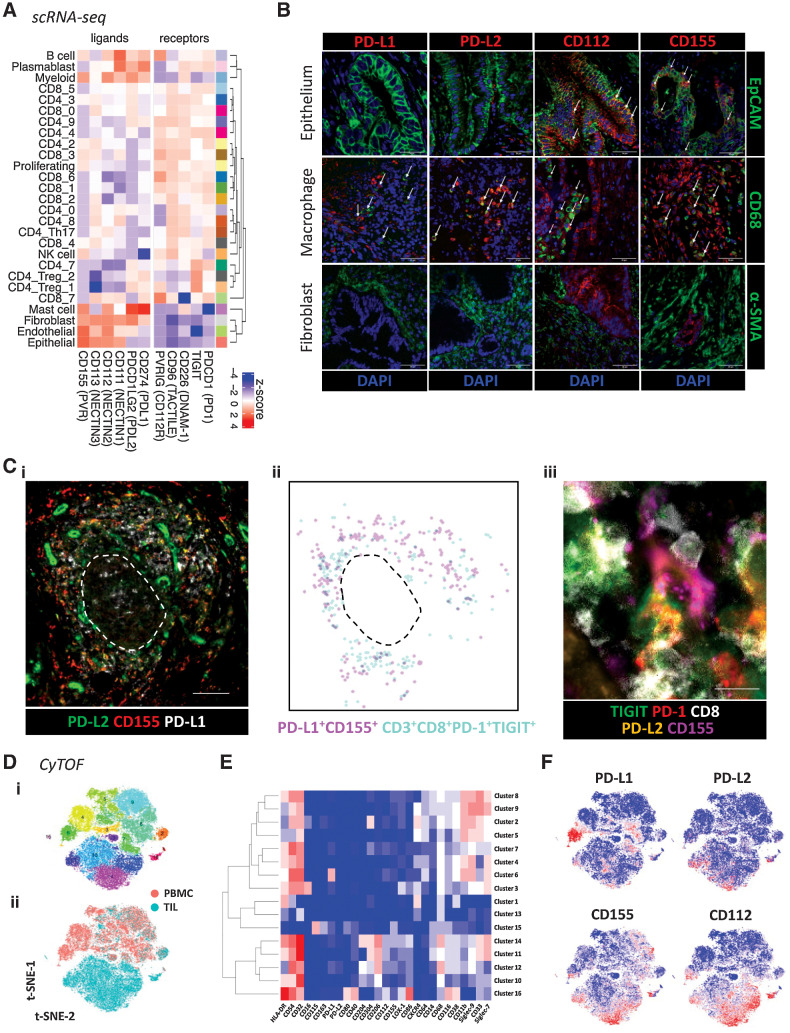
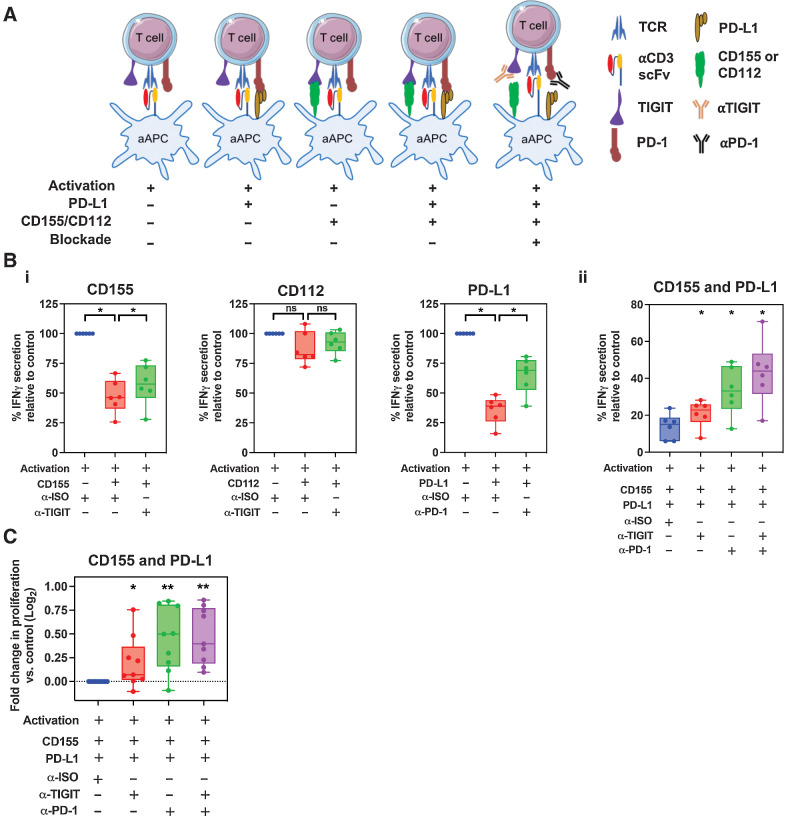
Pancreatic ductal adenocarcinoma (PDAC) has a poor clinical outlook. Responses to immune checkpoint blockade are suboptimal and a much more detailed understanding of the tumor immune microenvironment is needed if this situation is to be improved. Here, we characterized tumor-infiltrating T-cell populations in patients with PDAC using cytometry by time of flight (CyTOF) and single-cell RNA sequencing. T cells were the predominant immune cell subset observed within tumors. Over 30% of CD4+ T cells expressed a CCR6+CD161+ Th17 phenotype and 17% displayed an activated regulatory T-cell profile. Large populations of CD8+ tissue-resident memory (TRM) T cells were also present and expressed high levels of programmed cell death protein 1 (PD-1) and TIGIT. A population of putative tumor-reactive CD103+CD39+ T cells was also observed within the CD8+ tumor-infiltrating lymphocytes population. The expression of PD-1 ligands was limited largely to hemopoietic cells whilst TIGIT ligands were expressed widely within the tumor microenvironment. Programmed death-ligand 1 and CD155 were expressed within the T-cell area of ectopic lymphoid structures and colocalized with PD-1+TIGIT+ CD8+ T cells. Combinatorial anti-PD-1 and TIGIT blockade enhanced IFNγ secretion and proliferation of T cells in the presence of PD-1 and TIGIT ligands. As such, we showed that the PDAC microenvironment is characterized by the presence of substantial populations of TRM cells with an exhausted PD-1+TIGIT+ phenotype where dual checkpoint receptor blockade represents a promising avenue for future immunotherapy.


Figures

Figure 1. High-level cell type atlas of the PDAC tumor microenvironment. A, UMAP embedding of scRNA-seq data from 3 PDAC patient samples overlaid with high level cell type annotation (i). UMAP embedding overlaid with sample identification, and proportions of T, B, and NK cells identified in each sample (ii). UMAP embedding highlighting high level T-cell subsets (iii). Dotplot of the top markers expressed in each high-level cell type (iv). B, Representative plots showing T, B, and NK cell identification in matched PBMC and TIL from patients with PDAC by flow cytometry (i). Graphs showing proportions of T, B, and NK cells in PBMC and TIL (n = 15). Each bar in the waterfall plot represents a patient in (ii), and each dot represents a patient in (iii). C, Representative plots showing gating used to identify T-cell subsets in PBMC and TIL from patients with PDAC by flow cytometry (i). Quantification of αβ and γδ T cells (ii), and NKT and MAIT cells (iii) in PBMC and TIL (n = 15). Comparison of the CD4/CD8 T cell ratio between PBMC and TIL (n = 10) (iv). Horizontal lines represent median, boxes represent quartiles and whiskers represent min and max values. Data analyzed using Wilcoxon matched-pairs signed rank test. *, P < 0.05; **, P < 0.01; ****, P < 0.0001.
Figure 1.
High-level cell type atlas of the PDAC tumor microenvironment. A, UMAP embedding of scRNA-seq data from 3 PDAC patient samples overlaid with high level cell type annotation (i). UMAP embedding overlaid with sample identification, and proportions of T, B, and NK cells identified in each sample (ii). UMAP embedding highlighting high level T-cell subsets (iii). Dotplot of the top markers expressed in each high-level cell type (iv). B, Representative plots showing T, B, and NK cell identification in matched PBMC and TIL from patients with PDAC by flow cytometry (i). Graphs showing proportions of T, B, and NK cells in PBMC and TIL (n = 15). Each bar in the waterfall plot represents a patient in (ii), and each dot represents a patient in (iii). C, Representative plots showing gating used to identify T-cell subsets in PBMC and TIL from patients with PDAC by flow cytometry (i). Quantification of αβ and γδ T cells (ii), and NK T and MAIT cells (iii) in PBMC and TIL (n = 15). Comparison of the CD4/CD8 T cell ratio between PBMC and TIL (n = 10) (iv). Horizontal lines represent median, boxes represent quartiles and whiskers represent min and max values. Data analyzed using Wilcoxon matched-pairs signed rank test. *, P < 0.05; **, P < 0.01; ****, P < 0.0001.
Figure 2. Characterization of CD4+ T-cell populations within the PDAC tumor microenvironment. A, Dotplot of the top markers expressed in each CD4+ T-cell cluster identified via Louvain clustering of scRNA-seq data from CD4+ T cells from 3 PDAC tumor tissue samples (i). Where identifiable in the data, clusters are annotated with known CD4+ T-cell phenotypes. UMAP embedding of CD4+ T cells overlaid with Louvain cluster labels (ii). B, A 35-parameter CyTOF analysis of CD45+ cells from PDAC patient PBMC and TIL (n = 10). t-SNE plots shows Phenograph-clustered CD4+ T-cell populations in PBMC and TIL. C, Stacked bar graph showing the proportion of Naïve, EM, CM, and TEMRA subsets in CD4+ T cells generated from the data in (B). D, Bar graph comparing the proportion of each annotated CD4+ EM subset (TEM1-5) in PBMC vs. TIL, generated using the data in (B). E, Differential expression analysis distinguishing CD4+ Th17 from other non-Treg CD4+ T-cells in scRNA-seq data, first presented in Fig. 1. Selected genes are labelled, and colored points indicate genes that are differentially expressed [BH adjusted P < 0.01 and absolute (average logFC) > 0.5]. F, Quantification of CD4+ Th17 based on dual expression of CCR6 and CD161, performed using the data in (B). Representative contour plots comparing Th17 in PBMC and TIL (i). Box and whisker plot comparing the proportion of Th17 among total memory (CD45RA–) non-Treg CD4+ T-cells in PBMC and TIL (ii). G, Quantification of CD4+ Treg cells based on expression of CD25 and CD127, generated using the data in (B). Representative contour plot of Treg cells (CD25+CD127low) from PDAC TIL (i). Box and whisker plot comparing the proportion of Th17 cells in PBMC and TIL (ii). H, Histograms comparing expression levels of activation and differentiation markers on total Tregs from PBMC and TIL, generated using the data in (B). Horizontal lines represent median, boxes represent quartiles and whiskers represent min and max values. Data analyzed using Wilcoxon matched-pairs signed rank test. CyTOF comparisons analyzed using Wilcoxon matched-pairs signed rank test. *, P < 0.05; **, P < 0.01.
Figure 2.
Characterization of CD4+ T-cell populations within the PDAC tumor microenvironment. A, Dot plot of the top markers expressed in each CD4+ T-cell cluster identified via Louvain clustering of scRNA-seq data from CD4+ T cells from 3 PDAC tumor tissue samples (i). Where identifiable in the data, clusters are annotated with known CD4+ T-cell phenotypes. UMAP embedding of CD4+ T cells overlaid with Louvain cluster labels (ii). B, A 35-parameter CyTOF analysis of CD45+ cells from PDAC patient PBMC and TIL (n = 10). t-SNE plots shows PhenoGraph-clustered CD4+ T-cell populations in PBMC and TIL. C, Stacked bar graph showing the proportion of Naïve, EM, CM, and TEMRA subsets in CD4+ T cells generated from the data in (B). D, Bar graph comparing the proportion of each annotated CD4+ EM subset (TEM1-5) in PBMC vs. TIL, generated using the data in (B). E, Differential expression analysis distinguishing CD4+ Th17 from other non-Treg CD4+ T-cells in scRNA-seq data, first presented in Fig. 1. Selected genes are labelled, and colored points indicate genes that are differentially expressed [BH adjusted P < 0.01 and absolute (average logFC) > 0.5]. F, Quantification of CD4+ Th17 based on dual expression of CCR6 and CD161, performed using the data in (B). Representative contour plots comparing Th17 in PBMC and TIL (i). Box and whisker plot comparing the proportion of Th17 among total memory (CD45RA) non-Treg CD4+ T cells in PBMC and TIL (ii). G, Quantification of CD4+ Treg cells based on expression of CD25 and CD127, generated using the data in (B). Representative contour plot of Treg cells (CD25+CD127low) from PDAC TIL (i). Box and whisker plot comparing the proportion of Th17 cells in PBMC and TIL (ii). H, Histograms comparing expression levels of activation and differentiation markers on total Tregs from PBMC and TIL, generated using the data in (B). Horizontal lines represent median, boxes represent quartiles and whiskers represent minimum and maximum values. Data analyzed using Wilcoxon matched-pairs signed rank test. CyTOF comparisons analyzed using Wilcoxon matched-pairs signed rank test. *, P < 0.05; **, P < 0.01.
Figure 3. Characterization of CD8+ T-cell populations within the PDAC tumor microenvironment. A, Dotplot of the top markers expressed in each CD8+ T-cell cluster identified via Louvain clustering of scRNA-seq data (first presented in Fig. 1) from CD8+ T cells (i). UMAP embedding of CD8+ T cells from the 3 PDAC patient samples overlaid with Louvain cluster label (ii). B, CyTOF analysis of CD45+ cells from PDAC patient PBMC and TIL (n = 10), using data first used in Fig. 2B. t-SNE plots show Phenograph-clustered CD8+ T-cell populations in PBMC and TIL. C, Representative contour plot showing CD8+ TRM cells in PDAC TIL based on positive expression of CD69 and CD103, generated using the data in Fig. 2B (i). Box and whisker plot showing the proportion of CD8+ TRM cells in PBMC and TIL, generated using the data in Fig. 2B (ii). D, UMAP embedding, performed using scRNA-seq first presented in Fig. 1, overlaid with module score quintiles and module score distributions by CD8 T-cell cluster from scoring a core module of genes overexpressed in TRM T-cells (i). Differential expression analysis distinguishing TRM-like cells (clusters CD8_1 and CD8_6) from non-TRM cells (ii). Selected genes are labelled, and colored points indicate genes that are differentially expressed [BH adjusted P < 0.01 and absolute (average logFC) > 0.5]. E, Comparison of memory T-cell markers in CD8+ TRM and non-TRM in PDAC TIL, performed using the data in Fig. 2B. Bar graph comparing the proportion of Naïve, EM, CM, and TEMRA subsets in CD8+ TRM and non-TRM cells (i). Bar graph comparing the CD27 and CD28 expression pattern in CD8+ EM T-cells within TRM and non-TRM cells (ii). F, Line graphs comparing T-cell activation and differentiation marker expression on CD8+ TRM versus non-TRM cells in PDAC TIL, generated using the data in Fig. 2B. G, Representative contour plots (i) and quantification (ii) of CD39+ CD8+ TRM cells in PBMC and TIL, generated using the data in Fig. 2B. H, DFS analysis of patients with PDAC from the TCGA-PAAD dataset based on the expression level of ITGAE (CD103) in tumor tissue. Horizontal lines represent median, boxes represent quartiles and whiskers represent min and max values. Data analyzed using Wilcoxon matched-pairs signed rank test. *, P < 0.05; **, P < 0.01.
Figure 3.
Characterization of CD8+ T-cell populations within the PDAC tumor microenvironment. A, Dot plot of the top markers expressed in each CD8+ T-cell cluster identified via Louvain clustering of scRNA-seq data (first presented in Fig. 1) from CD8+ T cells (i). UMAP embedding of CD8+ T cells from the 3 PDAC patient samples overlaid with Louvain cluster label (ii). B, CyTOF analysis of CD45+ cells from PDAC patient PBMC and TIL (n = 10), using data first used in Fig. 2B. t-SNE plots show PhenoGraph-clustered CD8+ T-cell populations in PBMC and TIL. C, Representative contour plot showing CD8+ TRM cells in PDAC TIL based on positive expression of CD69 and CD103, generated using the data in Fig. 2B (i). Box and whisker plot showing the proportion of CD8+ TRM cells in PBMC and TIL, generated using the data in Fig. 2B (ii). D, UMAP embedding, performed using scRNA-seq first presented in Fig. 1, overlaid with module score quintiles and module score distributions by CD8 T-cell cluster from scoring a core module of genes overexpressed in TRM T-cells (i). Differential expression analysis distinguishing TRM-like cells (clusters CD8_1 and CD8_6) from non-TRM cells (ii). Selected genes are labelled, and colored points indicate genes that are differentially expressed [BH adjusted P < 0.01 and absolute (average logFC) > 0.5]. E, Comparison of memory T-cell markers in CD8+ TRM and non-TRM in PDAC TIL, performed using the data in Fig. 2B. Bar graph comparing the proportion of Naïve, EM, CM, and TEMRA subsets in CD8+ TRM and non-TRM cells (i). Bar graph comparing the CD27 and CD28 expression pattern in CD8+ EM T-cells within TRM and non-TRM cells (ii). F, Line graphs comparing T-cell activation and differentiation marker expression on CD8+ TRM versus non-TRM cells in PDAC TIL, generated using the data in Fig. 2B. G, Representative contour plots (i) and quantification (ii) of CD39+ CD8+ TRM cells in PBMC and TIL, generated using the data in Fig. 2B. H, DFS analysis of patients with PDAC from the TCGA-PAAD dataset based on the expression level of ITGAE (CD103) in tumor tissue. Horizontal lines represent median, boxes represent quartiles and whiskers represent min and max values. Data analyzed using Wilcoxon matched-pairs signed rank test. *, P < 0.05; **, P < 0.01.
Figure 4. Checkpoint inhibitory receptor expression on PDAC T cells. A, Expression of checkpoint inhibitory receptors PD-1, TIGIT, Tim-3, LAG-3, and CTLA-4 on CD4+ and CD8+ T cells from matched PBMC and TIL was examined by flow cytometry (n = 14). Representative flow cytometric zebra plots show expression of each checkpoint inhibitory receptor alongside PD-1 expression for CD4+ and CD8+ T cells from PBMC and TIL. B, Scatter plots compare the proportion of each checkpoint receptor (i) and dual PD-1 and TIGIT expression (ii) on CD4+ and CD8+ T cells from PBMC and TIL. C, Venn diagrams show the overlapping expression of checkpoint inhibitory receptors on CD4+ and CD8+ T cells from PBMC and TIL. D, t-SNE plot of PDAC TIL CyTOF data first presented in Fig. 2B showing the expression level of TIGIT and PD-1. CD8+ TRM cells are highlighted. E, Box and whisker plot, generated using the CyTOF data first presented in Fig. 2B, compares dual TIGIT and PD-1 expression on TRM and non-TRM CD8+ T cells from PDAC TIL. F, Box and whisker plots, generated using the CyTOF data first presented in Fig. 2B, compare the MMI of PD-1 and TIGIT on TRM and non-TRM CD8+ T cells from PDAC TIL. G, Multiplex IHC staining shows T-cell staining around CD20+ B cells in lymphoid structures (scale bar: 100 μm) (i); expression of PD-1 and TIGIT across the follicle with TIGIT focused within the T-cell zone (scale bar: 50 μm) and PD-1+TIGIT+ coexpression on CD8+ T cells (scale bar: 10 μm) (ii). Horizontal lines represent median, boxes represent quartiles and whiskers represent min and max values. Data analyzed using Wilcoxon matched-pairs signed rank test. *, P < 0.05; **, P < 0.01; ***, P < 0.001.
Figure 4.
Checkpoint inhibitory receptor expression on PDAC T cells. A, Expression of checkpoint inhibitory receptors PD-1, TIGIT, Tim-3, LAG-3, and CTLA-4 on CD4+ and CD8+ T cells from matched PBMC and TIL was examined by flow cytometry (n = 14). Representative flow cytometric zebra plots show expression of each checkpoint inhibitory receptor alongside PD-1 expression for CD4+ and CD8+ T cells from PBMC and TIL. B, Scatter plots compare the proportion of each checkpoint receptor (i) and dual PD-1 and TIGIT expression (ii) on CD4+ and CD8+ T cells from PBMC and TIL. C, Venn diagrams show the overlapping expression of checkpoint inhibitory receptors on CD4+ and CD8+ T cells from PBMC and TIL. D, t-SNE plot of PDAC TIL CyTOF data first presented in Fig. 2B showing the expression level of TIGIT and PD-1. CD8+ TRM cells are highlighted. E, Box and whisker plot, generated using the CyTOF data first presented in Fig. 2B, compares dual TIGIT and PD-1 expression on TRM and non-TRM CD8+ T cells from PDAC TIL. F, Box and whisker plots, generated using the CyTOF data first presented in Fig. 2B, compare the MMI of PD-1 and TIGIT on TRM and non-TRM CD8+ T cells from PDAC TIL. G, Multiplex IHC staining shows T-cell staining around CD20+ B cells in lymphoid structures (scale bar: 100 μm; i); expression of PD-1 and TIGIT across the follicle with TIGIT focused within the T-cell zone (scale bar: 50 μm) and PD-1+TIGIT+ coexpression on CD8+ T cells (scale bar: 10 μm; ii). Horizontal lines represent median, boxes represent quartiles and whiskers represent minimum and maximum values. Data analyzed using Wilcoxon matched-pairs signed rank test. *, P < 0.05; **, P < 0.01; ***, P < 0.001.
Figure 5. Expression of PD-1 and TIGIT ligands in the PDAC TME. A, Average expression profiles of TIGIT and PD-1 family receptors/ligands on all annotated cell subsets from scRNA-seq data first presented in Fig. 1. B, Representative confocal images of immunofluorescent staining for PD-1 and TIGIT ligands on tumor epithelium (EpCAM+), macrophages (CD68+), and stroma/fibroblasts (α-SMA+) using PDAC FFPE tissue (n = 10 patients). White arrows indicate examples of dual staining. Scale bars: 50 μm. C, Multiplex IHC staining of PD-1 and TIGIT ligands within ectopic lymphoid structures (scale bar: 100 μm) (i). Digital representation of cell segmentation and localization of PD-L1+CD155+ cells and PD-1+TIGIT+ CD8+ T cells (ii). Direct engagement of a PD-1+TIGIT+ CD8+ T cell with a PD-L2+CD155+ cell within the T-cell area (scale bar: 10 μm) (iii). Dashed line represents the border between the T- and B-cell areas. D, A 35-parameter CyTOF panel was used to determine the expression of PD-1 and/or TIGIT ligands on different myeloid-cell subsets in matched PBMC and TIL samples from patients with PDAC (n = 10). t-SNE plot shows Phenograph clusters of myeloid-enriched cell populations from combined PBMC and TIL (i), and cells stratified by sample type (ii). E, Heatmap shows median expression level of key markers in each Phenograph cluster. F, t-SNE plots show the expression level of PD-1 and TIGIT ligands.
Figure 5.
Expression of PD-1 and TIGIT ligands in the PDAC TME. A, Average expression profiles of TIGIT and PD-1 family receptors/ligands on all annotated cell subsets from scRNA-seq data first presented in Fig. 1. B, Representative confocal images of immunofluorescent staining for PD-1 and TIGIT ligands on tumor epithelium (EpCAM+), macrophages (CD68+), and stroma/fibroblasts (α-SMA+) using PDAC FFPE tissue (n = 10 patients). White arrows indicate examples of dual staining. Scale bars: 50 μm. C, Multiplex IHC staining of PD-1 and TIGIT ligands within ectopic lymphoid structures (scale bar: 100 μm; i). Digital representation of cell segmentation and localization of PD-L1+CD155+ cells and PD-1+TIGIT+ CD8+ T cells (ii). Direct engagement of a PD-1+TIGIT+ CD8+ T cell with a PD-L2+CD155+ cell within the T-cell area (scale bar: 10 μm; iii). Dashed line represents the border between the T- and B-cell areas. D, A 35-parameter CyTOF panel was used to determine the expression of PD-1 and/or TIGIT ligands on different myeloid-cell subsets in matched PBMC and TIL samples from patients with PDAC (n = 10). t-SNE plot shows PhenoGraph clusters of myeloid-enriched cell populations from combined PBMC and TIL (i), and cells stratified by sample type (ii). E, Heat map shows median expression level of key markers in each PhenoGraph cluster. F, t-SNE plots show the expression level of PD-1 and TIGIT ligands.
Figure 6. The effect of T-cell proliferation and cytokine secretion following anti–PD-1 and anti-TIGIT blockade. A, Schematic representation of the CHO-aAPC:T-cell coculture assay. T cells from patients with PDAC were cocultured with aAPCs expressing PD-1 and/or TIGIT ligands for 4 days in the presence of anti-TIGIT and/or anti–PD-1, or with a mAb isotype control. B, Cell culture supernatants from 6 patients in triplicate wells were harvested after 4 days of coculture and IFNγ was quantified by ELISA. Box and whisker graphs compare the levels of IFNγ secreted under 3 conditions – without ligand expression, with ligand expression, and for both ligand expression and mAb blockade with either CD155, CD112, or PD-L1 (i) or dual CD155 and PD-L1 (ii) expression. C, Proliferation of T cells (n = 9 patients) following coculture was determined by CTV dilution and analyzed by flow cytometry on day 4. Box and whisker graphs compare fold change in T-cell proliferation following single or dual CD155/PD-L1 mAb blockade compared with without (isotype mAb) blockade with CHO-aAPCs expressing both CD155 and PD-L1. Horizontal lines represent median, boxes represent quartiles and whiskers represent min and max values. Data analyzed using Wilcoxon matched-pairs signed rank test. *, P < 0.05; **, P < 0.01.
Figure 6.
The effect of T-cell proliferation and cytokine secretion following anti–PD-1 and anti-TIGIT blockade. A, Schematic representation of the CHO-aAPC:T-cell coculture assay. T cells from patients with PDAC were cocultured with aAPCs expressing PD-1 and/or TIGIT ligands for 4 days in the presence of anti-TIGIT and/or anti–PD-1, or with a mAb isotype control. B, Cell culture supernatants from 6 patients in triplicate wells were harvested after 4 days of coculture and IFNγ was quantified by ELISA. Box and whisker graphs compare the levels of IFNγ secreted under 3 conditions—without ligand expression, with ligand expression, and for both ligand expression and mAb blockade with either CD155, CD112, or PD-L1 (i) or dual CD155 and PD-L1 (ii) expression. C, Proliferation of T cells (n = 9 patients) following coculture was determined by CTV dilution and analyzed by flow cytometry on day 4. Box and whisker graphs compare fold change in T-cell proliferation following single or dual CD155/PD-L1 mAb blockade compared with without (isotype mAb) blockade with CHO-aAPCs expressing both CD155 and PD-L1. Horizontal lines represent median, boxes represent quartiles and whiskers represent minimum and maximum values. Data analyzed using Wilcoxon matched-pairs signed rank test. *, P < 0.05; **, P < 0.01.

Similar articles

Cited by

References

    1. Jain T, Dudeja V. The war against pancreatic cancer in 2020 - advances on all fronts. Nat Rev Gastroenterol Hepatol 2021;18:99–100. - PubMed
    1. Principe DR, Underwood PW, Korc M, Trevino JG, Munshi HG, Rana A. The current treatment paradigm for pancreatic ductal adenocarcinoma and barriers to therapeutic efficacy. Front Oncol 2021;11:688377. - PMC - PubMed
    1. Kabacaoglu D, Ciecielski KJ, Ruess DA, Algül H. Immune checkpoint inhibition for pancreatic ductal adenocarcinoma: current limitations and future options. Front Immunol 2018;9:1878. - PMC - PubMed
    1. Leinwand J, Miller G. Regulation and modulation of antitumor immunity in pancreatic cancer. Nat Immunol 2020;21:1152–9. - PubMed
    1. Liu X, Xu J, Zhang B, Liu J, Liang C, Meng Q, et al. . The reciprocal regulation between host tissue and immune cells in pancreatic ductal adenocarcinoma: new insights and therapeutic implications. Mol Cancer 2019;18:184. - PMC - PubMed

Publication types

Substances