. 2023 Mar 1:563:111864.
doi: 10.1016/j.mce.2023.111864. Epub 2023 Jan 20.

Genomic glucocorticoid action in embryonic mouse neural stem cells

Affiliations

Genomic glucocorticoid action in embryonic mouse neural stem cells

Kimberly J Berry et al. Mol Cell Endocrinol. .

Abstract

Prenatal exposure to synthetic glucocorticoids (sGCs) reprograms brain development and predisposes the developing fetus towards potential adverse neurodevelopmental outcomes. Using a mouse model of sGC administration, previous studies show that these changes are accompanied by sexually dimorphic alterations in the transcriptome of neural stem and progenitor cells (NSPCs) derived from the embryonic telencephalon. Because cell type-specific gene expression profiles tightly regulate cell fate decisions and are controlled by a flexible landscape of chromatin domains upon which transcription factors and enhancer elements act, we multiplexed data from four genome-wide assays: RNA-seq, ATAC-seq (assay for transposase accessible chromatin followed by genome wide sequencing), dual cross-linking ChIP-seq (chromatin immunoprecipitation followed by genome wide sequencing), and microarray gene expression to identify novel relationships between gene regulation, chromatin structure, and genomic glucocorticoid receptor (GR) action in NSPCs. These data reveal that GR binds preferentially to predetermined regions of accessible chromatin to influence gene programming and cell fate decisions. In addition, we identify SOX2 as a transcription factor that impacts the genomic response of select GR target genes to sGCs (i.e., dexamethasone) in NSPCs.

Keywords: Chromatin; Glucocorticoid; Neural stem progenitor; Neurodevelopment; SOX2.


Conflict of interest statement

Declaration of competing interest None of the authors have any conflict of interest to disclose.

Figures

Figure 1.
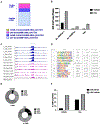
Figure 1.. Mapping Open Chromatin by ATAC-seq in Embryonic Cerebral Cortical NSPCs
A) Schematic diagram overview of bioinformatic processing of vehicle-treated or Dex-treated NSPCs (E14.5). The black dotted line represents the cut-off threshold (p<0.05) for called ATAC-seq peaks (top) or ChIP-seq peaks (bottom) (boxed in). Genomic regions are categorized as a) constitutively accessible and GR-bound in both treatment conditions, b) differentially accessible and GR-bound in Dex-treated NSPCs only, c) constitutively accessible but not GR-bound in either condition, or d) constitutively accessible in both treatment conditions but GR-bound only in the presence of Dex. Multi-Omics Data Integration (right) allows visualization of (i) peaks proximal to the TSS of a Dex-regulated gene, (ii) peaks enriched for a glucocorticoid responsive element (GRE) or SOX TF motif, and (iii) peaks with a H3K27ac histone modification. B) Percentage of consensus ATAC-seq peaks in vehicle (75.7%, n=19,919) or Dex-treated (73.6%, n=21,182) cortical NSPCs (E14.5), which overlap with the promoter/enhancer mark H3K27ac detected in cortical NSPCs (E14.5) from an independent study (Gene Expression Omnibus accession no. 104686). C) Percentage of Dex-induced target genes, identified by RNA-seq (log FC>0.8, n=300), with at least one consensus TSS-proximal (−5 kb/+3kb) ATAC-seq peak in vehicle- or Dex-treated cortical NSPCs (E14.5) (Vehicle, 91.33%, n=274) (Dex 92.7%, n=278). D) Constitutive and Dex-induced ATAC-seq peaks in the proximal (−5kb/+3kb) regulatory region of the Dex-induced Hif3α gene. TSS is marked by a green line. The red and blue brackets indicate constitutive and induced peaks, respectively.
Figure 2.
Figure 2.. GR Binding and the Chromatin Landscape in NSPCs
A) Quantification of GR ChIP-seq peaks that occur in vehicle- (Pre-Dex, n=941) or in Dex-treated NSPCs (Post-Dex, n=3162). Within these groups, ChIP-seq peaks occurred at (i) weak or inaccessible regions of chromatin, or (ii) pre-accessible sites of chromatin. B) Quantification of GR ChIP-seq peaks (y-axis) that occur in (i) accessible regions of chromatin, which have an H3K27Ac mark (Ac. H3K27ac+), (ii) accessible regions of chromatin that lack an H3K27ac mark (Ac. H3K27ac-), or (iii) inaccessible regions of chromatin (x-axis) in vehicle- or Dex-treated NSC. Genomic localization of H3K27ac was delineated in cortical NSPCs (E14.5) from an independent study (Gene Expression Omnibus accession no. 104686). Fisher’s exact test of independence between category (i) and (ii) (***p<0.01). C) ATAC-seq and GR ChIP-seq peaks located in a H3K27ac+ distal enhancer region of DNA (frame view chr18:16,552,637–63,558,00). Horizontal rows from top to bottom: ATAC-seq peaks in triplicate of vehicle- or Dex-treated NSPCs (blue), ChIP-seq peaks in triplicate of vehicle- or Dex-treated NSPCs (pink). Genomic regions with a ChIP-seq peak for the H3K27ac promoter/enhancer mark detected in cortical NSPCs (E14.5) from an independent study (GEO104686) are indicated by the black bracket (top). The RefSeq horizontal row indicates location of any protein coding regions in the murine (mm10) reference genome (bottom). The nearest gene to this position is ~100 kb away (out of frame). D) Enrichment of non-random consensus TF binding motifs in our ChIP-seq reads relative to random background, determined by the HOMER motif algorithm. Glucocorticoid responsive element; GRE. Androgen responsive element; ARE. Progesterone receptor; PGR. Nuclear factor-1; NF-1. Androgen receptor; AR. E) Percentage of ChIP-seq peaks enriched for GR or SOX TF motifs in cortical NSPCs exposed to vehicle or Dex in-vitro. The number of ChIP-seq peaks are indicated at the bottom of each chart. GRE; glucocorticoid responsive element. F) Percentage of ChIP-seq peaks enriched for a GRE full-site or GRE half-site using the HOMER motif enrichment algorithm. Fisher’s Exact test (***p<0.0001).
Figure 3.
Figure 3.. Differential Chromatin Accessibility in Response to Dex in Embryonic Cortical NSPCs
A) Points representing an ATAC-seq differential peaks between vehicle- vs. Dex-treated samples (n=95). Fold change of normalized average ATAC-seq peak read intensity (Dex-Veh) (x-axis); p-value (p<0.05) (y-axis). B) HOMER motif analyses predict enrichment of GRE and/or SOX TF motifs (x-axis) under (i) all differential ATAC-seq peaks (black), differential ATAC-seq peaks induced by Dex (blue), or differential ATAC-seq peaks attenuated by Dex (pink). HOMER motif predictions were called using a (p<0.05) cut-off for significance. C) A model of TSS-proximal TF motifs with facilitate the dynamic chromatin response to Dex in embryonic cortical NSPCs. Each vertical bar represents a cluster of ATAC-seq reads, with a set of bars representing a single ATAC-seq peak. The vertical height of each bar represents intensity of ATAC-seq reads at a single genomic location. D) Peak ID of differential ATAC-seq peaks (p<0.05), which occur within the −5kb/+3kb region of a Dex-regulated gene, or at a Dex-regulated gene TSS. Asterisks indicate ATAC-seq peaks with a Dex-induced decrease in chromatin accessibility. RNA-seq data previously published by Frahm et al., 2018. RNA-seq log Veh/Dex fold change.
Figure 4.
Figure 4.. Hormonal Regulation of Chromatin Accessibility and Glucocorticoid Receptor Binding in Genomic Enhancer Regions
A) Genome annotation of differential ATAC-seq peaks in vehicle- and Dex-treated NSPCs (n=95). TSS; Transcriptional start site. B) Percentage of differential ATAC-seq peaks (x-axis) which overlap with a ChIP-seq peak for H3K27ac and/or GR. Genomic localization of H3K27ac was delineated in cortical NSPCs (E14.5) from an independent study (Gene Expression Omnibus accession no. 104686).
Figure 5.
Figure 5.. GR-SOX2 Proximity in NSPCs.
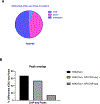
A. Detection of GR and SOX2 proximity in-vitro, using adherent, proliferating NSPCs treated with either vehicle or Dex for 4 hours. Blue; Dapi staining of nuclei. Red; PLA probes indicating GR-SOX2 proximity (<40nm). Negative control groups for antibody-specific PLA-probe activity (ControlGR and ControlSOX2) had minimal fluorescence of PLA probes. Images shown at 60X magnification contain a 10μm scale bar. Pseudo-color increased post-processing for visual enhancement of publication images. Asterisk indicates the cell shown on the magnified inset, upper right corner. B. Overall average PLA probe intensity per cell per image per embryo in vehicle- (n=1,178 cells, 24 images) or Dex-treated (n=1,256 cells, 24 images) NSPCs (n=3 biological replicates), with all cells per image included. Control groups; ControlGR and ControlSOX2. One-way ANOVA test reveals a significant difference among group means (p<0.001). The single asterisk and bar indicate a significant difference between two groups (p<0.05) (F3,8 = degrees of freedom for the numerator (DFn=3) or denominator (DFd=8) of the F ratio (F=11.26). C. Average percentage of vehicle-treated (n=726) or Dex-treated (n=529) NSPCs with PLA probes (probe intensity per cell >100) (n=3). Control groups; ControlGR and ControlSOX2. One-way ANOVA test reveals a significant difference among group means (p<0.01). The single or double asterisks and bar indicate a significant difference between two groups (p<0.05 or p<0.01) (F3,8 = degrees of freedom for the numerator (DFn=3) or denominator (DFd=8) of the F ratio (F=14.79). D. Overall average PLA probe intensity per cell per image per embryo, only in probe-positive (probe intensity per cell >100, Fig. 5C) NPSCs treated with vehicle (n=726 cells) or Dex (n=529 cells) for 4 hours (n=3). Control groups; ControlGR and ControlSOX2. Unpaired two-tailed t-test does not reveal significance (p>0.05).
Figure 6.
Figure 6.. Gene Expression Profiling of the Dex Transcriptome in WT vs SOX2 KO NSPCs
6A) Quantification of genes which were robustly upregulated (p<0.05; FC ≥ 1.5), robustly downregulated (p<0.05; FC ≤ −1.5), or moderately regulated (p<0.05; 1.5 < FC > −1.5) following 4h Dex treatment in WT NSPCs (P0; n=7) or SOX2 KO NSPCs (P0; n=7). FC; fold change of average expression value. Total n of significantly regulated genes (p<0.05) per group is displayed at the bottom of each chart. 6B) Quantification of genes which were Dex-upregulated (p<0.05)(left) or Dex-downregulated (p<0.05)(right) in (i) WT NSPCs only when compared to SOX2 KO NSPCs (WT Unique), (ii) both WT and SOX2 KO NSPCs (Shared), or (iii) SOX2 KO NSPCs only when compared to WT NSPCs (KO Unique). 6C-D) Genes involved in canonical glucocorticoid signaling pathways which are upregulated (Red; FC > 0) or downregulated (Green; FC < 0) by Dex at 4h in WT NSPCs (6C) or (6D) SOX2 KO NSPCs.

Similar articles

References

    1. ACOG committee opnion: antenatal corticosteroid therapy for fetal maturation. Obstetrics and gynecology 99, 871–873 (2002). - PubMed
    1. Liggins GC & Howie RN A controlled trial of antepartum glucocorticoid treatment for prevention of the respiratory distress syndrome in premature infants. Pediatrics 50, 515–525 (1972). - PubMed
    1. Antonow-Schlorke I et al. Adverse effects of antenatal glucocorticoids on cerebral myelination in sheep. Obstetrics and gynecology 113, 142–151, doi:10.1097/AOG.0b013e3181924d3b (2009). - DOI - PubMed
    1. Cheong JL et al. Association Between Moderate and Late Preterm Birth and Neurodevelopment and Social-Emotional Development at Age 2 Years. JAMA pediatrics 171, e164805, doi:10.1001/jamapediatrics.2016.4805 (2017). - DOI - PubMed
    1. Franca MS et al. Neonatal neuronal apoptosis after betamethasone administration in pregnant Wistar rats. The journal of maternal-fetal & neonatal medicine : the official journal of the European Association of Perinatal Medicine, the Federation of Asia and Oceania Perinatal Societies, the International Society of Perinatal Obstet 29, 1089–1093, doi:10.3109/14767058.2015.1035639 (2016). - DOI - PubMed

Publication types