. 2023 Mar:69:101678.
doi: 10.1016/j.molmet.2023.101678. Epub 2023 Jan 20.

Sex differences in islet stress responses support female β cell resilience

Affiliations

Sex differences in islet stress responses support female β cell resilience

George P Brownrigg et al. Mol Metab. 2023 Mar.

Abstract

Objective: Pancreatic β cells play a key role in maintaining glucose homeostasis; dysfunction of this critical cell type causes type 2 diabetes (T2D). Emerging evidence points to sex differences in β cells, but few studies have examined male-female differences in β cell stress responses and resilience across multiple contexts, including diabetes. Here, we address the need for high-quality information on sex differences in β cell and islet gene expression and function using both human and rodent samples.

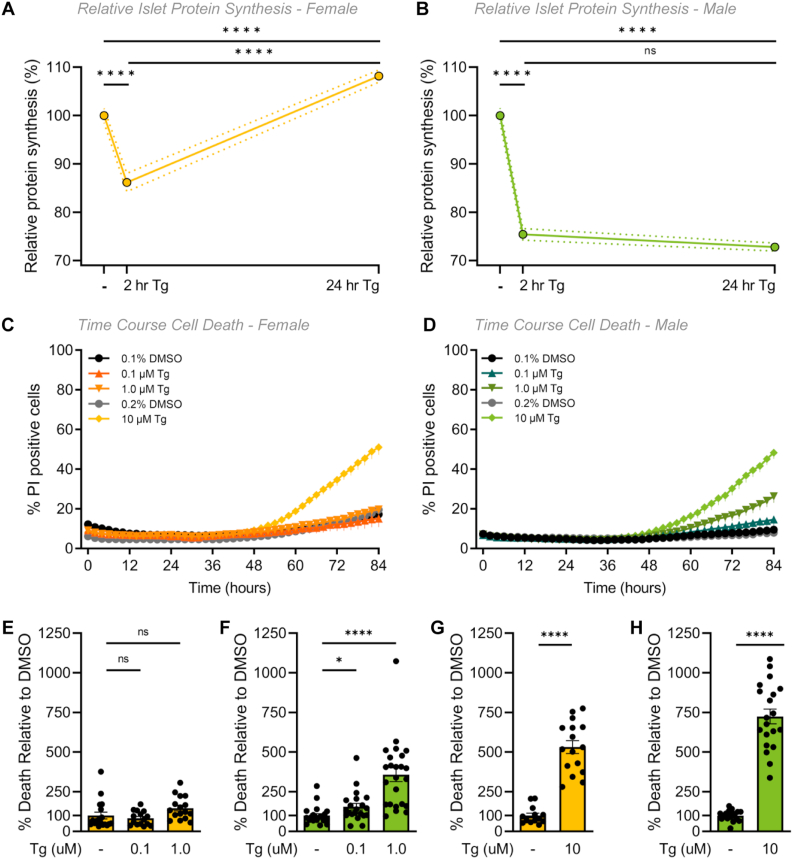
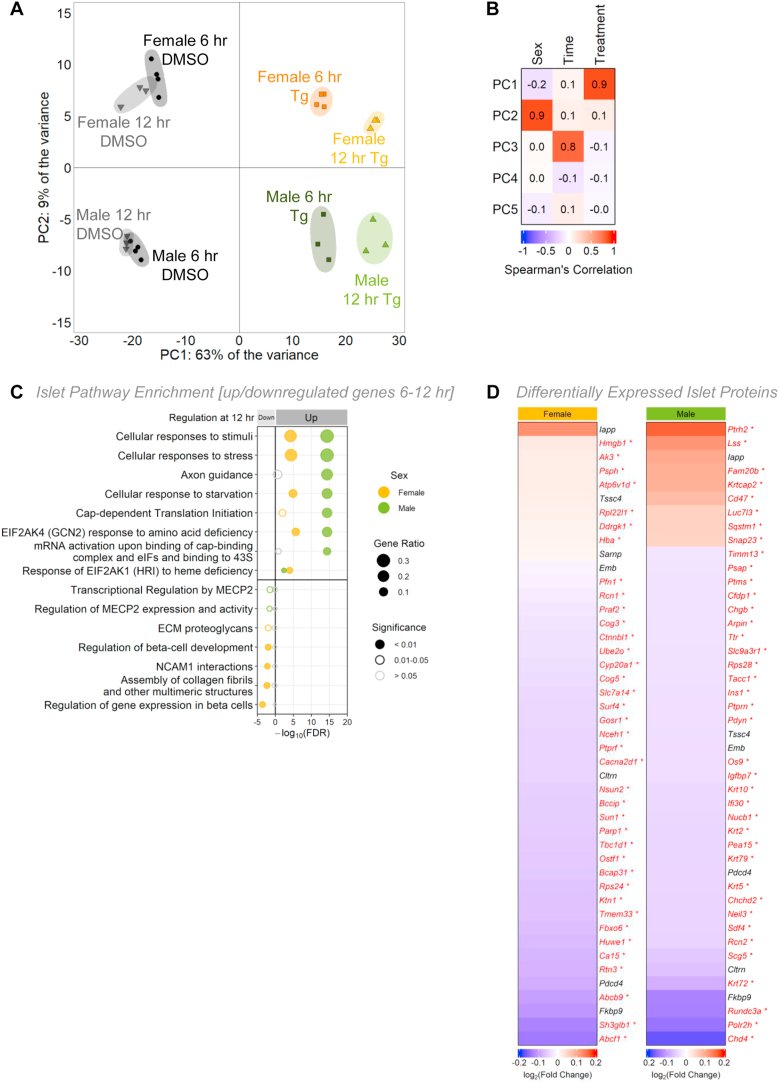
Methods: In humans, we compared β cell gene expression and insulin secretion in donors with T2D to non-diabetic donors in both males and females. In mice, we generated a well-powered islet RNAseq dataset from 20-week-old male and female siblings with similar insulin sensitivity. Our unbiased gene expression analysis pointed to a sex difference in the endoplasmic reticulum (ER) stress response. Based on this analysis, we hypothesized female islets would be more resilient to ER stress than male islets. To test this, we subjected islets isolated from age-matched male and female mice to thapsigargin treatment and monitored protein synthesis, cell death, and β cell insulin production and secretion. Transcriptomic and proteomic analyses were used to characterize sex differences in islet responses to ER stress.

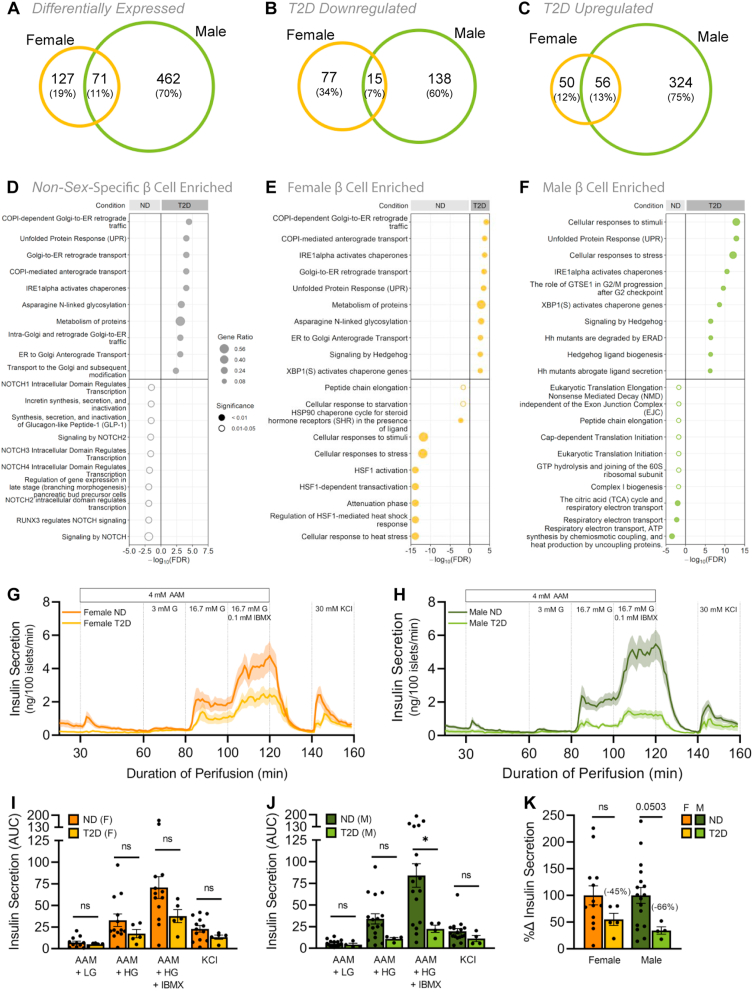
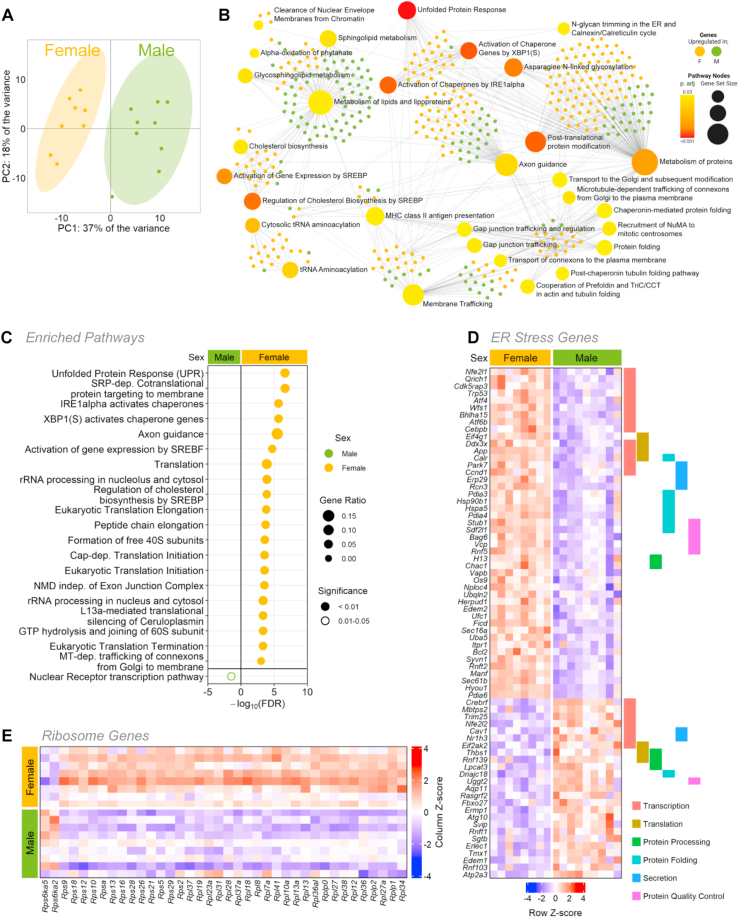
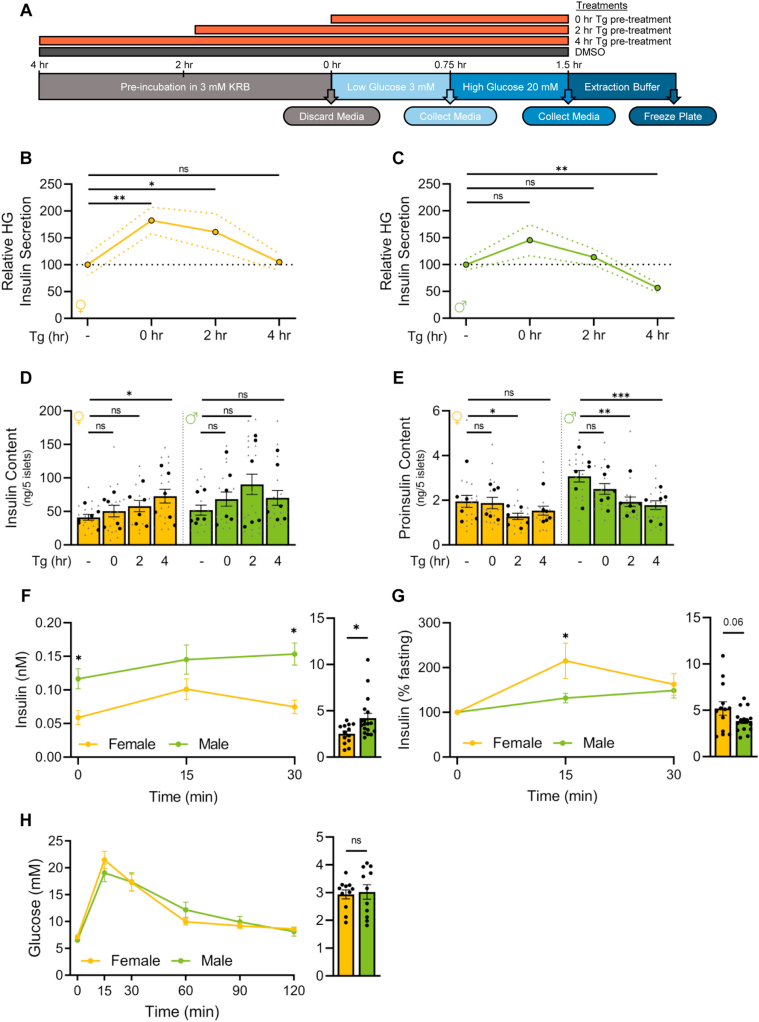
Results: Our single-cell analysis of human β cells revealed sex-specific changes to gene expression and function in T2D, correlating with more robust insulin secretion in human islets isolated from female donors with T2D compared to male donors with T2D. In mice, RNA sequencing revealed differential enrichment of unfolded protein response pathway-associated genes, where female islets showed higher expression of genes linked with protein synthesis, folding, and processing. This differential expression was physiologically significant, as islets isolated from female mice were more resilient to ER stress induction with thapsigargin. Specifically, female islets showed a greater ability to maintain glucose-stimulated insulin production and secretion during ER stress compared with males.

Conclusions: Our data demonstrate sex differences in β cell gene expression in both humans and mice, and that female β cells show a greater ability to maintain glucose-stimulated insulin secretion across multiple physiological and pathological contexts.

Keywords: Diabetes mellitus; Endoplasmic reticulum stress; Pancreatic islets; Protein synthesis; Transcriptomics; β cells.


Figures

Figure 1
Figure 1
Sex differences in human islet transcriptomic and functional responses in type 2 diabetes. scRNAseq data from male and female human β cells. For donor metadata see Supplementary file 8. (A–C) Venn diagrams compare the number of significantly differentially expressed genes between ND and T2D donors (p-adj<0.05). All differentially expressed genes (A), downregulated genes (B), upregulated genes (C) in T2D human β cells. For complete gene lists see Supplementary file 1 and 2. (D–F) Top 10 significantly enriched Reactome pathways (ND vs T2D) from non-sex-specific (D), female (E), or male (F) significantly differentially expressed genes (p-adj< 0.05). Gene ratio is calculated as k/n, where k is the number of genes identified in each Reactome pathway, and n is the number of genes from the submitted gene list participating in any Reactome pathway. For complete Reactome pathway lists see Supplementary file 2. (G–K) Human islet perifusion data from the Human Pancreas Analysis Program in ND and T2D donor islets in females (F, I) and males (G, H). 3 mM glucose (3 mM G); 16.7 mM glucose (16.7 mM G); 0.1 mM isobutylmethylxanthine (0.1 mM IBMX); 30 mM potassium chloride (30 mM KCl); 4 mM amino acid mixture (4 mM AAM; mM: 0.44 alanine, 0.19 arginine, 0.038 aspartate, 0.094 citrulline, 0.12 glutamate, 0.30 glycine, 0.077 histidine, 0.094 isoleucine, 0.16 leucine, 0.37 lysine, 0.05 methionine, 0.70 ornithine, 0.08 phenylalanine, 0.35 proline, 0.57 serine, 0.27 threonine, 0.073 tryptophan, and 0.20 valine, 2 mM glutamine). (I–K) Quantification of area under the curve (AUC) is shown for the various stimulatory media in females (I), males (J) and donors with T2D (K). (I) In females, insulin secretion from ND islets was not significantly higher than T2D islets under any culture condition (p = 0.4806 [AAM + LG], p = 0.2270 [AAM + HG], p = 0.1384 [AAM + HG + IBMX], and p = 0.1465 [KCl]; unpaired Student's t-test). (J) In males, insulin secretion from ND islets was significantly higher than T2D islets under 4 mM AAM +16.7 mM glucose (HG) + 0.1 mM IBMX stimulation (p = 0.0442 [AAM + HG + IBMX]; unpaired Student's t-test), but not in other conditions (p = 0.5315 [AAM + LG], p = 0.0818 [AAM + HG], and p = 0.2259 [KCl]; unpaired Student's t-test). (K) Total insulin secretion showed a trend toward lower secretion in T2D male islets than ND male islets (p = 0.1514 and p = 0.0503 for females and males, respectively; unpaired Student's t-test). ∗ indicates p < 0.05; ns indicates not significant; error bars indicate SEM.
Figure 2
Figure 2
Sex-biased gene expression in mouse islet bulk RNAseq. (A) Principal component analysis (PCA) of RNAseq data from male and female mouse islets. (B) Over-representation analysis (ORA) of all significantly differentially expressed genes (p-adj <0.01) from male and female mouse islets. Top 30 enriched KEGG pathways (large nodes; size = proportional to connections, darker red color = greater significance) and associated genes (small nodes; green = male enriched, yellow = female enriched). (C) Top significantly enriched Reactome pathways from the top 1000 significantly differentially expressed genes. (p-adj <0.01) for males and females. Gene ratio is calculated as k/n, where k is the number of genes identified in each Reactome pathway, and n is the number of genes from the submitted gene list participating in any Reactome pathway. For complete Reactome pathway lists see Supplementary file 3. (D) All transcripts of differentially expressed genes under the gene ontology term “Cellular response to ER stress” (GO:0034976) and genes labeled by their role in transcription, translation, protein processing, protein folding, secretion and protein quality control. (E) All transcripts of differentially expressed ribosomal genes.
Figure 3
Figure 3
Sex differences in mouse islet ER stress-associated phenotypes. (A, B) Protein synthesis was quantified in dispersed islet cells from 20-week-old male and female B6 mice after treatment with 1 μM Tg for 2- or 24-hours. (A) In female islet cells, protein synthesis was significantly lower after a 2-hour Tg treatment compared to control (p < 0.0001; one-way ANOVA followed by Tukey HSD test), significantly higher after a 24-hour Tg treatment compared to a 2-hour Tg treatment (p < 0.0001; one-way ANOVA followed by Tukey HSD test) and recovered to a significantly higher level than control levels p < 0.0001; one-way ANOVA followed by Tukey HSD test). (B) In male islet cells, protein synthesis was significantly lower after a 2- and 24-hour Tg treatment compared to control (p < 0.0001 for both treatments; one-way ANOVA followed by Tukey HSD test) and was not significantly different after a 24-hour treatment compared to a 2-hour Tg treatment p = 0.3022; one-way ANOVA followed by Tukey HSD test). The magnitude of protein synthesis repression and recovery was significantly different in all sex:treatment interactions (p = 0.0015 [DMSO-2hr], p < 0.0001 [DMSO-24hr], p < 0.0001 [2hr–24hr]; two-way ANOVA followed by Tukey HSD test). (C–H) Quantification of propidium iodide (PI) cell death assay of dispersed islets from 20-week-old male and female B6 mice treated with thapsigargin (0.1 μM, 1 μM or 10 μM Tg) or DMSO for 84 h n = 4–6 mice, >1000 cells per group. Percentage (%) of PI positive cells was quantified as the number of PI-positive/Hoechst 33342-positive cells in female (C) and male (D) islet cells. Relative cell death at 84 h in Tg treatments compared with DMSO treatment in females (E, G) and males (F, H). The control for both 0.1 and 1.0 μM Tg treatments is 0.1% DMSO (E, F). The control for 10 μM Tg treatment is 0.2% DMSO (G, H). In female islet cells, cell death was significantly higher in 10 μM Tg compared to control (p < 0.0001; unpaired Student's t-test). In male islet cells, cell death was significantly higher in 0.1, 1.0 and 10 μM Tg compared to control (p = 0.0230 [0.1 μM], p < 0.0001 [1 μM] and p < 0.0001 [10 μM]; unpaired Student's t-test) (D). For E-H, at 84 h the % of PI positive cells for each treatment was normalized to the DMSO control avg for each sex. ∗ indicates p < 0.05, ∗∗ indicates p < 0.01, ∗∗∗∗ indicates p < 0.0001; ns indicates not significant; error bars indicate SEM.
Figure 4
Figure 4
Sex differences in ex vivo and in vivo insulin secretion. (A) Experimental workflow of static glucose-stimulated insulin secretion. (B, C) Relative high glucose (20 mM; high glucose, HG) in treatments compared with DMSO in female (B) and male (C) islets. Female islet HG secretion was significantly higher compared with control after 0- and 2-hour Tg pre-treatments (p = 0.0083 [0-hour] and p = 0.0371 [2-hour]; Mann Whitney test). Male islet HG secretion was significantly lower compared with control after a 4-hour Tg pre-treatment (p = 0.0013; Mann Whitney test). (D) Insulin content. Female islet insulin content was significantly higher compared with control after a 4-hour Tg pre-treatment (p = 0.0269; Mann Whitney test). (E) Proinsulin content. Female islet proinsulin content was significantly lower compared with control after a 2-hour Tg pre-treatment (p = 0.0437; Mann Whitney test). Male islet proinsulin content was significantly lower compared with control after 2- and 4-hour Tg pre-treatments (p = 0.0014 [2-hour] and p = 0.0005 [4-hour]; Mann Whitney test). (F–H) Physiology measurements after a 6-hour fast in 20-week-old male and female B6 mice. (F, G) Insulin levels from glucose-stimulated insulin secretion tests (F: nM, G: % basal insulin) following a single glucose injection (2 g glucose/kg body weight, i.p). Area under the curve (AUC) calculations (n = 13 females, n = 18 males). (F) Insulin levels were significantly higher in male mice at 0 min and 30 min post injection (p = 0.0063 [0 min] and p = 0.0009 [30 min]; Student's t-test). AUC was significantly higher in males (p = 0.0159; Student's t-test). (G) Insulin levels (% baseline). Glucose-stimulated insulin secretion was significantly higher in female mice 15 min post injection (p = 0.0279; Student's t-test). (H) Glucose levels from glucose tolerance tests following a single glucose injection (2 g glucose/kg body weight). AUC calculations (n = 11 females, n = 11 males). For B-E, grey triangles indicate the concentration of insulin or proinsulin from five islets, black circles indicate the average values per mouse. ∗ indicates p < 0.05, ∗∗ indicates p < 0.01, ∗∗∗ indicates p < 0.001; ns indicates not significant; error bars indicate SEM.
Figure 5
Figure 5
Sex-specific transcriptomic and proteomic profiles following ER stress in mouse islets. (A) Principal component analysis (PCA) of RNAseq data from male and female mouse islets treated with DMSO or 1 μM Tg for 6- or 12-hours. (B) Spearman correlation depicting the variance for the first 5 principal components. (C) Top significantly enriched Reactome pathways from the top 1000 significantly differentially expressed genes (p-adj<0.01) for females and males that were upregulated or downregulated between 6 and 12 h of Tg treatment. Gene ratio is calculated as k/n, where k is the number of genes identified in each Reactome pathway, and n is the number of genes from the submitted gene list participating in any Reactome pathway. (D) Protein abundance from proteomics data of female and male mouse islets treated with DMSO or 1 μM Tg for 6 h. Top 45 differentially expressed proteins are shown (p < 0.05).

Similar articles

Cited by

References

    1. Parchami A., Kusha S. Effect of sex on histomorphometric properties of Langerhans islets in native chickens. Vet Res Forum. 2015;6(4):327–330. - PMC - PubMed
    1. Rideout E.J., Narsaiya M.S., Grewal S.S. The sex determination gene transformer regulates male-female differences in Drosophila body size. PLoS Genet. 2015 Dec 28;11(12) - PMC - PubMed
    1. Millington J.W., Brownrigg G.P., Chao C., Sun Z., Basner-Collins P.J., Wat L.W., et al. Female-biased upregulation of insulin pathway activity mediates the sex difference in Drosophila body size plasticity. Elife. 2021 Jan 15;10 - PMC - PubMed
    1. Stancill J.S., Osipovich A.B., Cartailler J.P., Magnuson M.A. Transgene-associated human growth hormone expression in pancreatic β-cells impairs identification of sex-based gene expression differences. Am J Physiol Endocrinol Metab. 2019 Feb 1;316(2):E196–E209. - PMC - PubMed
    1. Horie I., Abiru N., Eto M., Sako A., Akeshima J., Nakao T., et al. Sex differences in insulin and glucagon responses for glucose homeostasis in young healthy Japanese adults. J Diabetes Investig. 2018 Nov;9(6):1283–1287. - PMC - PubMed

Publication types

Grants and funding