

Hepatic pIgR-mediated secretion of IgA limits bacterial translocation and prevents ethanol-induced liver disease in mice
- PMID: 36690432
- PMCID: PMC10841342
- DOI: 10.1136/gutjnl-2022-328265
Hepatic pIgR-mediated secretion of IgA limits bacterial translocation and prevents ethanol-induced liver disease in mice
Abstract
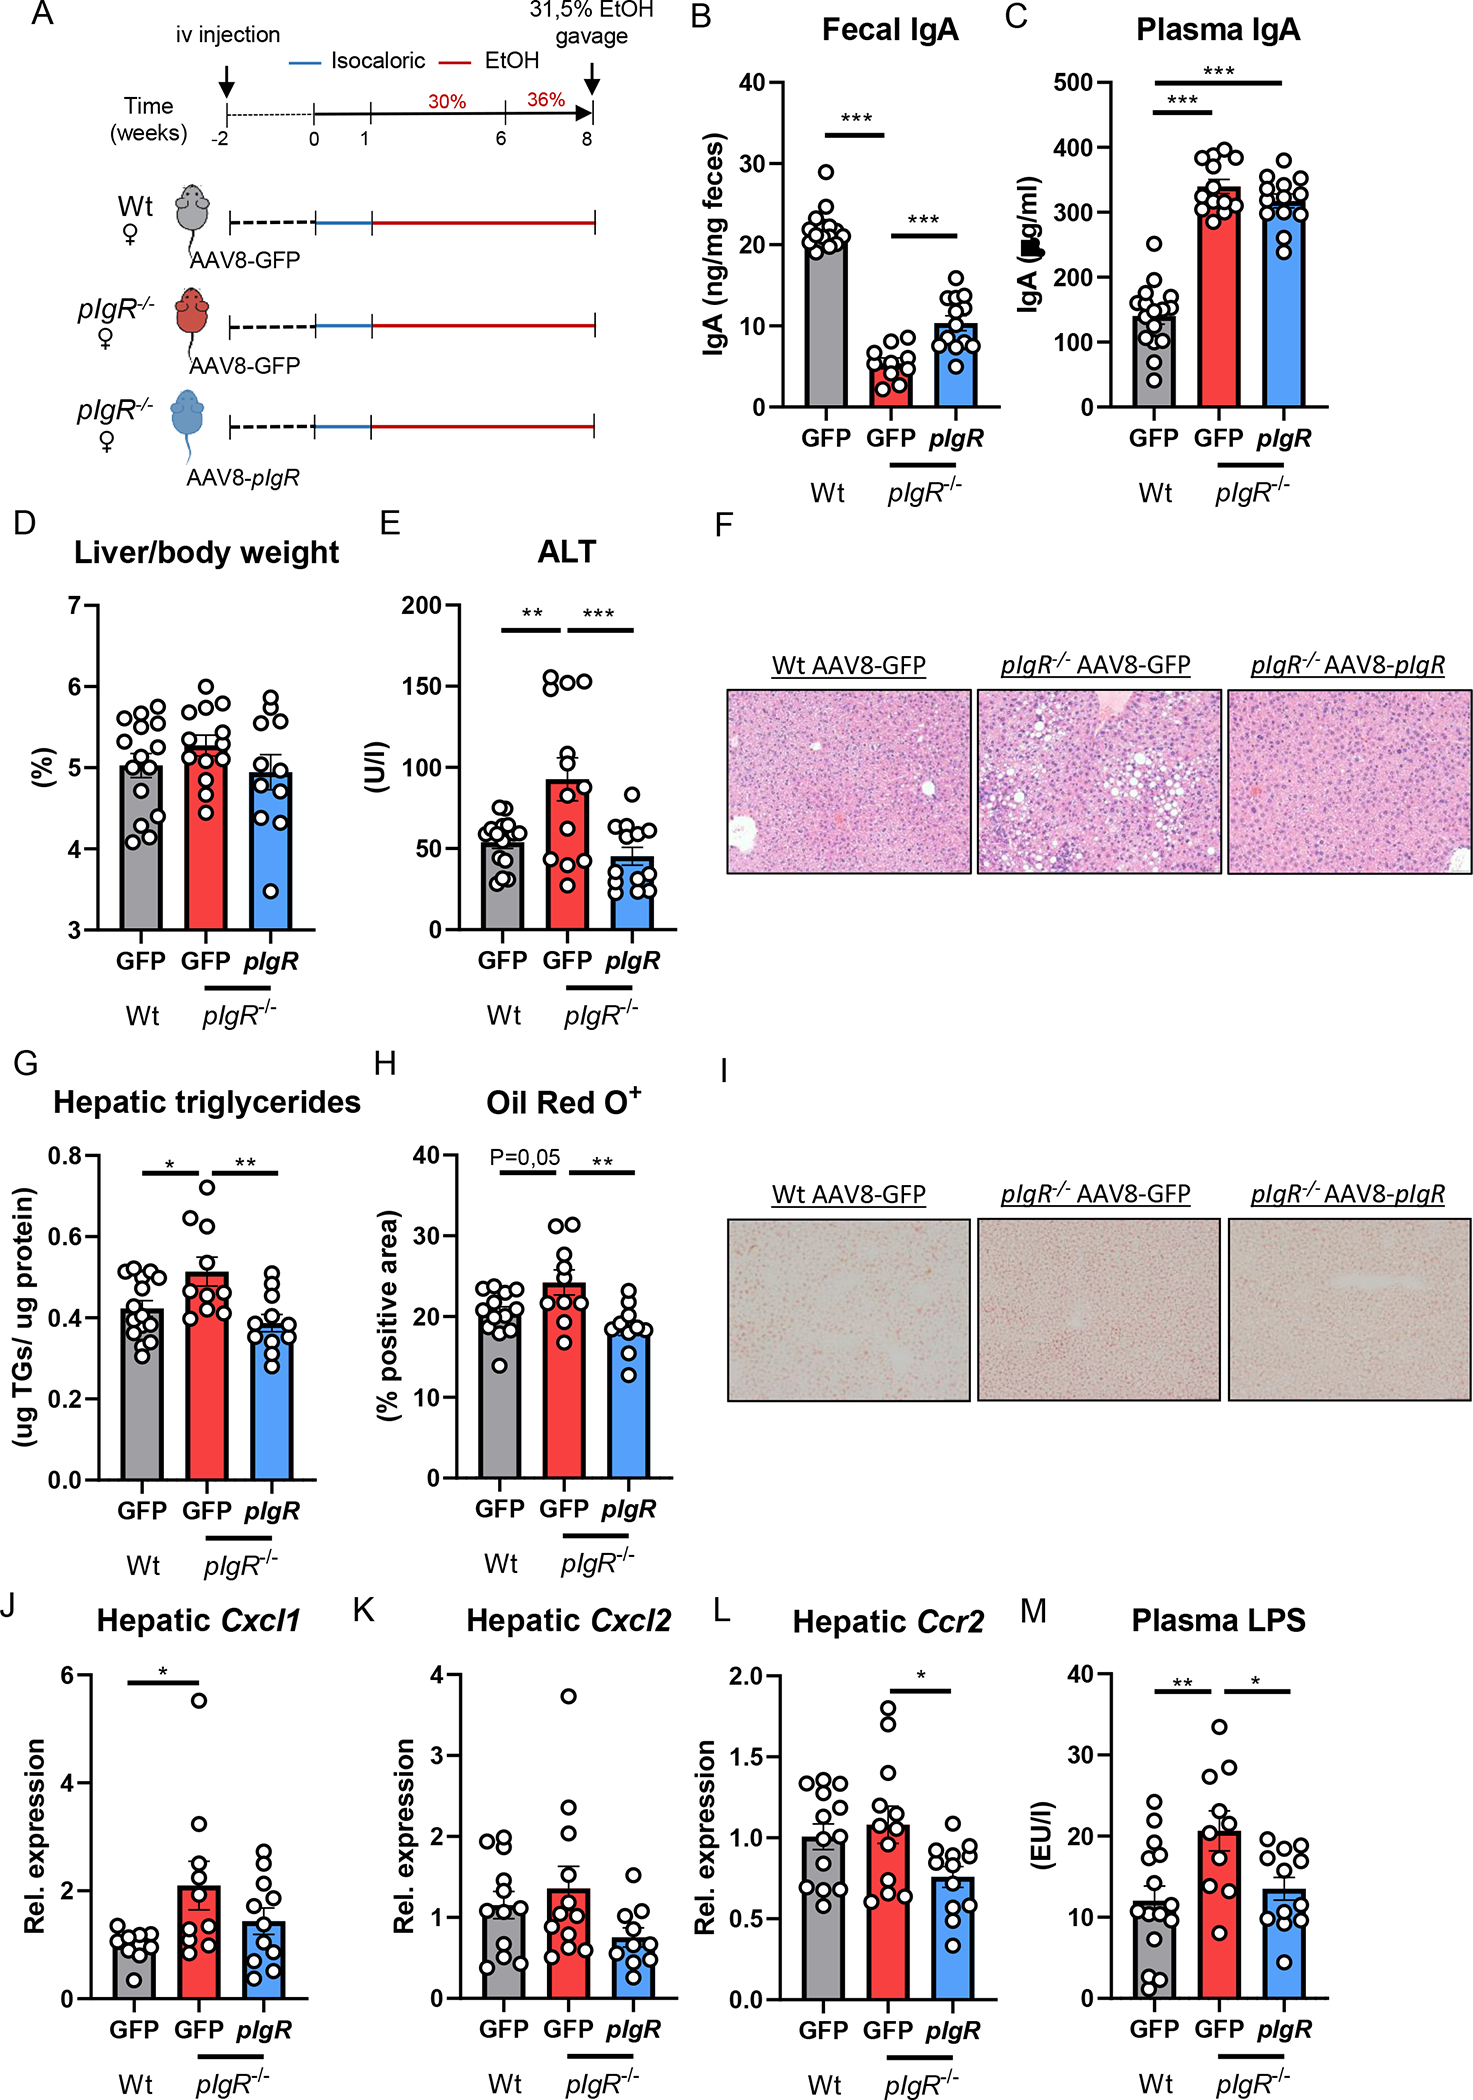
Objective: Alcohol-associated liver disease is accompanied by microbial dysbiosis, increased intestinal permeability and hepatic exposure to translocated microbial products that contribute to disease progression. A key strategy to generate immune protection against invading pathogens is the secretion of IgA in the gut. Intestinal IgA levels depend on the polymeric immunoglobulin receptor (pIgR), which transports IgA across the epithelial barrier into the intestinal lumen and hepatic canaliculi. Here, we aimed to address the function of pIgR during ethanol-induced liver disease.
Design: pIgR and IgA were assessed in livers from patients with alcohol-associated hepatitis and controls. Wild-type and pIgR-deficient (pIgR-/- ) littermates were subjected to the chronic-binge (NIAAA model) and Lieber-DeCarli feeding model for 8 weeks. Hepatic pIgR re-expression was established in pIgR-/- mice using adeno-associated virus serotype 8 (AAV8)-mediated pIgR expression in hepatocytes.
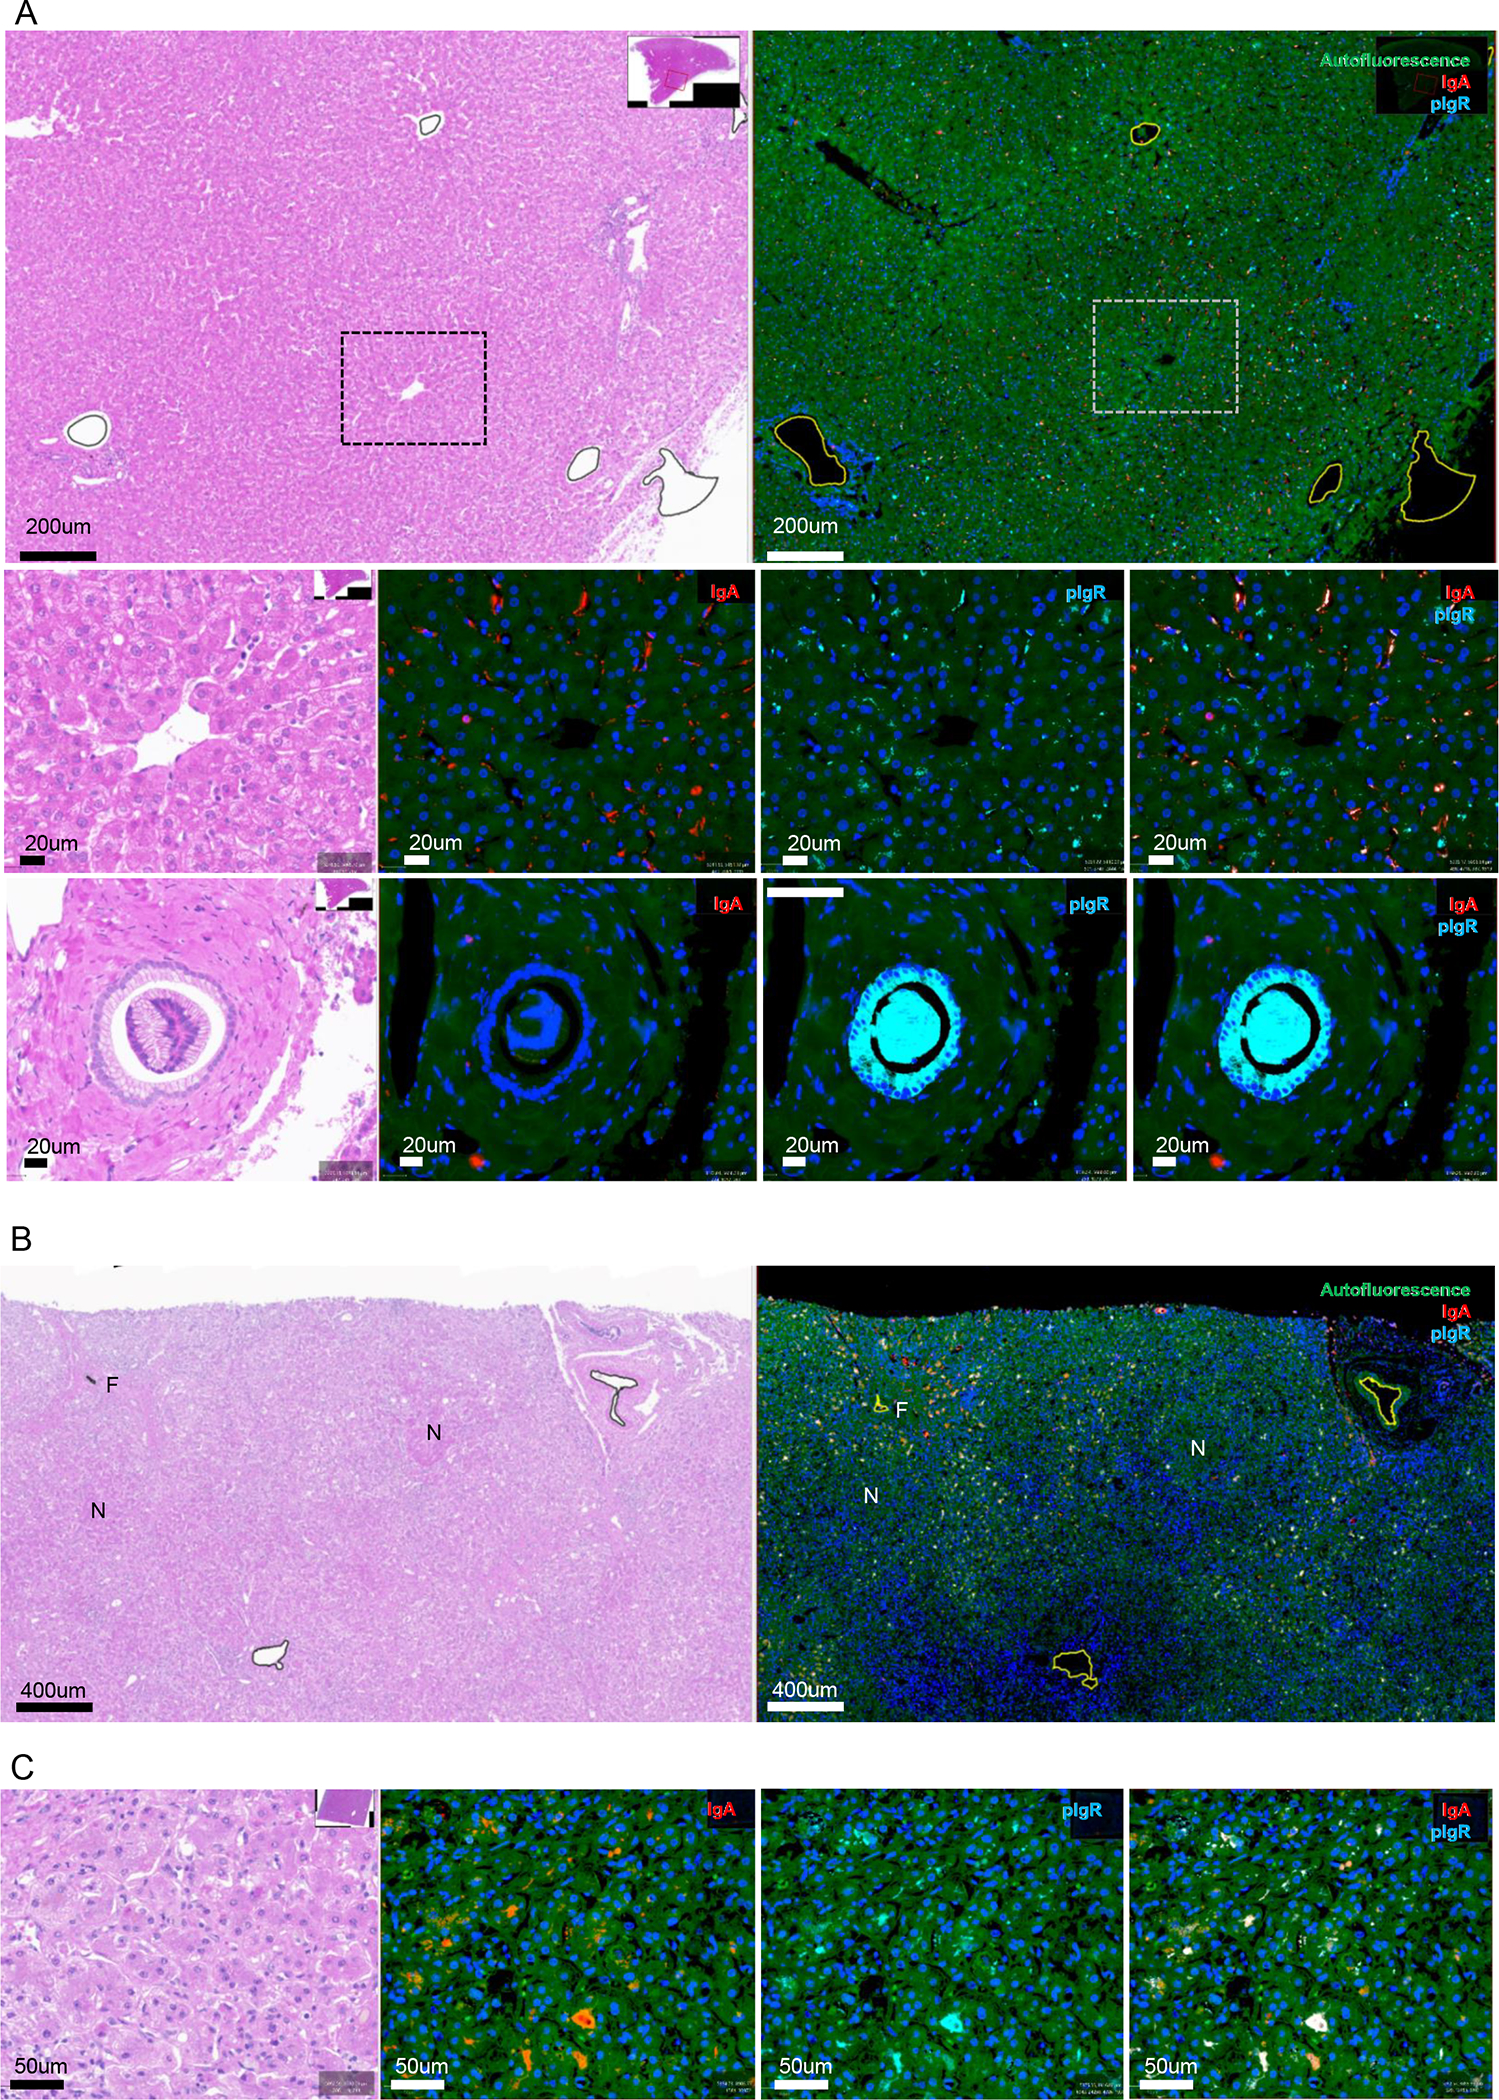
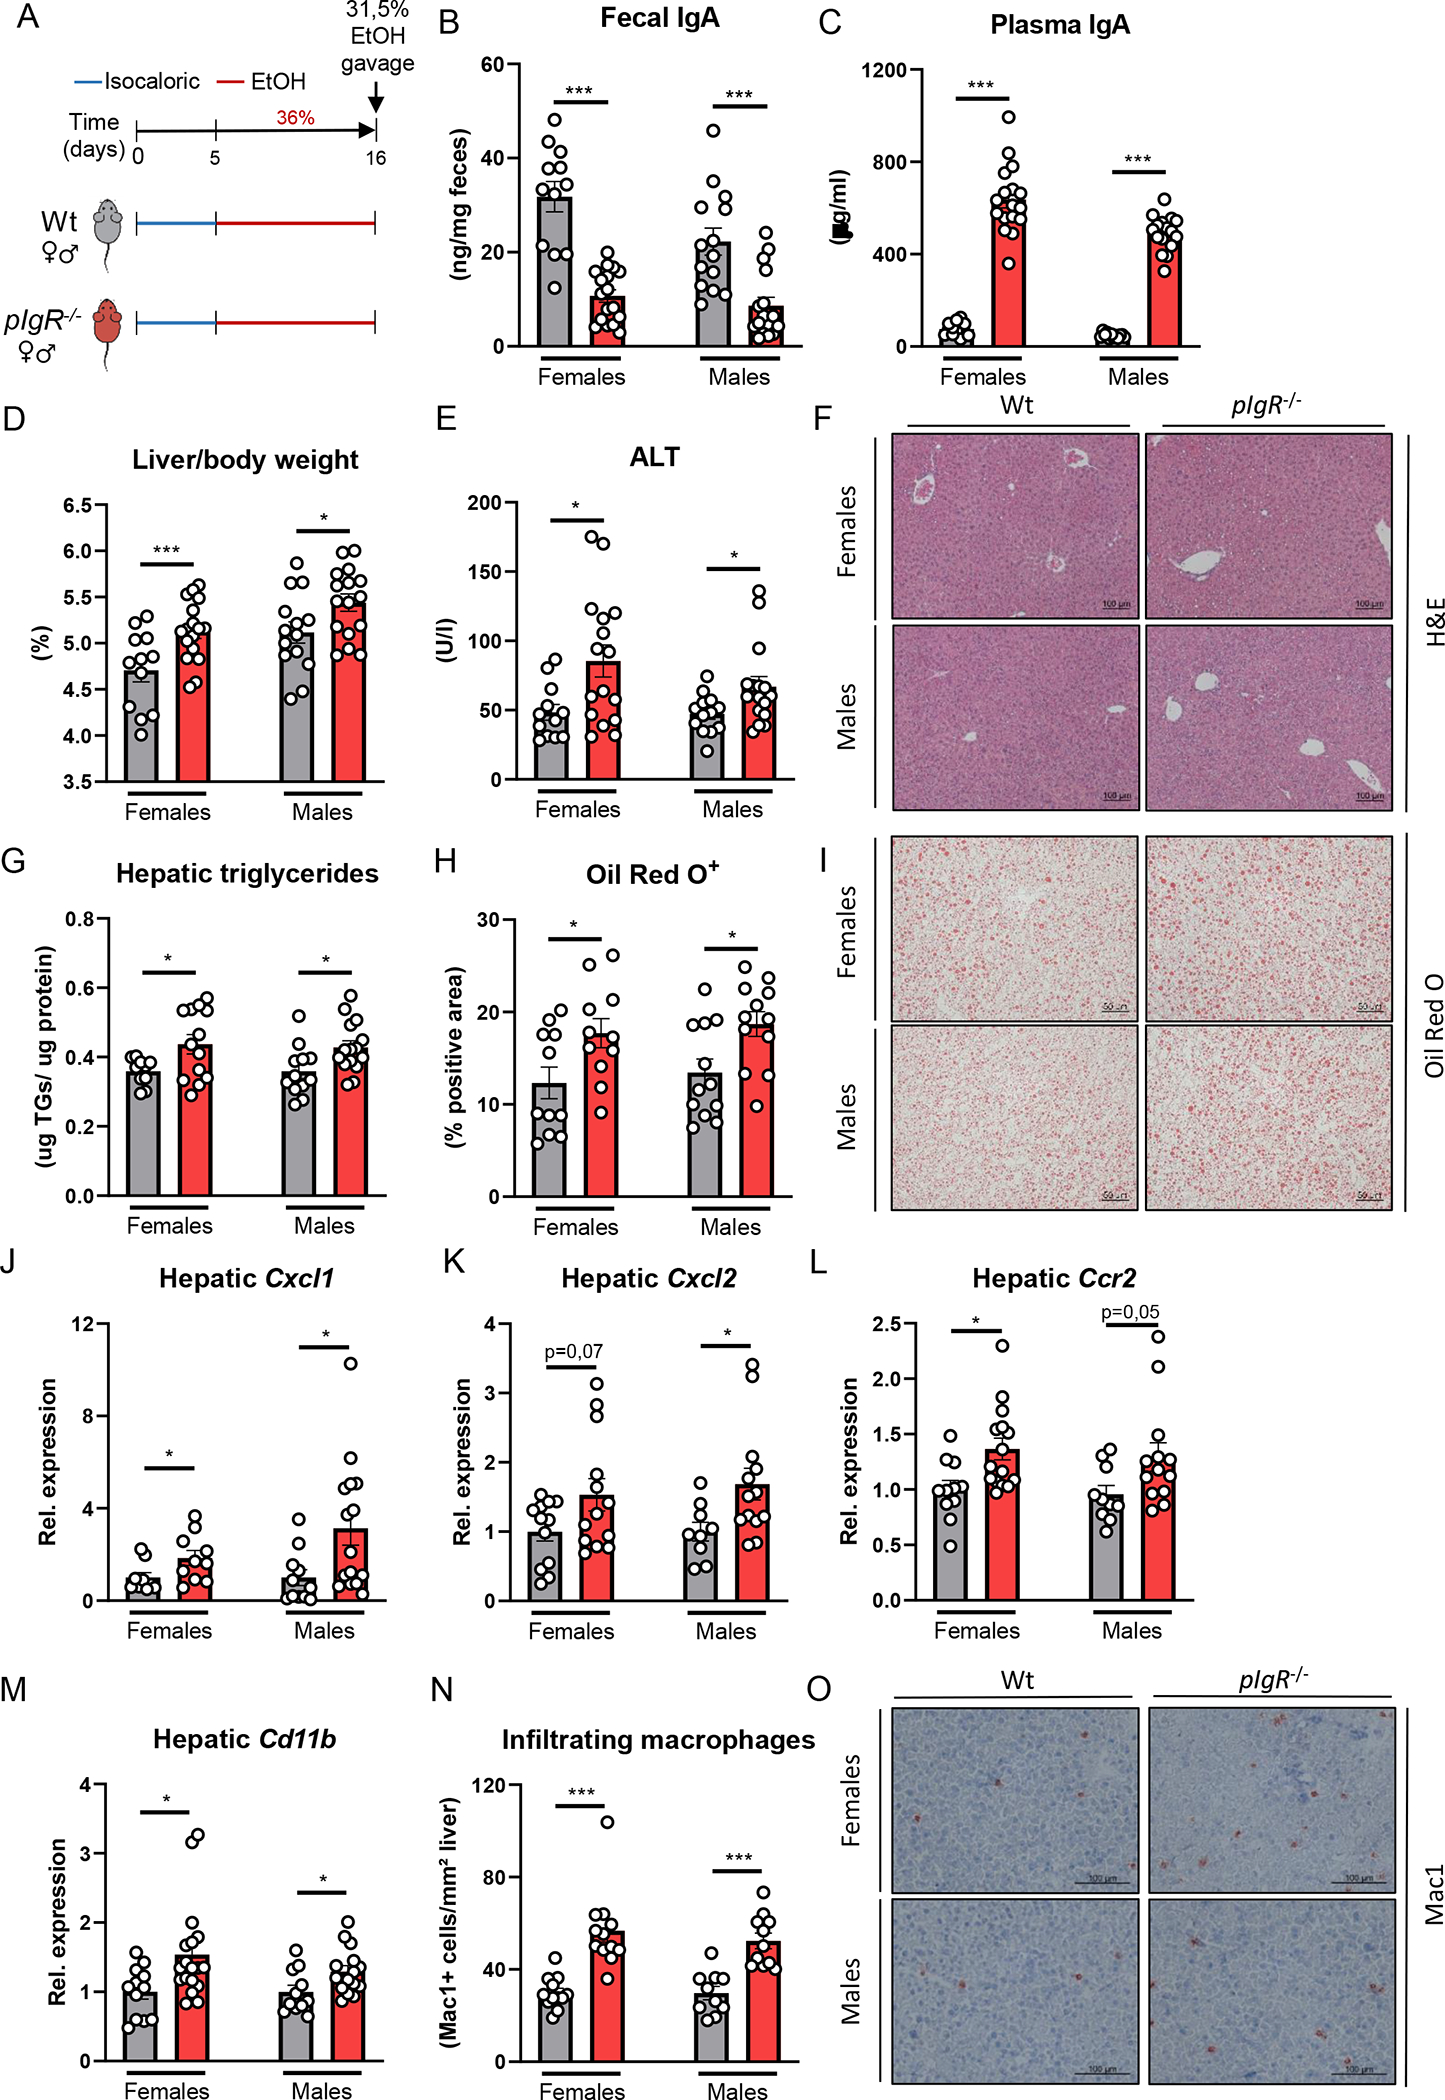
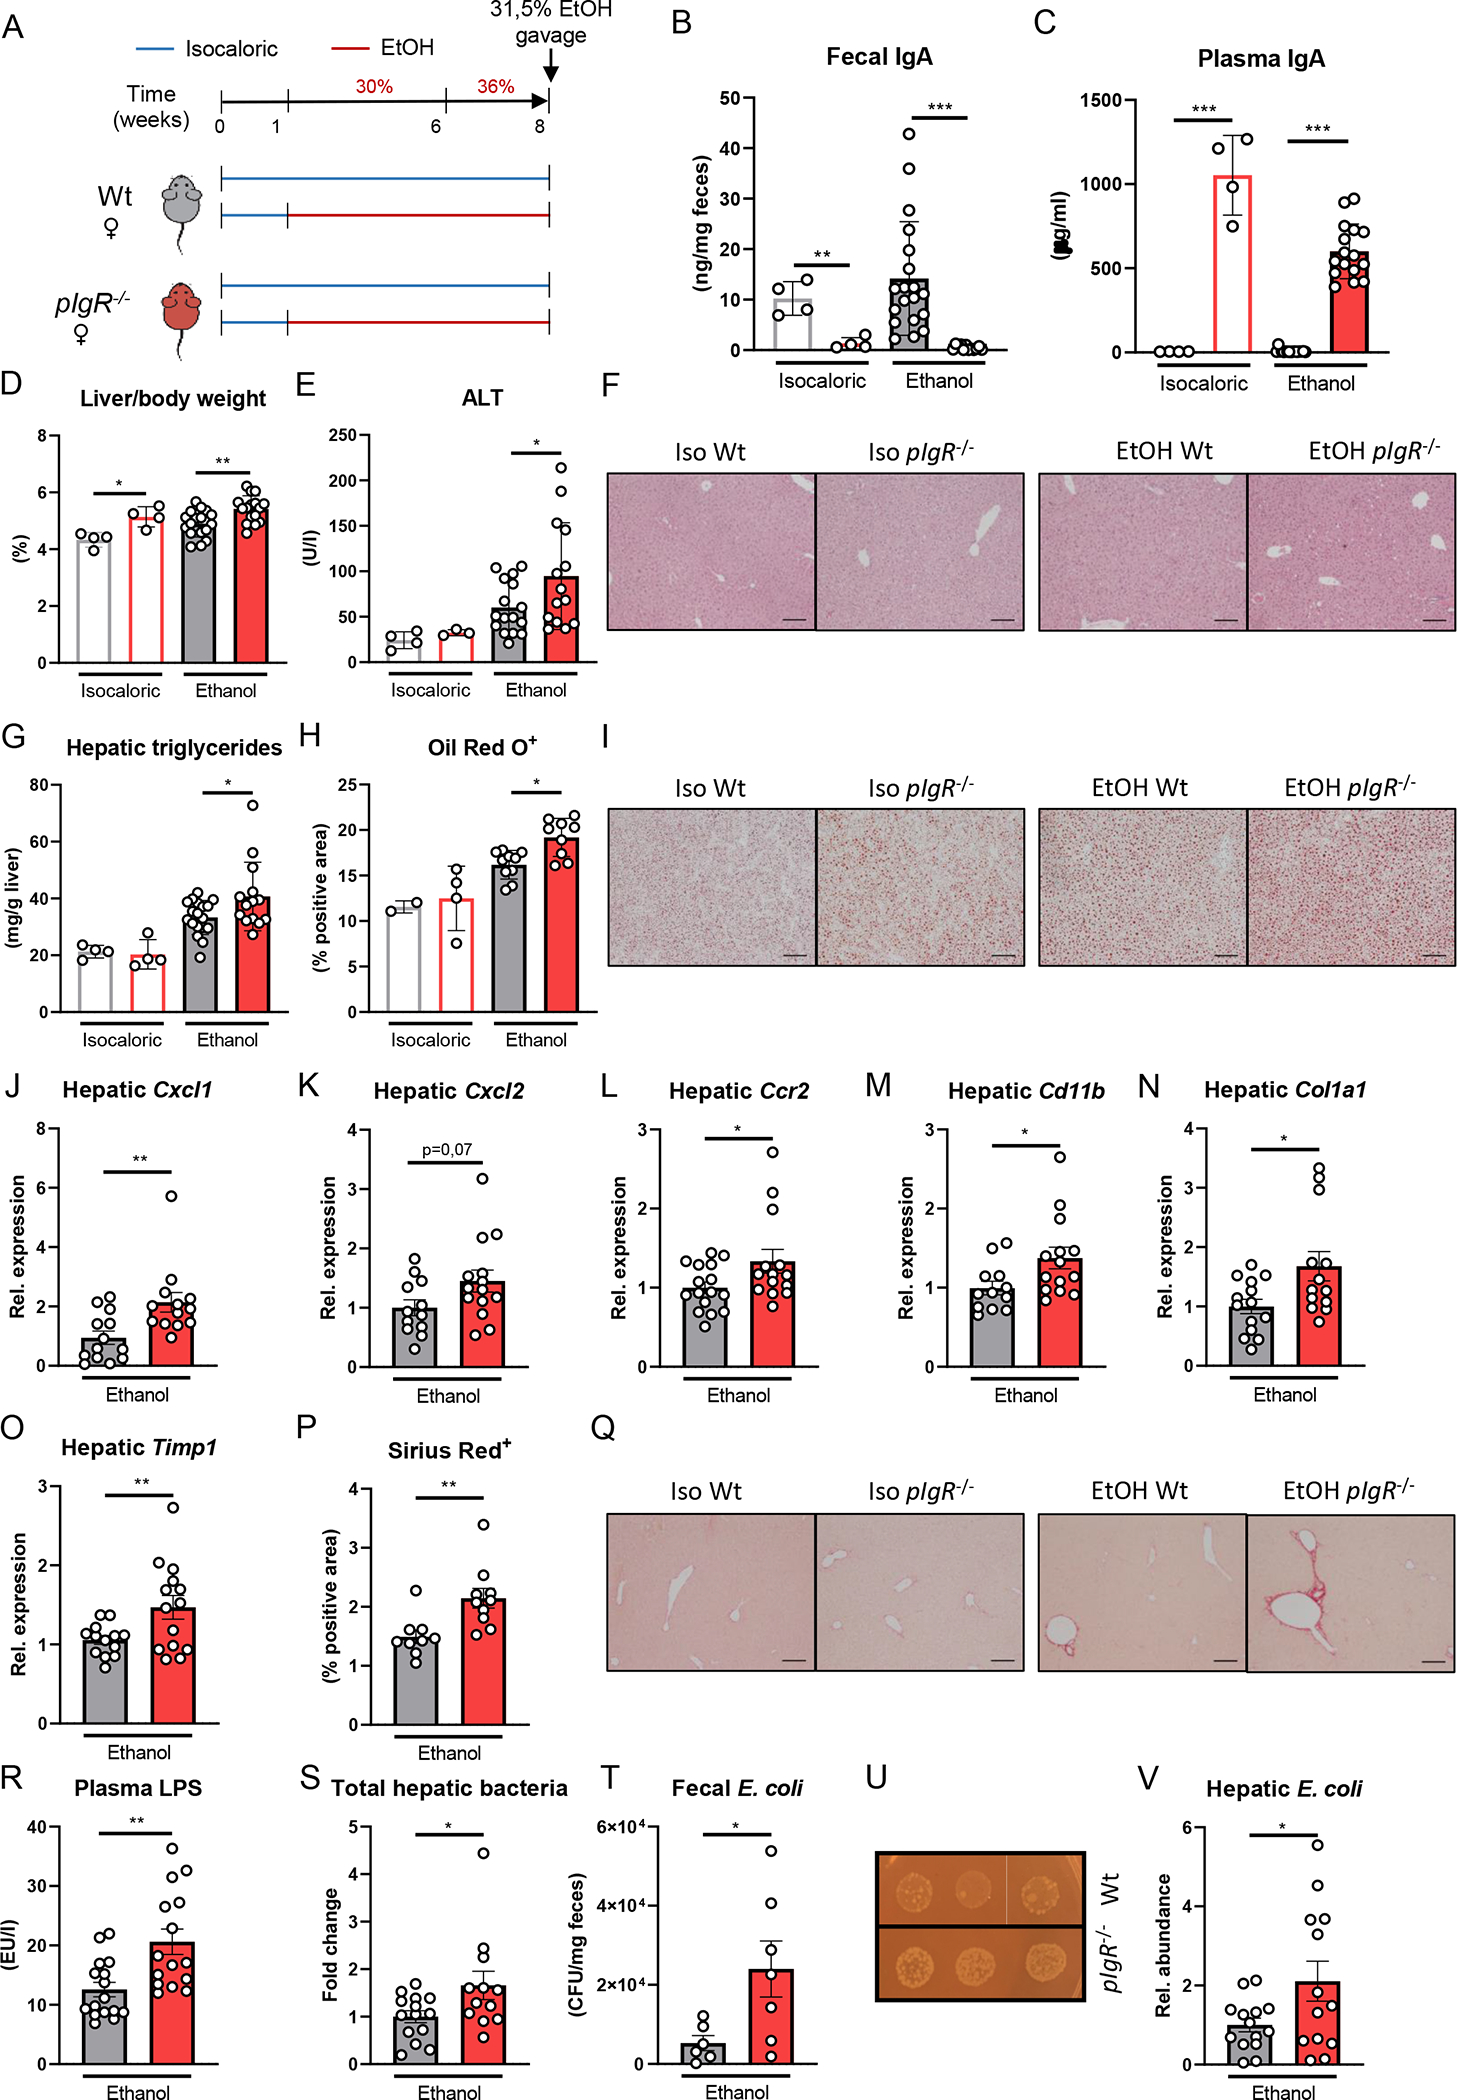
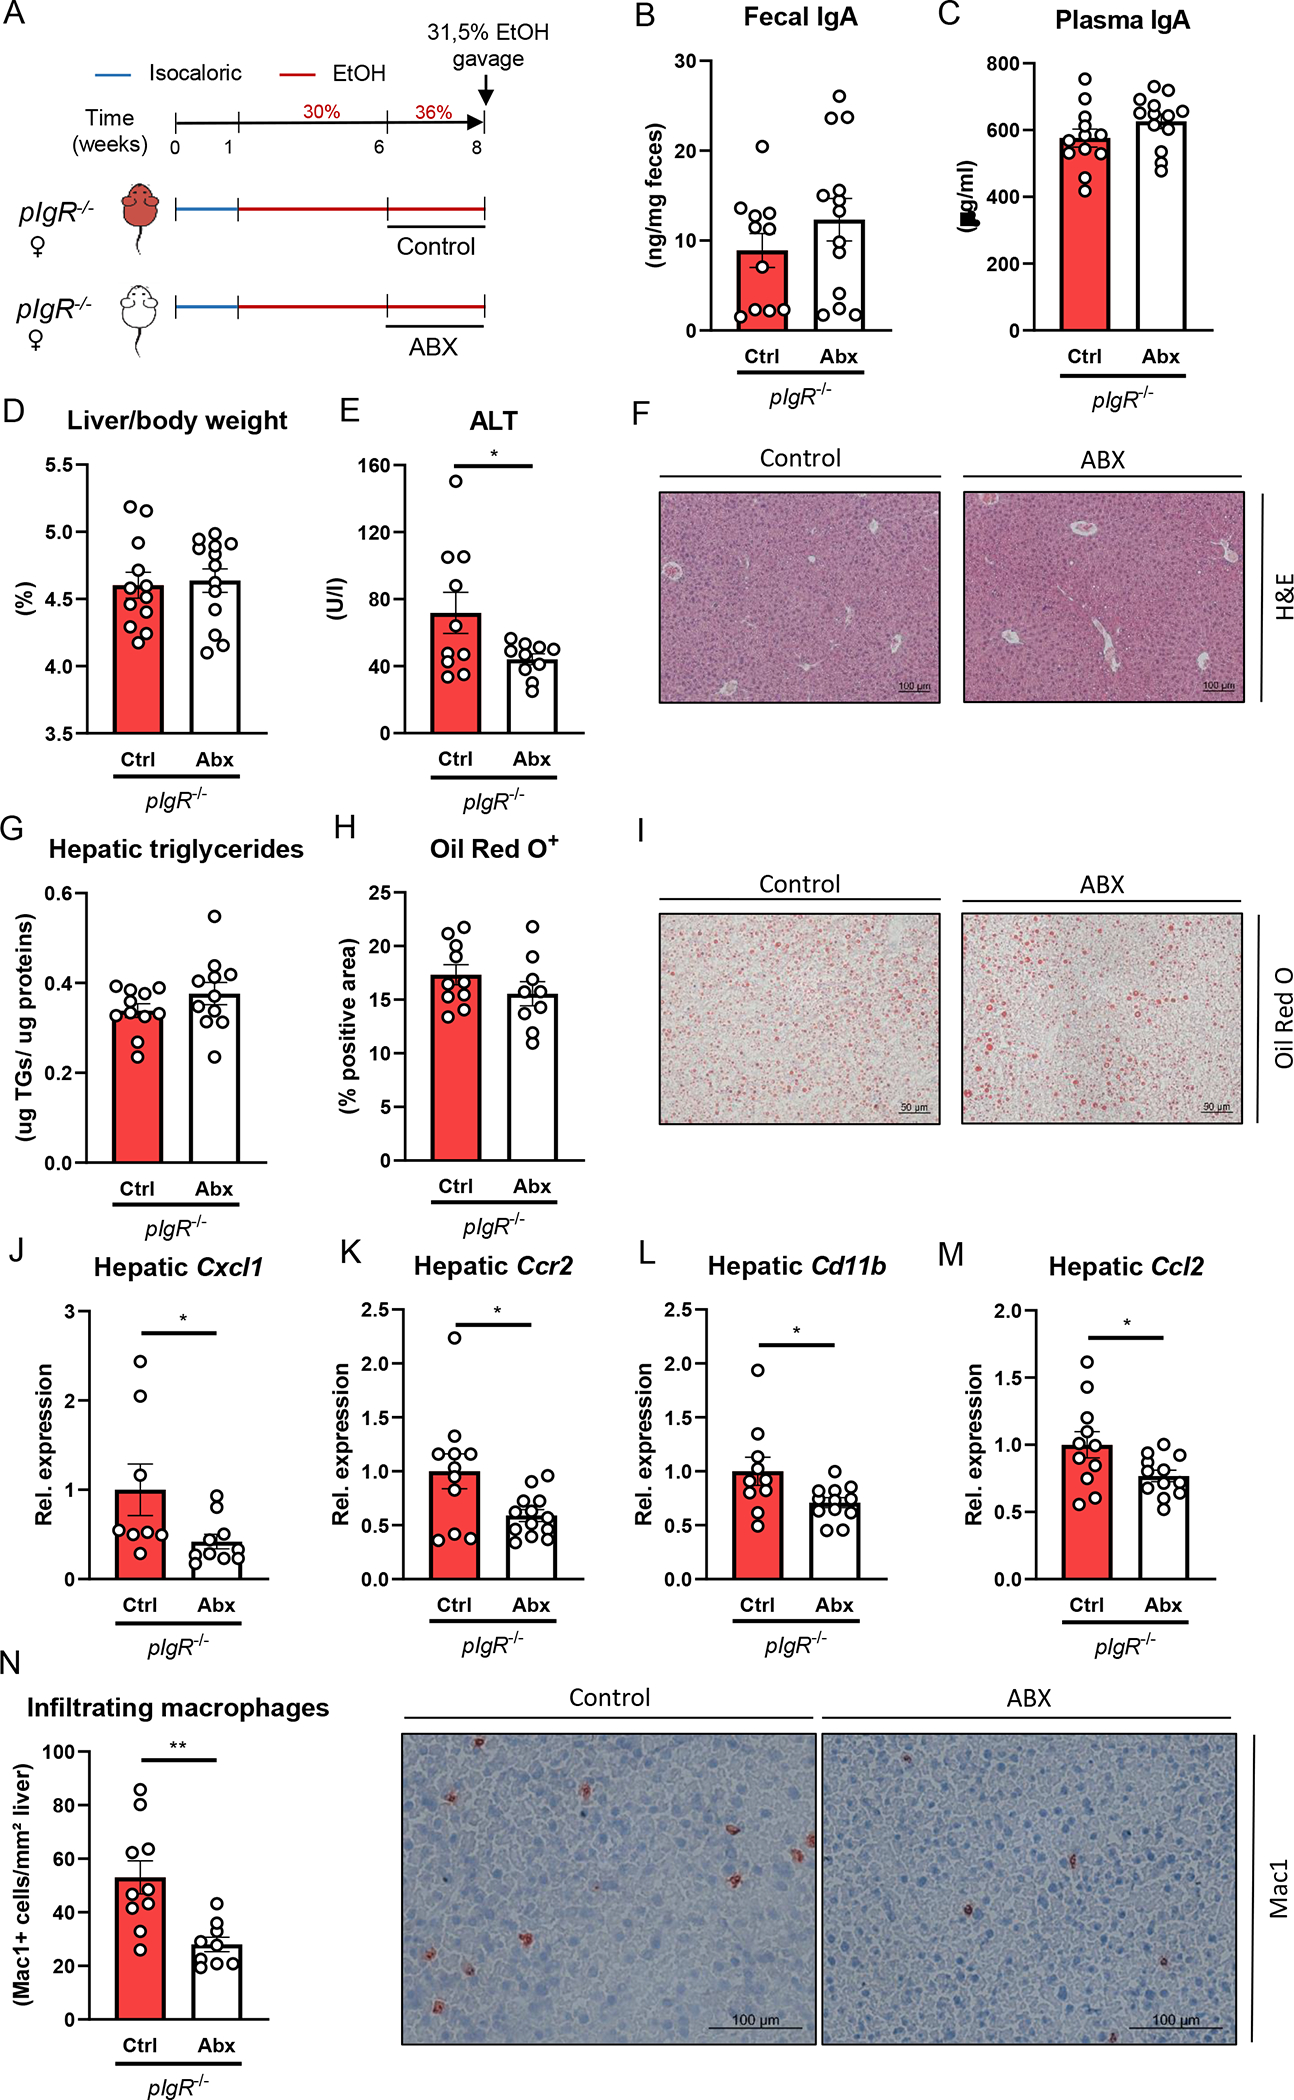
Results: Livers of patients with alcohol-associated hepatitis demonstrated an increased colocalisation of pIgR and IgA within canaliculi and apical poles of hepatocytes. pIgR-deficient mice developed increased liver injury, steatosis and inflammation after ethanol feeding compared with wild-type littermates. Furthermore, mice lacking pIgR demonstrated increased plasma lipopolysaccharide levels and more hepatic bacteria, indicating elevated bacterial translocation. Treatment with non-absorbable antibiotics prevented ethanol-induced liver disease in pIgR-/- mice. Injection of AAV8 expressing pIgR into pIgR-/- mice prior to ethanol feeding increased intestinal IgA levels and ameliorated ethanol-induced steatohepatitis compared with pIgR-/- mice injected with control-AAV8 by reducing bacterial translocation.
Conclusion: Our results highlight that dysfunctional hepatic pIgR enhances alcohol-associated liver disease due to impaired antimicrobial defence by IgA in the gut.
Keywords: alcoholic liver disease; immune-mediated liver damage; liver immunology; mucosal immunology.
© Author(s) (or their employer(s)) 2023. No commercial re-use. See rights and permissions. Published by BMJ.
Conflict of interest statement
Competing interests: BS has been consulting for Ambys Medicines, Ferring Research Institute, Gelesis, HOST Therabiomics, Intercept Pharmaceuticals, Mabwell Therapeutics, Patara Pharmaceuticals and Takeda. BS is founder of Nterica Bio. UC San Diego has filed several patents with BS as inventor related to this work. BS’s institution UC San Diego has received research support from Artizan Biosciences, Axial Biotherapeutics, BiomX, CymaBay Therapeutics, NGM Biopharmaceuticals, Prodigy Biotech and Synlogic Operating Company.
Figures
Comment in
-
New insights into an old paradigm: why IgA accumulates in alcoholic liver disease and what could be its role.Gut. 2023 Oct;72(10):1812-1814. doi: 10.1136/gutjnl-2022-329415. Epub 2023 Mar 10. Gut. 2023. PMID: 36898829 No abstract available.
Similar articles
-
Genetic Loss of Immunoglobulin A Does Not Influence Development of Alcoholic Steatohepatitis in Mice.Alcohol Clin Exp Res. 2016 Dec;40(12):2604-2613. doi: 10.1111/acer.13239. Epub 2016 Oct 14. Alcohol Clin Exp Res. 2016. PMID: 27739086 Free PMC article.
-
Polymeric immunoglobulin receptor deficiency exacerbates autoimmune hepatitis by inducing intestinal dysbiosis and barrier dysfunction.Cell Death Dis. 2023 Jan 28;14(1):68. doi: 10.1038/s41419-023-05589-3. Cell Death Dis. 2023. PMID: 36709322 Free PMC article.
-
Differences in Bacterial Translocation and Liver Injury in Ethanol Versus Diet-Induced Liver Disease.Dig Dis Sci. 2023 Jul;68(7):3059-3069. doi: 10.1007/s10620-023-07860-1. Epub 2023 Feb 20. Dig Dis Sci. 2023. PMID: 36807831 Free PMC article.
-
BTB and CNC homology 1 deficiency disrupts intestinal IgA secretion through regulation of polymeric immunoglobulin receptor expression.Am J Physiol Gastrointest Liver Physiol. 2024 Sep 1;327(3):G414-G423. doi: 10.1152/ajpgi.00215.2023. Epub 2024 Jul 9. Am J Physiol Gastrointest Liver Physiol. 2024. PMID: 38981617
-
Role of Polymeric Immunoglobulin Receptor in IgA and IgM Transcytosis.Int J Mol Sci. 2021 Feb 25;22(5):2284. doi: 10.3390/ijms22052284. Int J Mol Sci. 2021. PMID: 33668983 Free PMC article. Review.
Cited by
-
The role of brain-liver-gut Axis in neurological disorders.Burns Trauma. 2025 May 2;13:tkaf011. doi: 10.1093/burnst/tkaf011. eCollection 2025. Burns Trauma. 2025. PMID: 40321299 Free PMC article. Review.
-
Blood metabolites as mediators in erectile dysfunction: insights from a multi-center proteomics and genetic study.Front Pharmacol. 2025 Jun 2;16:1568780. doi: 10.3389/fphar.2025.1568780. eCollection 2025. Front Pharmacol. 2025. PMID: 40529500 Free PMC article.
-
Chronic-binge ethanol feeding aggravates systemic dyslipidemia in Ldlr-/- mice, thereby accelerating hepatic fibrosis.Front Endocrinol (Lausanne). 2023 Jul 25;14:1148827. doi: 10.3389/fendo.2023.1148827. eCollection 2023. Front Endocrinol (Lausanne). 2023. PMID: 37560305 Free PMC article.
-
Clinical Presentation, Pathological Spectrum, and Outcomes of Alcoholic Cirrhosis-Related Immunoglobulin A Nephropathy.Kidney Int Rep. 2024 Feb 16;9(5):1369-1378. doi: 10.1016/j.ekir.2024.02.1397. eCollection 2024 May. Kidney Int Rep. 2024. PMID: 38707818 Free PMC article.
-
Effects of flora deficiency on the structure and function of the large intestine.iScience. 2024 Jan 17;27(2):108941. doi: 10.1016/j.isci.2024.108941. eCollection 2024 Feb 16. iScience. 2024. PMID: 38333708 Free PMC article.
References
-
- Seitz HK, Bataller R, Cortez-Pinto H, Gao B, Gual A, Lackner C, et al. Alcoholic liver disease. Nat Rev Dis Primers 2018;4:16. - PubMed
-
- Serste T, Cornillie A, Njimi H, Pavesi M, Arroyo V, Putignano A, et al. The prognostic value of acute-on-chronic liver failure during the course of severe alcoholic hepatitis. J Hepatol 2018;69:318–24. - PubMed
-
- Bajaj JS. Alcohol, liver disease and the gut microbiota. Nat Rev Gastroenterol Hepatol 2019;16:235–46. - PubMed
-
- Louvet A, Mathurin P. Alcoholic liver disease: mechanisms of injury and targeted treatment. Nat Rev Gastroenterol Hepatol 2015;12:231–42. - PubMed
Publication types
MeSH terms
Substances
Grants and funding
LinkOut - more resources
Full Text Sources
Medical
Molecular Biology Databases
Miscellaneous