. 2023 Jan 23;14(1):167.
doi: 10.1038/s41467-023-35804-w.

The transcription factor ATF3 switches cell death from apoptosis to necroptosis in hepatic steatosis in male mice

Affiliations

The transcription factor ATF3 switches cell death from apoptosis to necroptosis in hepatic steatosis in male mice

Yuka Inaba et al. Nat Commun. .

Abstract

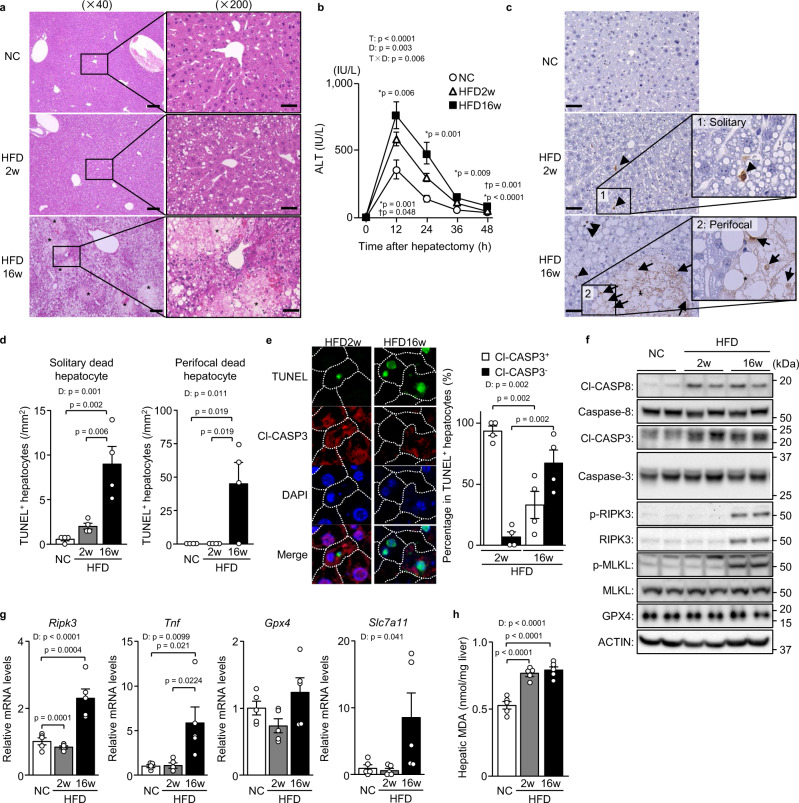
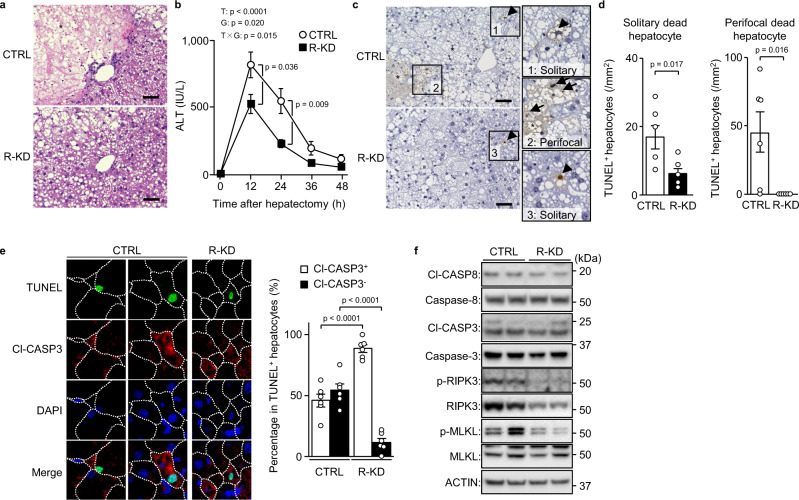
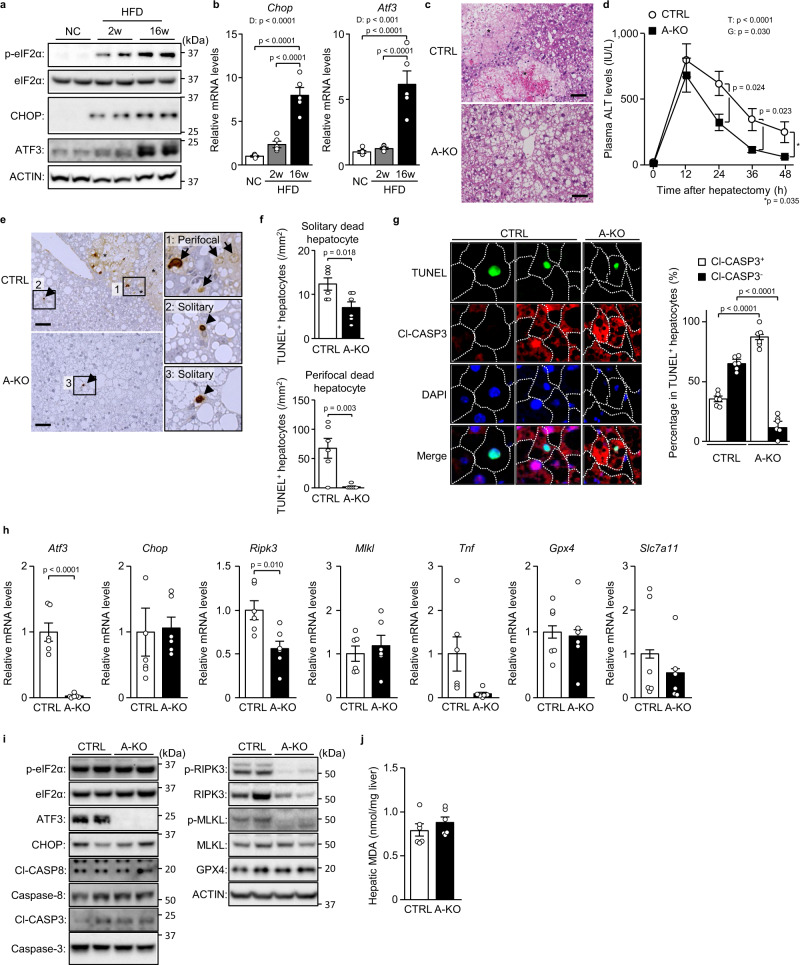
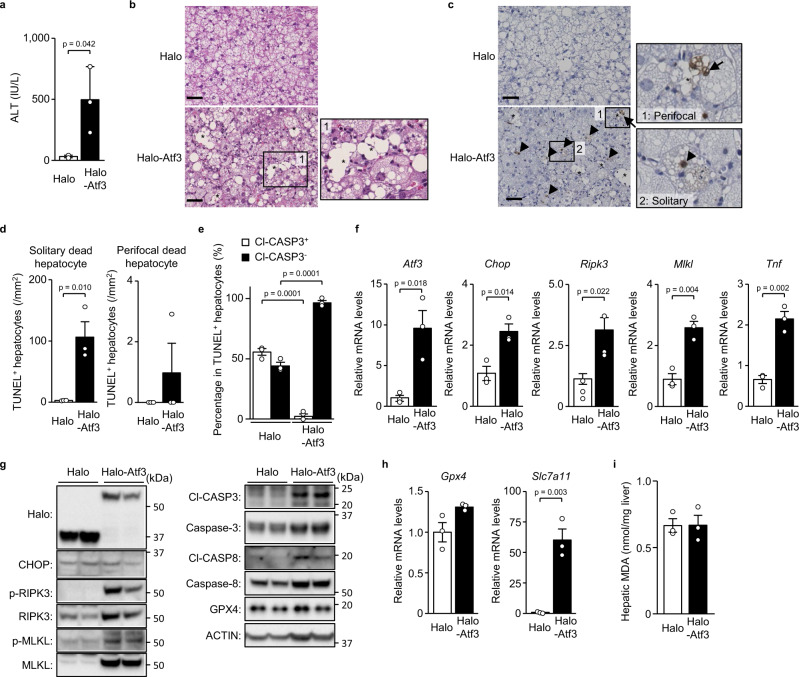
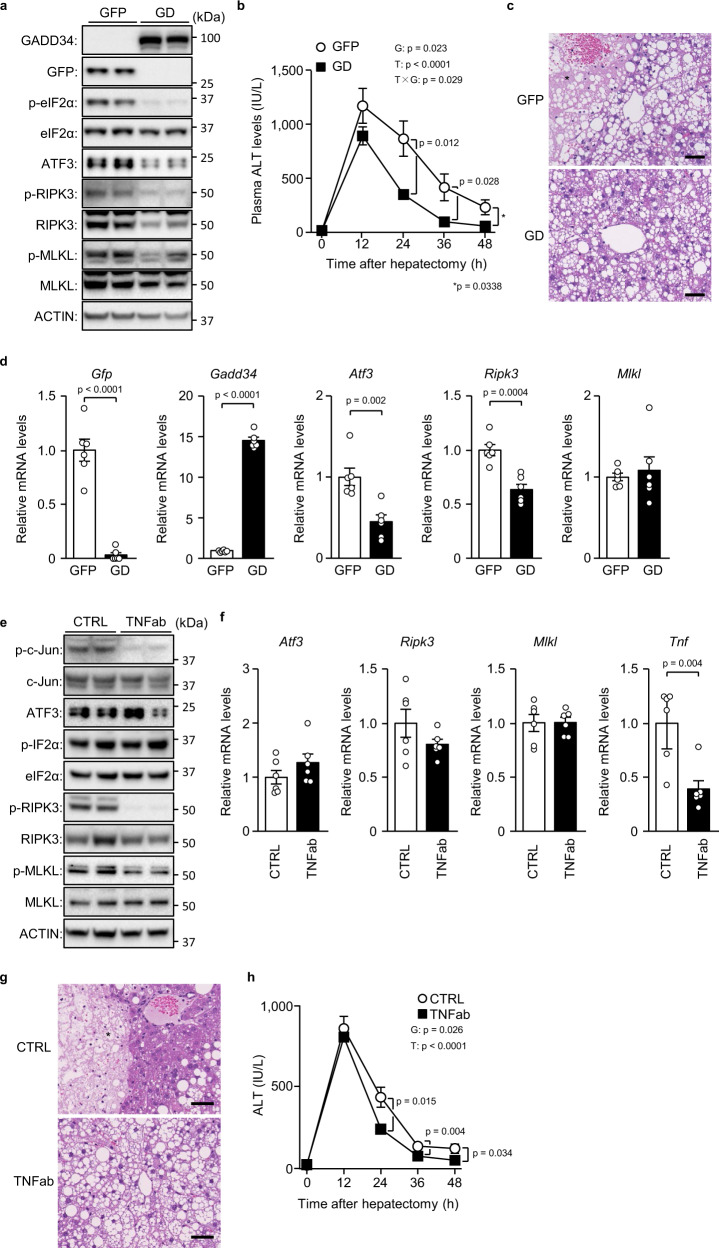
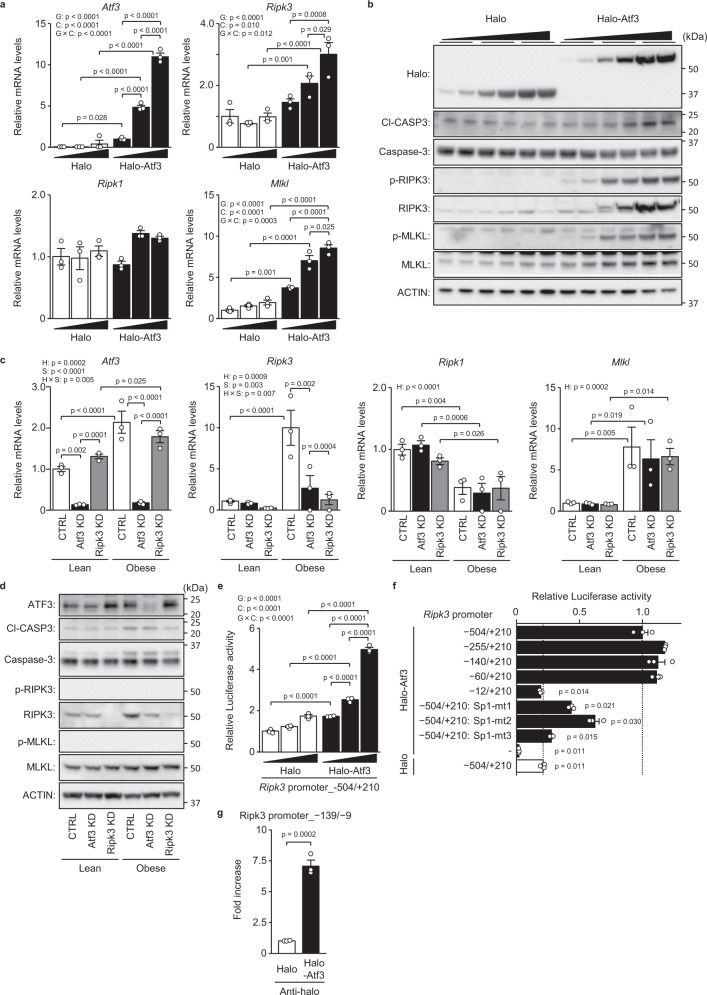
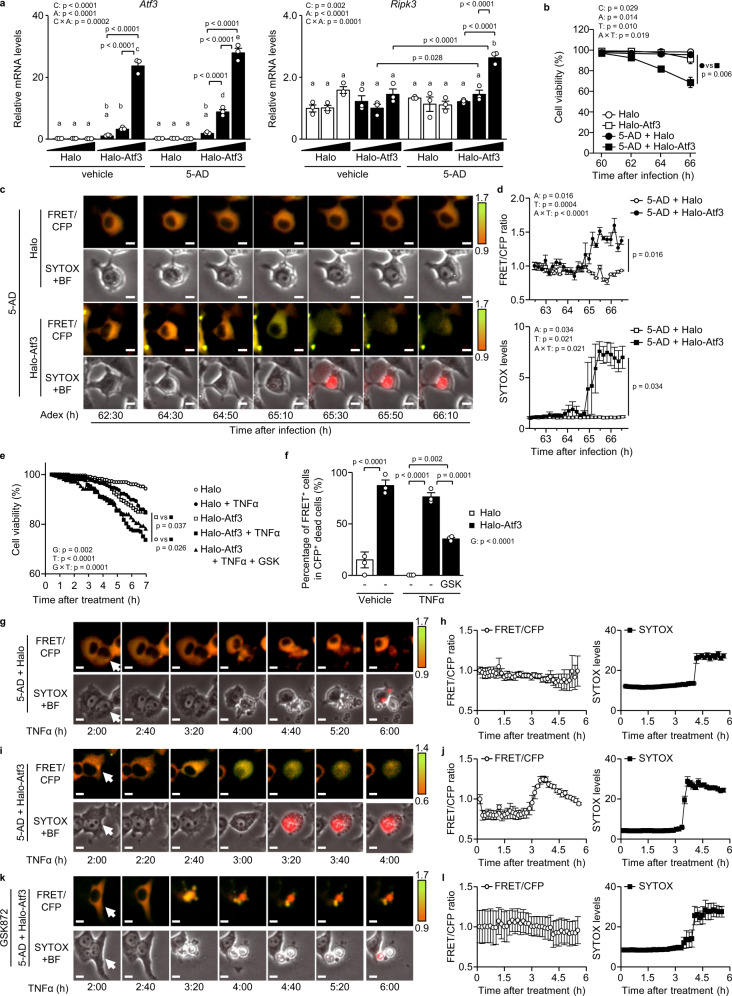
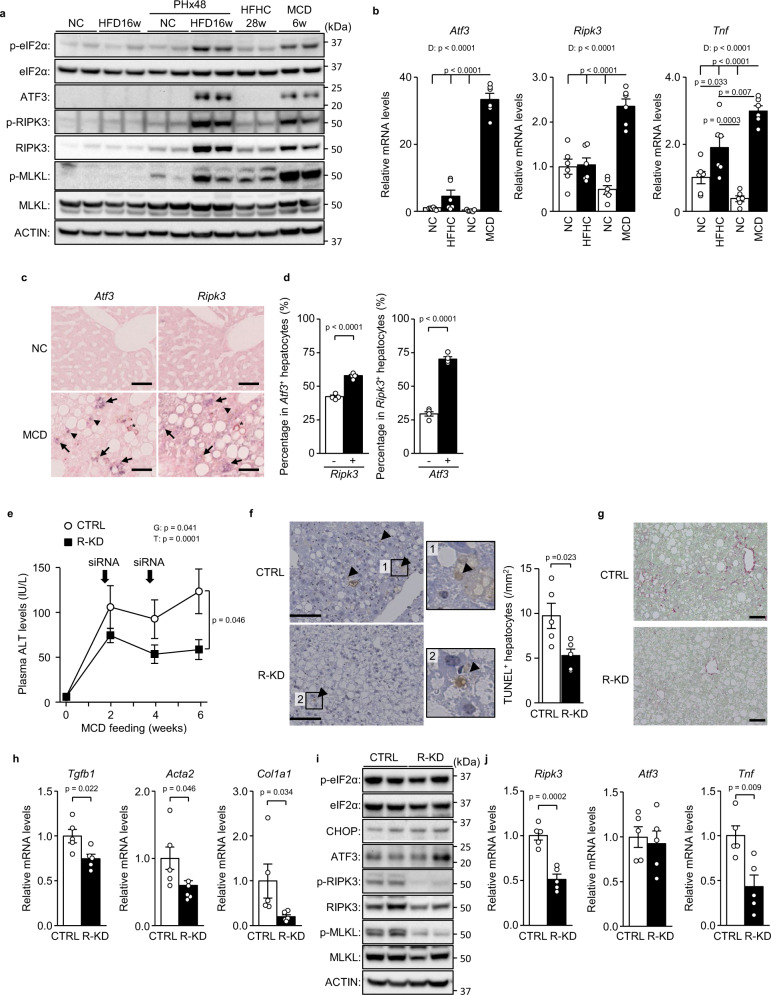
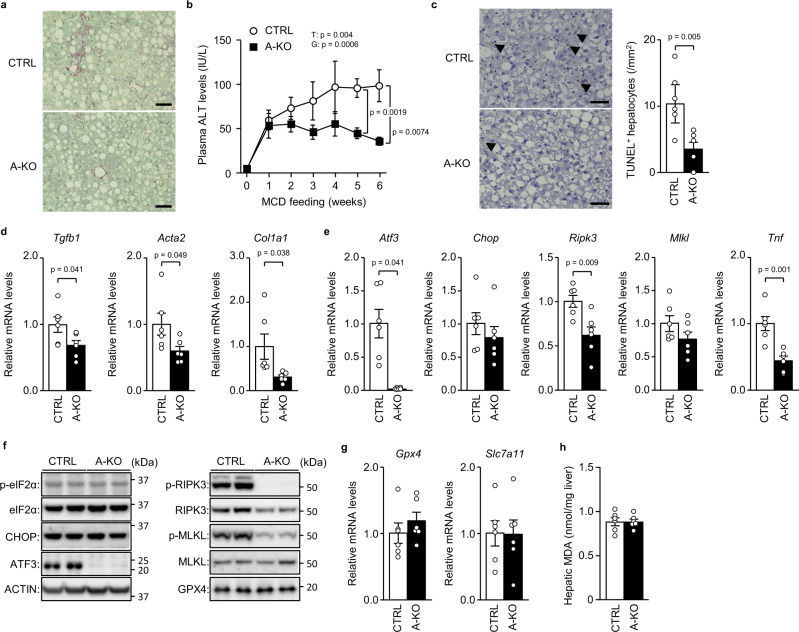
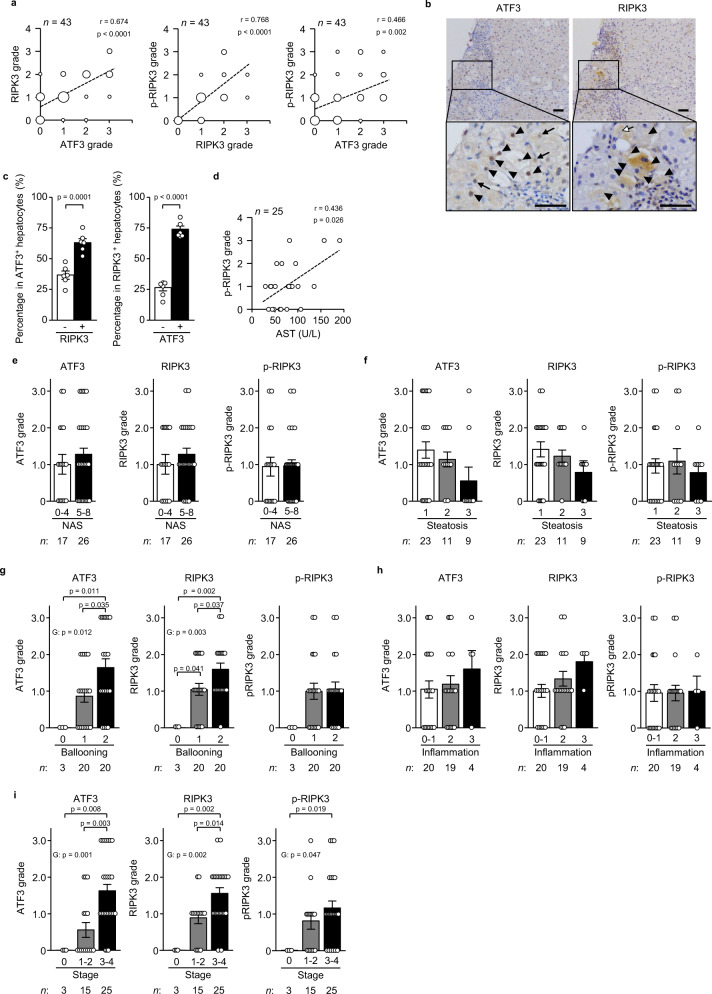
Hepatocellular death increases with hepatic steatosis aggravation, although its regulation remains unclear. Here we show that hepatic steatosis aggravation shifts the hepatocellular death mode from apoptosis to necroptosis, causing increased hepatocellular death. Our results reveal that the transcription factor ATF3 acts as a master regulator in this shift by inducing expression of RIPK3, a regulator of necroptosis. In severe hepatic steatosis, after partial hepatectomy, hepatic ATF3-deficient or -overexpressing mice display decreased or increased RIPK3 expression and necroptosis, respectively. In cultured hepatocytes, ATF3 changes TNFα-dependent cell death mode from apoptosis to necroptosis, as revealed by live-cell imaging. In non-alcoholic steatohepatitis (NASH) mice, hepatic ATF3 deficiency suppresses RIPK3 expression and hepatocellular death. In human NASH, hepatocellular damage is correlated with the frequency of hepatocytes expressing ATF3 or RIPK3, which overlap frequently. ATF3-dependent RIPK3 induction, causing a modal shift of hepatocellular death, can be a therapeutic target for steatosis-induced liver damage, including NASH.


Conflict of interest statement

The authors declare no competing interests.

Figures

Fig. 1
Fig. 1. Non-apoptotic cell death is increased in severe steatosis after hepatectomy.
Mice fed normal chow (NC) or a HFD for 2 or 16 weeks underwent partial hepatectomy. a Haematoxylin-eosin staining. Scale bars, 50 μm (left) and 200 μm (right). Asterisks indicate hepatocellular death foci. b Plasma ALT levels. * indicates p-values for HFD16w versus NC; indicates p-values for HFD16w versus HFD2w. c TUNEL staining. Scale bar, 50 μm. Arrowheads indicate solitary dead hepatocytes. Asterisks indicate hepatocellular death foci. Arrows indicate perifocal dead hepatocytes. d Number of TUNEL+ hepatocytes defined as described. e TUNEL/Cl-CASP3 double staining (left). Cl-CASP3+ or Cl-CASP3 hepatocytes as a percentage of TUNEL+ hepatocytes (right). f Immunoblot analysis. g Quantitative PCR analysis. h Hepatic MDA levels. Data are presented as the mean values ± SEM. [(b, fh) n = 5/group; (a and ce) n = 4/group, biologically independent samples]. Statistics: one-way repeated-measures ANOVA followed by Bonferroni’s multiple comparisons test (b), one-way ANOVA followed by Tukey’s multiple comparisons test (d, g, h), two-tailed Student’s t test (e). CTRL, control; T, time effect; D, diet effect; T×D, time and diet interaction. Source data are provided as a Source Data file.
Fig. 2
Fig. 2. Non-apoptotic cell death by necroptosis in severe steatosis after hepatectomy.
Mice fed a HFD for 16 weeks underwent Ripk3 knockdown (R-KD) and partial hepatectomy. a Haematoxylin-eosin staining. Scale bar, 50 μm. Asterisks indicate hepatocellular death foci. b Plasma ALT levels. c TUNEL staining. Scale bar, 50 μm. Arrowheads indicate solitary dead hepatocytes. Asterisks indicate hepatocellular death foci. Arrows indicate perifocal dead hepatocytes. d Number of TUNEL+ hepatocytes defined as described. e TUNEL/Cl-CASP3 double staining (left). Cl-CASP3+ or Cl-CASP3 hepatocytes as a percentage of TUNEL+ hepatocytes (right). f Immunoblot analysis. Data are presented as the mean values ± SEM. [n = 6/group, biologically independent samples]. Statistics: one-way repeated-measures ANOVA followed by Bonferroni’s multiple comparisons test (b), two-tailed Student’s t test (d, e). CTRL, control; T, time effect; G, group effect; T×G, time and group interaction. Source data are provided as a Source Data file.
Fig. 3
Fig. 3. ATF3 deficiency prevents steatosis-induced necroptosis after hepatectomy.
a, b Mice fed normal chow (NC) or a HFD for 2 or 16 weeks underwent partial hepatectomy. a Immunoblot analysis. b Quantitative PCR analysis. cj A-KO mice and littermates (CTRL) fed a HFD for 16 weeks underwent partial hepatectomy. c Haematoxylin-eosin staining. Scale bar, 50 μm. Asterisks indicate hepatocellular death foci. d Plasma ALT levels. e TUNEL staining. Scale bar, 50 μm. Arrowheads indicate solitary dead hepatocytes. Asterisks indicate hepatocellular death foci. Arrows indicate perifocal dead hepatocytes. f Number of TUNEL+ hepatocytes defined as described. g TUNEL/Cl-CASP3 double staining (left). Cl-CASP3+ or Cl-CASP3 hepatocytes as a percentage of TUNEL+ hepatocytes (right). h Quantitative PCR analysis. i Immunoblot analysis. j Hepatic MDA levels. Data are presented as the mean values ± SEM. [(a, b) n = 5/group; (cj) n = 6/group, biologically independent samples]. Statistics: one-way ANOVA followed by Tukey’s multiple comparisons test (b), one-way repeated-measures ANOVA followed by Bonferroni’s multiple comparisons test (d), two-tailed Student’s t test (fh, j). D, diet effect; T, time effect; G, group effect. Source data are provided as a Source Data file.
Fig. 4
Fig. 4. Atf3 overexpression increases necroptosis in un-hepatectomised severe steatosis.
Halo-Atf3 or halo was overexpressed by adenovirus in mice fed a HFD for 16 weeks. a Plasma ALT levels. b Haematoxylin-eosin staining. Scale bar, 50 μm. Asterisks indicate hepatocellular death foci. c TUNEL staining. Scale bar, 50 μm. Arrowheads indicate solitary dead hepatocytes. Asterisks indicate hepatocellular death foci. Arrows indicate perifocal dead hepatocytes. d Number of TUNEL+ hepatocytes defined as described. e Cl-CASP3+ or Cl-CASP3 hepatocytes as a percentage of TUNEL+ hepatocytes determined by TUNEL/Cl-CASP3 double staining. f Quantitative PCR analysis of genes related to the eIF2α signalling pathway and necroptosis. g Immunoblot analysis. h Quantitative PCR analysis of genes related to ferroptosis. i Hepatic MDA levels. Data are presented as the mean values ± SEM. [n = 3/group, biologically independent samples]. Statistics: two-tailed Student’s t test (a, df, h, i). Source data are provided as a Source Data file.
Fig. 5
Fig. 5. eIF2α dephosphorylation and TNFα neutralisation in hepatic steatosis after hepatectomy.
ad Mice with severe hepatic steatosis overexpressing GADD34 (GD) or GFP by recombinant adeno-associated virus (rAAV) underwent partial hepatectomy. a Immunoblot analysis. b Plasma ALT levels. c Haematoxylin-eosin staining. Scale bar, 50 μm. Asterisks indicate hepatocellular death foci. d Quantitative PCR analysis. eh Mice with severe hepatic steatosis underwent partial hepatectomy and were injected with TNFα-neutralising antibody (TNFab) or anti-IgG (CTRL) 12 h after hepatectomy. e Immunoblot analysis. f Quantitative PCR analysis. g Haematoxylin-eosin staining. Scale bar, 50 μm. Asterisks indicate hepatocellular death foci. h Plasma ALT levels. Data are presented as the mean values ± SEM. [n = 6/group, biologically independent samples]. Statistics: one-way repeated-measures ANOVA followed by Bonferroni’s multiple comparisons test (b, h), two-tailed Student’s t test (d, f). T, time effect; G, group effect; T × G, time and group interaction. Source data are provided as a Source Data file.
Fig. 6
Fig. 6. ATF3 upregulates RIPK3 transcription in hepatocytes.
a, b Halo-Atf3 or halo was overexpressed by adenovirus in primary hepatocytes derived from lean mice. a Quantitative PCR analysis. b Immunoblot analysis. c, d Atf3 and/or Ripk3 were knocked down in primary hepatocytes derived from lean and obese (ob/ob) mice. c Quantitative PCR analysis. d Immunoblot analysis. e Analysis of the Ripk3 promoter activity in H4IIE cells by the co-transfection of luciferase reporter plasmid and three doses of halo-Atf3 or halo expression plasmid. f Analysis of the Ripk3 promoter activity with the indicated promoter region or Sp1 binding site-mutant by halo-Atf3 in rat H4IIE cells. g ChIP assay using primary hepatocytes overexpressing halo-Atf3 or halo by adenovirus. Data are presented as the mean values ± SEM. [n = 3/group, biologically independent samples]. Statistics: two-way ANOVA followed by Bonferroni’s multiple comparisons test (a, c, e), one-way ANOVA followed by Dunnett’s test (f), two-tailed Student’s t test (g). CTRL, control; G, group effect; C, concentration effect; G × C, group and concentration interaction. H, hepatocyte group effect; S, siRNA effect; H × S, hepatocyte group and siRNA interaction. Source data are provided as a Source Data file.
Fig. 7
Fig. 7. ATF3 switches apoptosis to necroptosis in hepatocytes.
a Halo-Atf3 or halo was overexpressed by adenovirus in H4IIE cells treated with/without 5-AD. Expression levels of Atf3 and Ripk3 mRNA. bd Halo-Atf3 or halo was overexpressed by adenovirus in H4IIE-SMART cells treated with/without 5-AD. Cell death and necroptosis were monitored by SYTOX and FRET/CFP, respectively. b Percentage of cell viability. c Time-lapse images of the ratio of a single cell. Scale bar, 5 μm. d FRET/CFP ratio (top) and SYTOX levels (bottom) of H4IIE-SMART cells. el Halo-Atf3 or halo was overexpressed by adenovirus in H4IIE-SMART cells treated with 5-AD. H4IIE-SMART cells were stimulated with TNFα for 7 h and GSK872 for 24 h. Cell death and necroptosis were monitored by SYTOX and FRET/CFP, respectively. e Percentage of cell viability. *p < 0.05, for Halo-Atf3 versus Halo-Atf3 + TNFα. f Percentage of FRET+ cells in CFP+ dead cells. gl Time-lapse images of a single cell (g, i and k) and the FRET/CFP ratio (left of h, j and l) and SYTOX levels (right of h, j and l) of H4IIE-SMART cells. Data are presented as the mean values ± SEM. [n = 3/group, biologically independent samples]. Statistics: two-way ANOVA followed by Tukey’s multiple comparisons test (a), two-way repeated-measures ANOVA followed by Bonferroni’s multiple comparisons test (b), one-way repeated-measures ANOVA followed by Tukey’s multiple comparisons test (d, e), one-way ANOVA followed by Tukey’s multiple comparisons test (f). BF, bright-field; C, chemical effect; A, adenovirus effect; C × A, chemical and adenovirus interaction; T, time effect; A × T, adenovirus and time interaction. Source data are provided as a Source Data file.
Fig. 8
Fig. 8. RIPK3 knockdown ameliorates NASH induced by MCD feeding.
a, b Wild-type mice were treated as indicated. a Immunoblot analysis. b Quantitative PCR analysis. c, d ISH for Atf3 and Ripk3. c ISH images of serial sections. Scale bar, 50 μm. Arrows indicate both Atf3+ and Ripk3+ hepatocytes. Arrowheads indicate Atf3+ or Ripk3+ hepatocytes. Asterisks indicate hemosiderin pigmentation. d Percentage of Ripk3+ or Ripk3 hepatocytes in Atf3+ hepatocytes (left). Percentage of Atf3+ or Atf3 hepatocytes in Ripk3+ hepatocytes (right). ej Ripk3 siRNA was injected into the mice at 2 and 4 weeks after MCD feeding. e Plasma ALT levels. f TUNEL staining (left). Scale bar, 50 μm. Number of TUNEL+ hepatocytes (right). g Sirius red staining. Scale bar, 50 μm. h Quantitative PCR analysis of genes related to fibrosis. i Immunoblot analysis. j Quantitative PCR analysis of Ripk3, Atf3 and Tnf. Data are presented as the mean values ± SEM. [(ad) n = 6/group; (ej) n = 5/group, biologically independent samples]. Statistics: one-way ANOVA followed by Tukey’s multiple comparisons test (b), two-tailed Student’s t test (d, f, h, j), one-way repeated-measures ANOVA followed by Bonferroni’s multiple comparisons test (e). PHx, post-hepatectomy; R-KD, Ripk3 knockdown; D, diet effect; G, group effect; T, time effect. Source data are provided as a Source Data file.
Fig. 9
Fig. 9. ATF3 knockout prevents MCD-induced NASH.
A-KO mice and littermates (CTRL) were fed an MCD for 6 weeks. a Sirius red staining. Scale bar, 50 μm. b Plasma ALT levels at the indicated time points. c TUNEL staining (left). Scale bar, 50 μm. Arrowheads indicate TUNEL+ hepatocytes. Number of TUNEL+ hepatocytes (right). d, e Quantitative PCR analysis of genes related to fibrosis (d) and the eIF2α signalling pathway and necroptosis (e). f Immunoblot analysis. g Quantitative PCR analysis of genes related to ferroptosis. h Hepatic MDA levels. Data are presented as the mean values ± SEM. [n = 6/group, biologically independent samples]. Statistics: one-way repeated-measures ANOVA followed by Bonferroni’s multiple comparisons test (b), two-tailed Student’s t test (ce, g, h). G, group effect; T, time effect. Source data are provided as a Source Data file.
Fig. 10
Fig. 10. Hepatic ATF3 and RIPK3 expression in patients with NASH.
Serial sections of liver specimens in NAFLD patients were stained for ATF3, RIPK3 or phosphorylated RIPK3 (p-RIPK3). a Correlation (r) between the ATF3 and RIPK3 grades, between the RIPK3 and p-RIPK3 grades, and between the ATF3 and p-RIPK3 grades, calculated using Spearman’s rank correlation test. b Images of serial sections from human NASH (stages 3 and 4). Arrowheads indicate both ATF3+ and RIPK3+ hepatocytes. Arrows indicate ATF3+ or RIPK3+ hepatocytes. Scale bar, 50 μm. c Percentage of RIPK3+ or RIPK3 hepatocytes in ATF3+ hepatocytes (left). Percentage of ATF3+ or ATF3 hepatocytes in RIPK3+ hepatocytes (right). d Correlation (r) between the p-RIPK3 grade and AST level, calculated using Spearman’s rank correlation test. ei Semiquantitative evaluation of ATF3, RIPK3 and p-RIPK3 by NAS (e), steatosis (f), ballooning (g), inflammation (h) and fibrosis stage (i). Group comparisons were tested by the Kruskal–Wallis test. Data are presented as the mean values ± SEM. [(a, di) Sample size is indicated in each figure. b, c n = 6/group, biologically independent samples]. The liver biopsy samples are biologically independent samples. Source data are provided as a Source Data file.

Similar articles

Cited by

References

    1. Luedde T, Kaplowitz N, Schwabe RF. Cell death and cell death responses in liver disease: mechanisms and clinical relevance. Gastroenterology. 2014;147:765–783.e764. doi: 10.1053/j.gastro.2014.07.018. - DOI - PMC - PubMed
    1. Fuchs Y, Steller H. Live to die another way: modes of programmed cell death and the signals emanating from dying cells. Nat. Rev. Mol. Cell Biol. 2015;16:329–344. doi: 10.1038/nrm3999. - DOI - PMC - PubMed
    1. Li F, et al. Apoptotic cells activate the “phoenix rising” pathway to promote wound healing and tissue regeneration. Sci. Signal. 2010;3:ra13. doi: 10.1126/scisignal.2000634. - DOI - PMC - PubMed
    1. Gautheron J, Gores GJ, Rodrigues CMP. Lytic cell death in metabolic liver disease. J. Hepatol. 2020;73:394–408. doi: 10.1016/j.jhep.2020.04.001. - DOI - PMC - PubMed
    1. Campana, L., Esser, H., Huch, M. & Forbes, S. Liver regeneration and inflammation: from fundamental science to clinical applications. Nat. Rev. Mol. Cell Biol.22, 608–524 (2021). - PubMed

Publication types

Substances