. 2023 Jan 23;9(1):7.
doi: 10.1038/s41526-023-00248-5.

Simulated microgravity reduces quality of ovarian follicles and oocytes by disrupting communications of follicle cells

Affiliations

Simulated microgravity reduces quality of ovarian follicles and oocytes by disrupting communications of follicle cells

Kaixin Cheng et al. NPJ Microgravity. .

Abstract

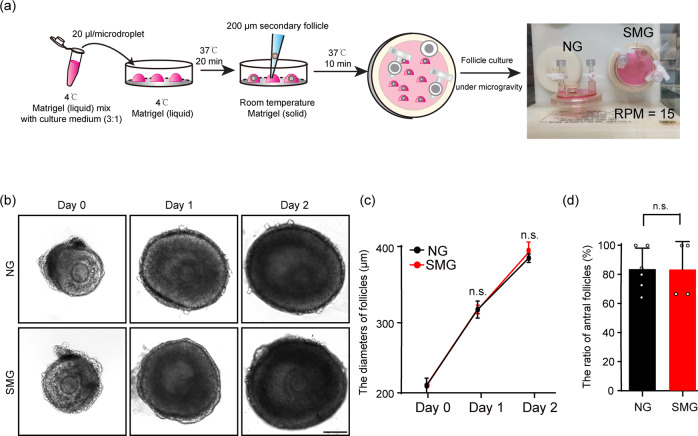
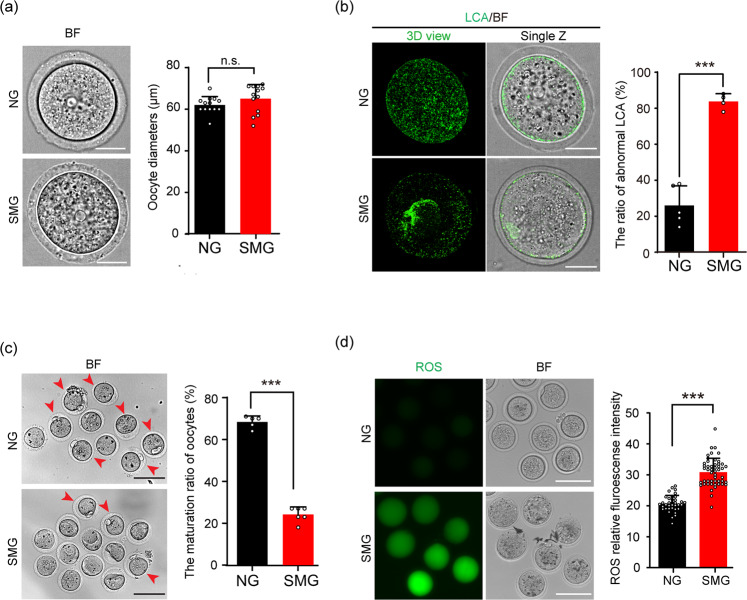
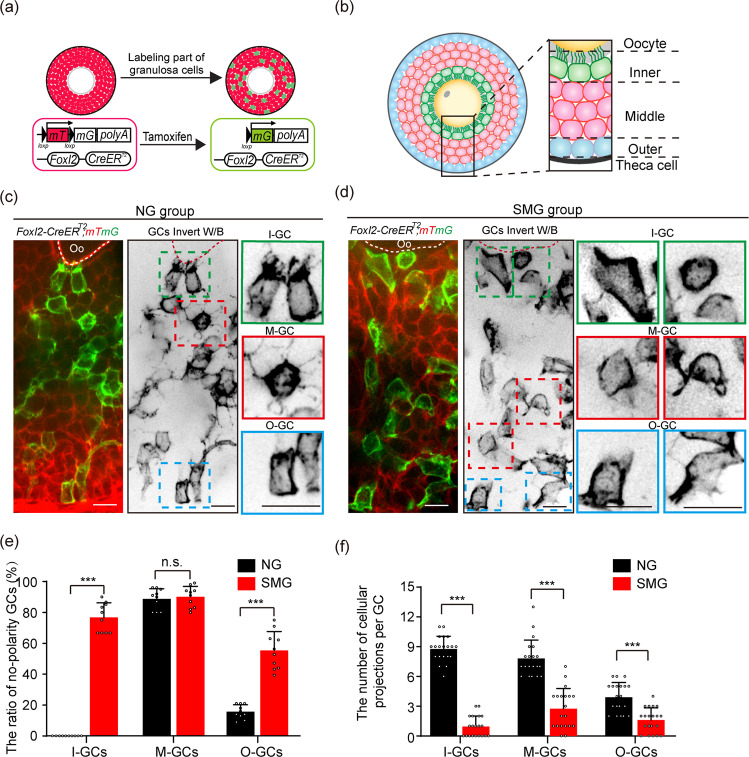
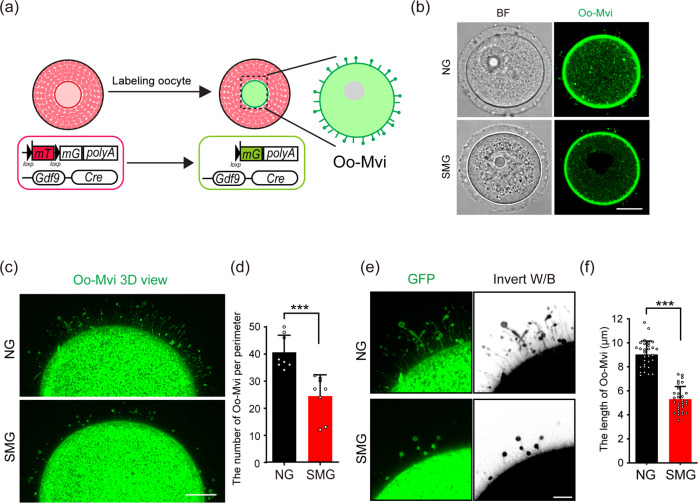
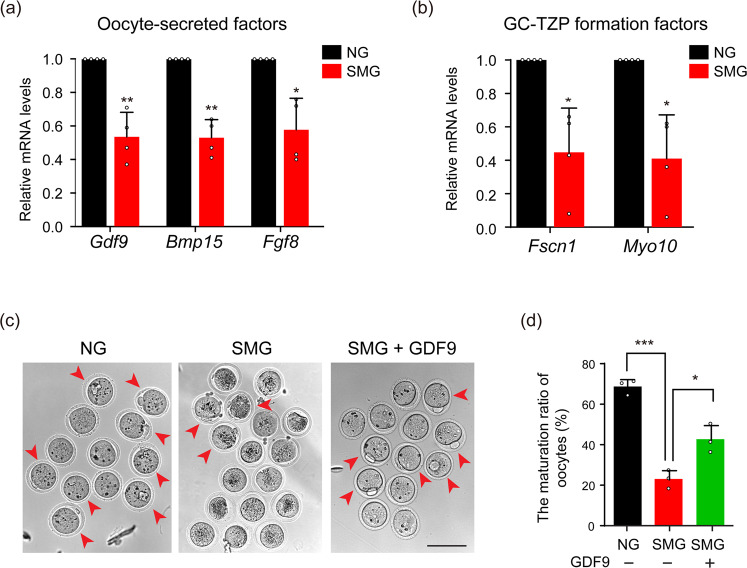
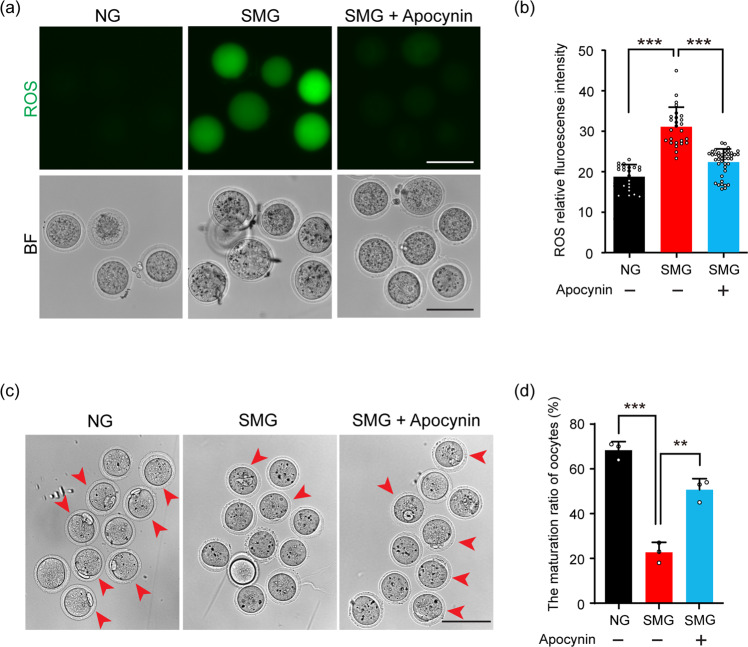
Ovarian follicles are the fundamental structures that support oocyte development, and communications between oocytes and follicle somatic cells are crucial for oogenesis. However, it is unknown that whether exposure to microgravity influences cellular communications and ovarian follicle development, which might be harmful for female fertility. By 3D culturing of ovarian follicles under simulated microgravity (SMG) conditions in a rotating cell culture system, we found that SMG treatment did not affect the survival or general growth of follicles but decreased the quality of cultured follicles released oocytes. Ultrastructure detections by high-resolution imaging showed that the development of cellular communicating structures, including granulosa cell transzonal projections and oocyte microvilli, were markedly disrupted. These abnormalities caused chaotic polarity of granulosa cells (GCs) and a decrease in oocyte-secreted factors, such as Growth Differentiation Factor 9 (GDF9), which led to decreased quality of oocytes in these follicles. Therefore, the quality of oocytes was dramatically improved by the supplementations of GDF9 and NADPH-oxidase inhibitor apocynin. Together, our results suggest that exposure to simulated microgravity impairs the ultrastructure of ovarian follicles. Such impairment may affect female fertility in space environment.


Conflict of interest statement

The authors declare no competing interests.

Figures

Fig. 1
Fig. 1. Tracing the growth of ovarian follicles in a 3D culture system under simulated microgravity condition.
a The flowchart of the 3D ovarian follicle culture in RCCS. The follicles were seeded into a Matrigel droplet to support their growth. b, c Tracing the growth of ovarian follicles in the NG and the SMG groups in vitro (b), showing comparable developmental dynamics of follicles in the SMG groups (n = 48) compared to that in the NG group (n = 60) (c). Day 0: p value = 0.13. Day 1: p value = 0.43. Day 2: p value = 0.076. Scale bars: 100 μm. d The ratio of antral formation in the cultured follicles under different conditions, showing no significant changes of antral forming proportions of cultured follicles in the SMG group (n = 65) compared to that in the NG group (n = 73). p value = 0.98. Representative images are shown. Data are presented as the mean ± SD. Data were analyzed by two-tailed unpaired Student’s t-test and n.s. P ≥ 0.05.
Fig. 2
Fig. 2. SMG treatment decreased the quality of cultured follicle released oocytes.
a After follicles developed under SMG or NG conditions, the oocytes were isolated from the cultured follicles. No significant changes in the diameters of oocytes were seen when comparing the SMG group (n = 13) with the NG group (n = 13) after 2 days of follicle culture. p value = 0.18. Scale bars, 30 μm. b LCA (Lens Culinaris Agglutinin)-FITC immunostaining showing abnormal cortical granule distribution in the SMG group oocytes (n = 53) compared to that in the NG group (n = 59). p value = 0.000067. Scale bars, 30 μm. c Oocytes obtained from antral follicles after 16 hours of culture with LH in vitro, showing a significantly decreased ratio of PB1 (red arrowheads) in the SMG group (n = 74) compared to that in the NG group (n = 63). p value = 0.0000000031. Scale bars, 100 μm. d An increased fluorescence intensity which represented higher ROS level in oocytes of the SMG group (n = 50) compared to that in the NG group (n = 36). p value = 0.00000000000000000000078. Scale bars, 100 μm. Representative images are shown. Data are presented as the mean ± SD. Data were analyzed by two-tailed unpaired Student’s t-test and n.s. P ≥ 0.05, **P < 0.01, ***P < 0.001.
Fig. 3
Fig. 3. SMG treatment disrupted GC polarity and the formation of communicating structures in GCs.
a Illustration of the strategy to induce labeling of the GCs in Foxl2-CreERT2;mTmG follicles. With a low dosage of tamoxifen treatment, membrane-localized red fluorescent protein (mT) switches to green-fluorescent protein (mG) in GCs of Foxl2-CreERT2;mTmG follicles, which allows for imaging of the cell outline of GCs under high-resolution imaging system. b The standard to separate the GCs in growing follicles. The inner layer of GCs was defined as the layer which directly connected to the oocyte by GC-TZPs (I-GCs, green); the middle layers of GCs was distributed in the middle multilayers position of follicle (M-GCs, pink); The outer layer of GCs was defined as the layer adjacent to the theca cells (O-GCs, blue). c Images of Foxl2-CreERT2;mTmG follicles showing the morphology of GCs in different regions in the NG group. I-GCs (green box) exhibited cuboidal shape with tree root-like GC-TZPs oriented toward the oocyte. Rounded M-GCs (red box) exhibited extended random cellular projections. Similar shaped cell with I-GCs, cuboidal O-GCs (blue box) extended a few cellular projections toward to M-GCs. Scale bars, 15 μm. d In the SMG group, both the polarity and the communicating structures on GCs were abnormal, showing a failure of GC-TZPs on I-GCs (green boxes), and dramatically reduced cellular projections on M-GCs (red boxes) and O-GCs (blue boxes). I-GCs and O-GCs exhibited a loss of polarity shape under SMG condition compared to that in the NG group. Scale bars, 15 μm. The cartoon model as shown in Supplementary Fig. 3. e Statistical analysis of GCs showing a significant increase in the proportion of non-polarity in I-GCs and O-GCs under SMG conditions (n = 10) compared to the NG group (n = 10). I-GCs: p value = 0.0000000010, M-GCs: p value = 0.64, O-GCs: p value = 0.00000082. f Loss of cellular projections in all layers of GCs under SMG conditions (n = 20) compared to that in NG conditions (n = 20). I-GCs: p value = 0.00000000000000000000064, M-GCs: p value = 0.00000000059, O-GCs: p value = 0.0000051. Representative images are shown. Data are presented as the mean ± SD. Data were analyzed by two-tailed unpaired Student’s t-test and n.s. P ≥ 0.05, ***P < 0.001. The colors were inverted to black/white (b/w) to highlight GCs in (c, d).
Fig. 4
Fig. 4. SMG treatment decreased the formation of Oo-Mvi in cultured follicles.
a Illustration of the strategy to label the Oo-Mvi by Gdf9-Cre;mTmG mouse model. The membrane-localized red fluorescent protein (mT) switches to green-fluorescent protein (mG) in oocytes of Gdf9-Cre;mTmG mouse to label oocyte membrane morphology. b Images of Gdf9-Cre;mTmG oocytes, showing the mushroom-like Oo-Mvi with vesicle tips distributed in the zona pellucida of oocytes in both the SMG and the NG groups. Scale bars, 30 μm. c 3D high-resolution images showing a decreased density of Oo-Mvi on the oocytes’ surface under SMG. Scale bars, 10 μm. d Numbers of Oo-Mvi reduced in SMG oocytes (n = 8) compared to that in NG (n = 8), showing a significantly reduced number of Oo-Mvi on oocytes in follicles after SMG treatment. p value = 0.00052. e High magnification showing that the length of Oo-Mvi in the SMG group was shorter than that in the NG group. Scale bars, 5 μm. f Quantification of the length of Oo-Mvi confirmed a dramatic decrease in the SMG group (n = 30) compared to that in the NG group (n = 30). p value = 0.00000000000000000052. The colors were inverted to black/white (b/w) to highlight Oo-Mvi in (e). Representative images are shown. Data is presented as the mean ± SD. Data were analyzed by two-tailed unpaired Student’s t-test and ***P < 0.001.
Fig. 5
Fig. 5. Supplying OSFs rescued the damage of oocytes by SMG treatment.
a Relative mRNA levels of Gdf9, Bmp15, and Fgf8 under the SMG or the NG group, showing a decreased expression of OSFs in the SMG group (n = 4). Gdf9: p value = 0.0081, Bmp15: p value = 0.0032, Fgf8: p value = 0.021. b Relative mRNA levels of Fscn1 and Myo10 under the SMG or the NG group, showing that the expression of GC-TZP forming related genes was downregulated after SMG treatment (n = 4). Fscn1: p value = 0.025, Myo10: p value = 0.021. c Supplying GDF9 increased the PB1 ratio of oocytes (red arrowheads) from SMG treated follicles. Scale bars, 100 μm. d The ratio of PB1 in different groups, showing that the GDF9 supplement significantly increased the maturation of oocytes (n = 38 in NG, n = 35 in SMG and n = 61 in SMG + GDF9). NG v.s. SMG: p value = 0.00021, SMG v.s. SMG + GDF9: p value = 0.021. Representative images of oocytes are shown. Data are presented as the mean ± SD. Data were analyzed by two-tailed unpaired Student’s t-test in (a, b) and two-way ANOVA in (d). n.s. P ≥ 0.05, *P < 0.05, **P < 0.01, ***P < 0.001.
Fig. 6
Fig. 6. Apocynin rescued SMG-related oocyte damage by decreasing the ROS level.
a After follicle culturing with Apocynin under SMG condition, the follicle-released oocytes showed a dramatically decreased ROS level compared to the oocytes without Apocynin. Scale bars, 100 μm. b The statistical analysis of DCF fluorescence intensity, showing a decreased ROS level in oocytes of the Apocynin group (n = 22 in NG, n = 26 in SMG and n = 41 in SMG + Apocynin). NG v.s. SMG: p value = 0.00000000000010, SMG v.s. SMG + Apocynin: p value = 0.000000028. c The ratio of PB1 (arrowheads) was markedly increased in the Apocynin-treated group compared to that in the SMG group. Scale bars, 100 μm. d Statistic analysis showing a significantly increased ratio of PB1 in the SMG + Apocynin group compared to that in the SMG group (n = 38 in NG, n = 35 in SMG and n = 43 in SMG + Apocynin). NG vs SMG: p value = 0.00021, SMG vs SMG + Apocynin: p value = 0.0019. Representative images of oocytes are shown. Data are presented as the mean ± SD. Data were analyzed by two-way ANOVA and n.s. P ≥ 0.05, **P < 0.01, ***P < 0.001.

Similar articles

Cited by

References

    1. Bradbury P, et al. Modeling the Impact of Microgravity at the Cellular Level: Implications for Human Disease. Front. Cell. Dev. Biol. 2020;8:1–8. doi: 10.3389/fcell.2020.00096. - DOI - PMC - PubMed
    1. Buken C, et al. Morphological and molecular changes in juvenile normal human fibroblasts exposed to simulated microgravity. Sci. Rep. 2019;9:11882. doi: 10.1038/s41598-019-48378-9. - DOI - PMC - PubMed
    1. Thiel CS, et al. Rapid morphological and cytoskeletal response to microgravity in human primary macrophages. Int. J. Mol. Sci. 2019;20:2402. doi: 10.3390/ijms20102402. - DOI - PMC - PubMed
    1. Zhang H, Liu K. Cellular and molecular regulation of the activation of mammalian primordial follicles: somatic cells initiate follicle activation in adulthood. Hum. Reprod. Update. 2015;21:779–786. doi: 10.1093/humupd/dmv037. - DOI - PubMed
    1. McGee, E. A. & Hsueh, A. J. W. Initial and cyclic recruitment of ovarian follicles. Endocr. Rev.21, 200–214 (2000). - PubMed