. 2023 Apr;28(4):1667-1678.
doi: 10.1038/s41380-023-01955-x. Epub 2023 Jan 23.

Does treatment with autophagy-enhancers and/or ROS-scavengers alleviate behavioral and neurochemical consequences of low-dose rotenone-induced mild mitochondrial dysfunction in mice?

Affiliations

Does treatment with autophagy-enhancers and/or ROS-scavengers alleviate behavioral and neurochemical consequences of low-dose rotenone-induced mild mitochondrial dysfunction in mice?

O Damri et al. Mol Psychiatry. 2023 Apr.

Abstract

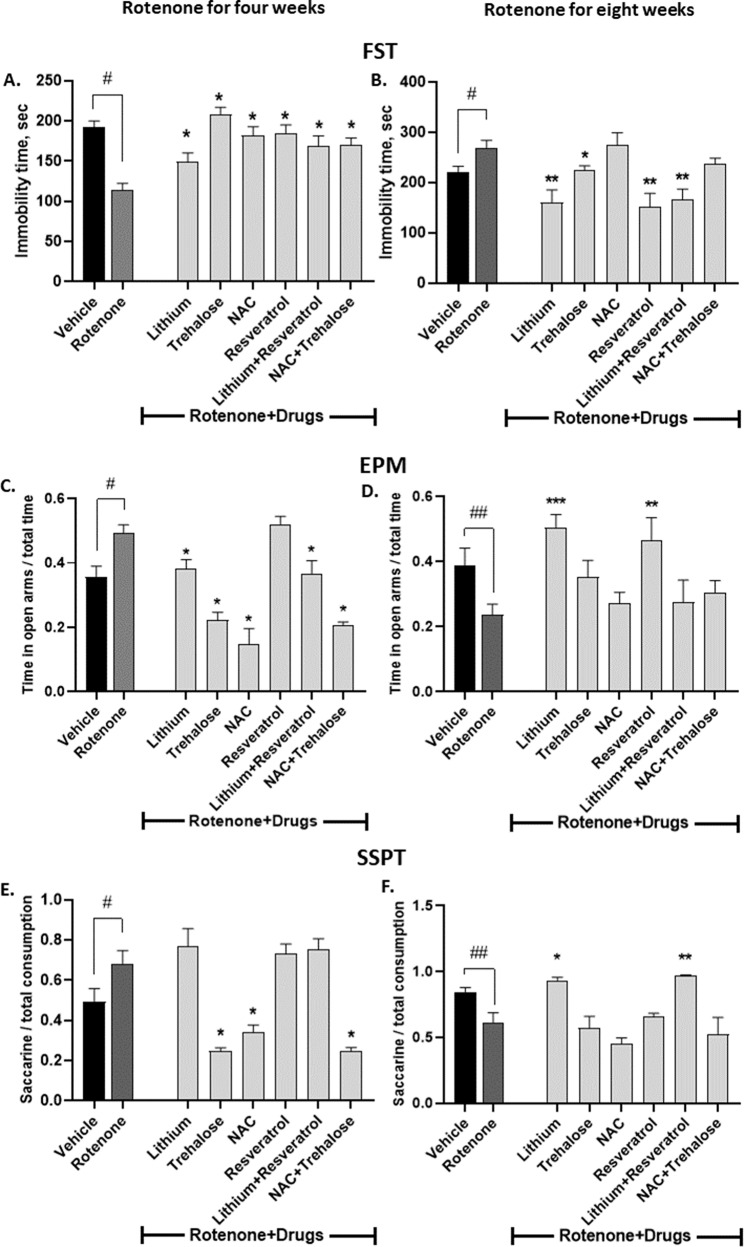
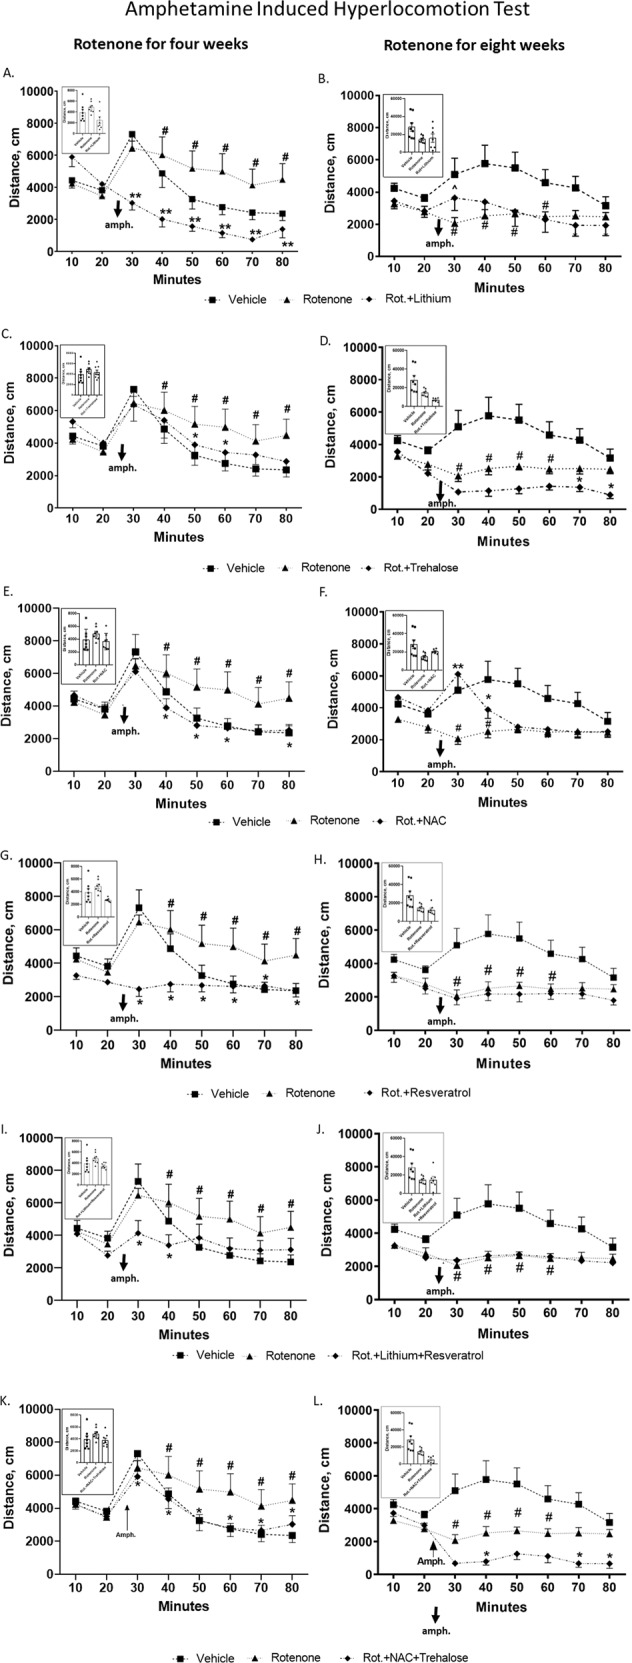
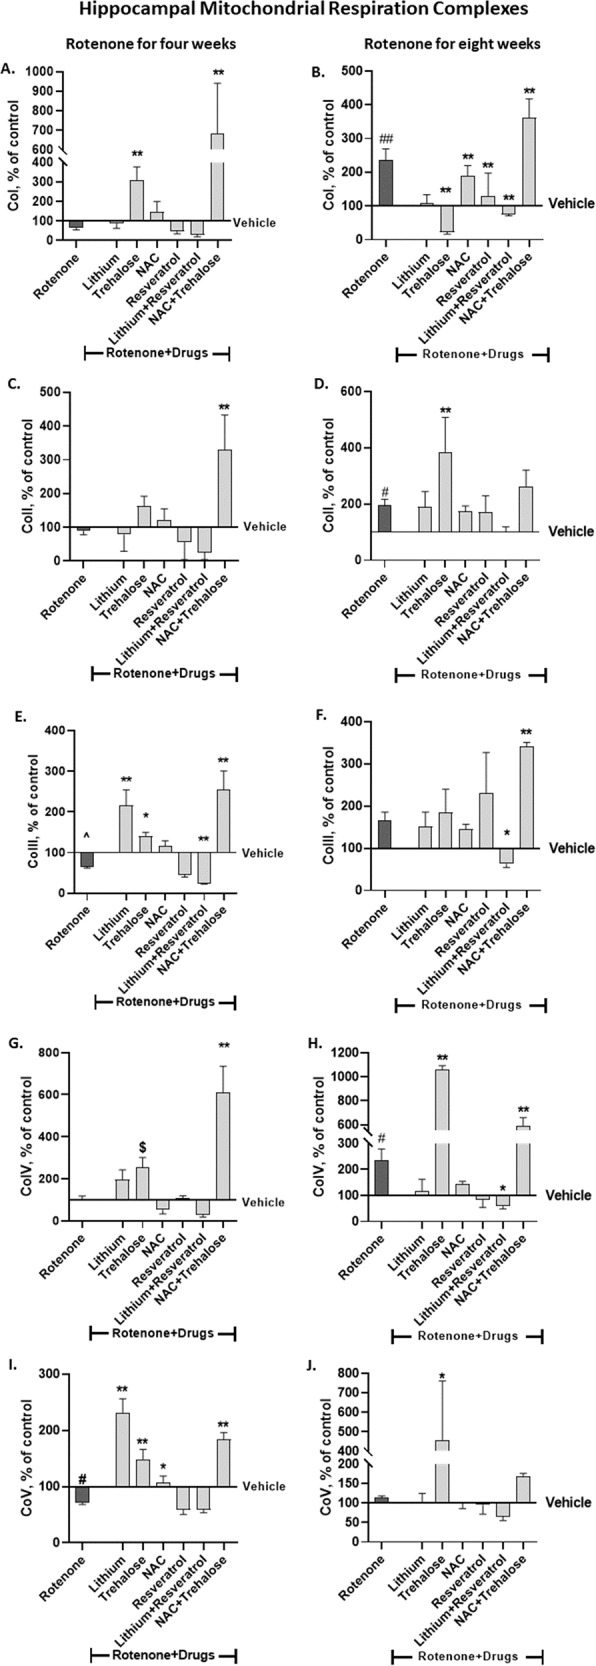
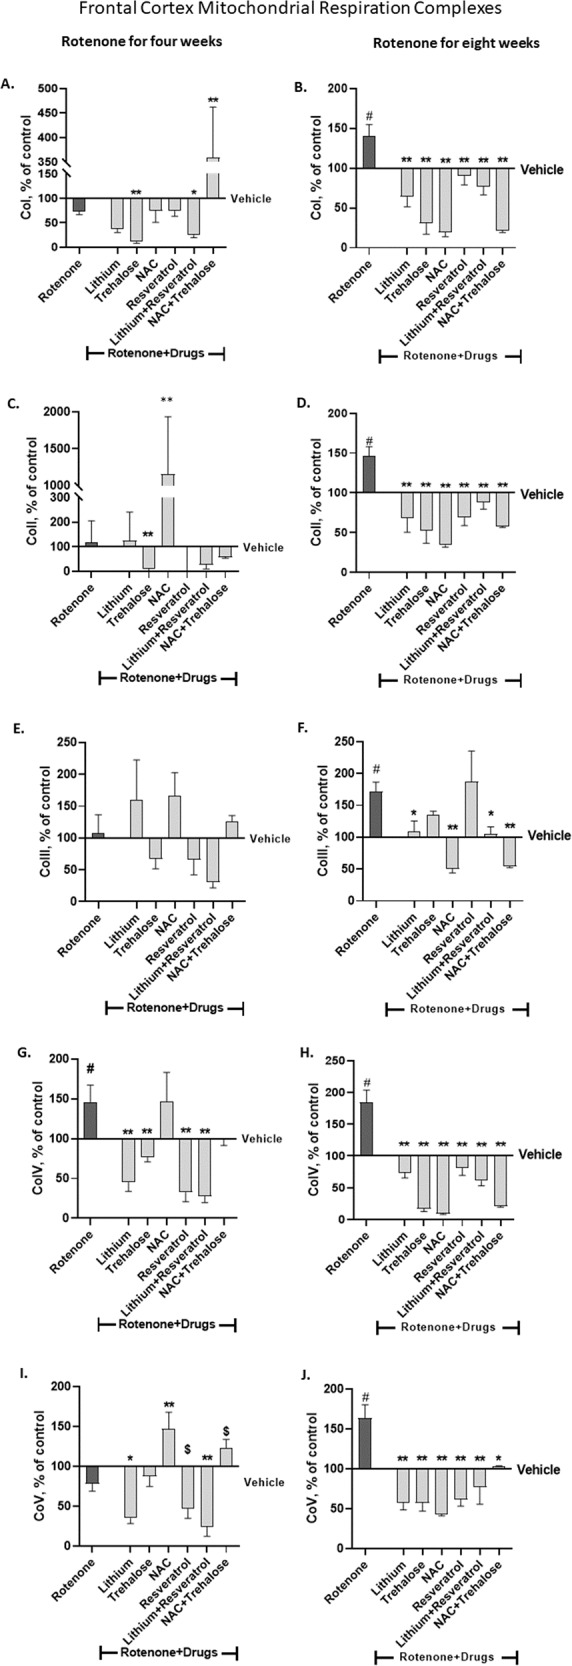
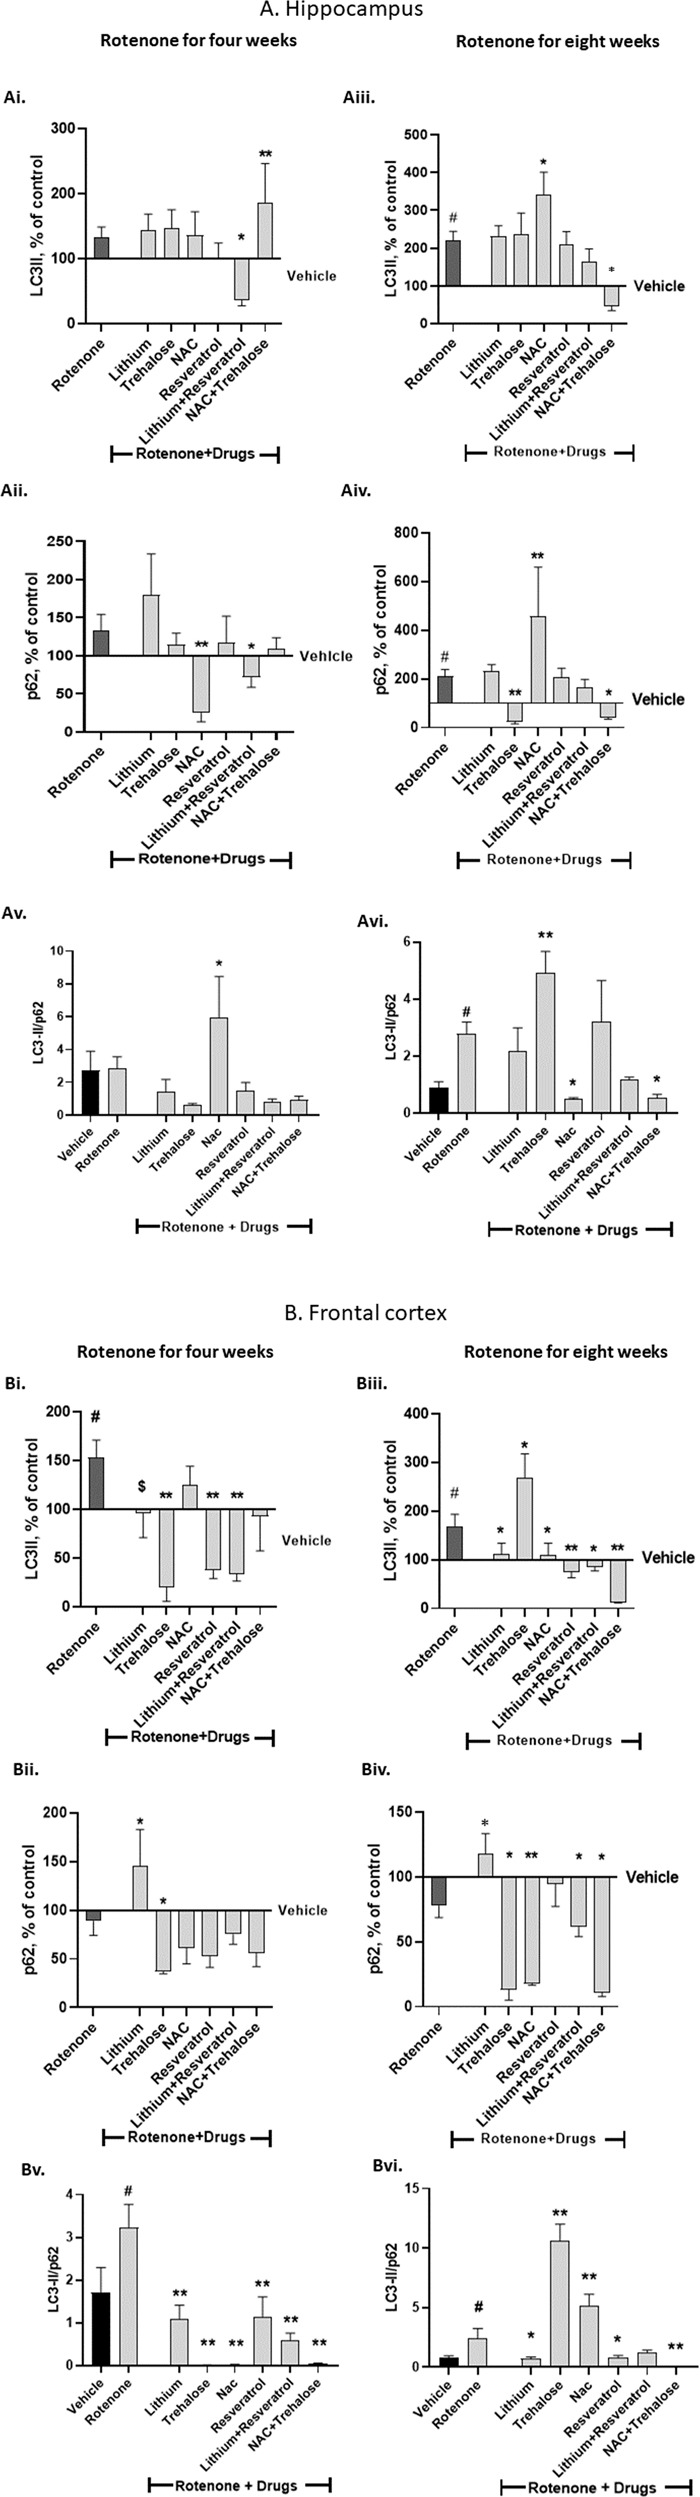
Bipolar-disorder's pathophysiology and the mechanism by which medications exert their beneficial effect is yet unknown, but others' and our data implicate patients' brain mitochondrial-dysfunction and its amendment by mood-stabilizers. We recently designed a novel mouse bipolar-disorder-like model using chronic administration of a low-dose of the oxidative-phosphorylation complex I inhibitor, rotenone. Four and eight weeks rotenone treatment induced manic- and depressive-like behavior, respectively, accompanied by mood-related neurochemical changes. Here we aimed to investigate whether each of the autophagy-enhancers lithium (a mood-stabilizer), trehalose and resveratrol and/or each of the reactive oxygen species (ROS)-scavengers, resveratrol and N-acetylcystein and/or the combinations lithium+resveratrol or trehalose+N-acetylcystein, can ameliorate behavioral and neurochemical consequences of neuronal mild mitochondrial-dysfunction. We observed that lithium, trehalose and N-acetylcystein reversed rotenone-induced manic-like behavior as well as deviations in protein levels of mitochondrial complexes and the autophagy marker LC3-II. This raises the possibility that mild mitochondrial-dysfunction accompanied by impaired autophagy and a very mild increase in ROS levels are related to predisposition to manic-like behavior. On the other hand, although, as expected, most of the drugs tested eliminated the eight weeks rotenone-induced increase in protein levels of all hippocampal mitochondrial complexes, only lithium ubiquitously ameliorated the depressive-like behaviors. We cautiously deduce that aberrant autophagy and/or elevated ROS levels are not involved in predisposition to the depressive phase of bipolar-like behavior. Rather, that amending the depressive-like characteristics requires different mitochondria-related interventions. The latter might be antagonizing N-methyl-D-aspartate receptors (NMDARs), thus protecting from disruption of mitochondrial calcium homeostasis and its detrimental consequences. In conclusion, our findings suggest that by-and-large, among the autophagy-enhancers and ROS-scavengers tested, lithium is the most effective in counteracting rotenone-induced changes. Trehalose and N-acetylcystein may also be effective in attenuating manic-like behavior.


Conflict of interest statement

The authors declare no competing interests.

Figures

Fig. 1
Fig. 1. Some of the drugs and some of their combinations administered during the last week/two weeks of rotenone treatment for four (A, C, E) or eight (B, D, F) weeks attenuated rotenone’s effect in the FST, EPM and SSPT.
Results represent means ± SEM of at least 7 mice/group. Our previous results [6] that four and eight weeks of rotenone treatment decreases and increases, respectively, the immobility time of the mice in the FST (A, B), and increases and decreases, respectively, the time spent in the open arms of the EPM (C, D), increases and decreases, respectively, the preference of the mice for sweet solution (E, F), and that lithium treatment attenuates rotenone’s effects in the FST and the EPM (AD) were replicated. Two-ways ANOVA with rotenone (with/without) and drugs (with/without) as main factors: FST - A. rotenone effect, F(6,209) = 7.274, p < 0.0001; rotenoneXdrugs interaction, F(6,09) = 7.966, p < 0.0001. B Rotenone effect, F(6,111) = 13.21, p < 0.0001; rotenoneXdrugs interaction, F(6,111) = 2.557, p = 0.02. EPM. C Rotenone effect, F(6,166) = 27.13, p < 0.0001; rotenoneXdrugs interaction, F(6,166) = 6.234, p < 0.0001; drugs effect, F(1,166) = 8.449, p = 0.0042. D Rotenone effect, F(6,114) = 5.31, p = 0.0001; rotenoneXdrugs interaction, F(6,114) = 2.978, p < 0.01. SSPT. E Rotenone effect, F(6,81) = 16.53, p < 0.0001. F Rotenone effect, F(6,36) = 6.856, p < 0.0001; drugs effect, F(1,36) = 11.42, p = 0.0018. Asterisks and symbols denote results of Fisher’s LSD post-hoc test: #p < 0.05 and ##p < 0.001 - vs. vehicle; *p < 0.05, **p < 0.001, and ***p < 0.0001 – vs. rotenone.
Fig. 2
Fig. 2. All drugs and their combinations administered during the last week/two weeks of rotenone treatment for four (A, C, E, G, I, K) or eight (B, D, F, H, J, L) weeks attenuated rotenone’s effect in the amphetamine-induced hyperlocomotion test, while lithium and NAC counteracted it in a time-dependent manner.
Results represent means ± SEM of at least 7 mice/group. The plots depict distance travelled in the open field as a function of time; insets depict total distance travelled post amphetamine (amph.). As previously reported [6], repeated measures ANOVA of the results from 10 min post amphetamine injection to mice treated for four or eight weeks of rotenone, revealed significant augmentation and significant attenuation, respectively, of the distance travelled by the mice. Two-ways ANOVA with rotenone (with/without) and drugs (with/without) as main factors followed by Fisher’s LSD post-hoc test; asterisks and symbols denote: #p < 0.05 and ##p < 0.001 - vs. vehicle; *p < 0.05, **p < 0.001 and ^p = 0.06 – vs. rotenone. Only statistically significant results are detailed: Lithium A Rotenone effect, F(7,189) = 21.236, p = 0.00001; rotenoneXdrugs interaction, F(21,189) = 6.304, p = 0.000001; drugs effect, F(3,27) = 4.191, p = 0.014; B Rotenone effect, F(7,182) = 7.784, p = 0.00001; rotenoneXdrugs interaction, F(21,182) = 2.196, p = 0.002; drugs effect, F(3,26) = 0.045, p = 0.017; Trehalose C Rotenone effect, F(7,168) = 22.382, p = 0.0001; rotenoneXdrugs interaction, F(21,168) = 1.774, p = 0.061. D Rotenone effect, F(7,168) = 5.487, p = 00001; rotenoneXdrugs interaction, F(21,168) = 2.437, p = 0.0009; drugs effect, F(3,24) = 0.194, p = 0.0003. NAC E Rotenone effect, F(7,168) = 26.308, p = 0.00001; rotenoneXdrugs interaction, F(21,168) = 1.916, p = 0.012. F Rotenone effect, F(7,168) = 2.960, p = 0.005; rotenoneXdrugs interaction, F(21,168) = 1.774, p = 0.024; drugs effect, F(3,24) = 1.063, p = 0.018. Resveratrol G Rotenone effect, F(7,189) = 7.186, p = 0.000001; rotenoneXdrugs interaction, F(21,189) = 5.332, p = 0.000001; drugs effect, F(3,27) = 4.433, p = 0.017; H Rotenone effect, F(7,182) = 3.299, p = 0.002; rotenoneXdrugs interaction, F(21,182) = 2.025, p = 0.007; drugs effect, F(3,26) = 0.84, p = 0.001; Lithium + Resveratrol I Rotenone effect, F(7,196) = 12.522, p = 0.000001; rotenoneXdrugs interaction, F(21,196) = 2.697, p = 0.0001; drugs effect, F(3,28) = 0.814, p = 0.057; J Rotenone effect, F(7,182) = 2.872, p = 0.007; rotenoneXdrugs interaction, F(21,182) = 1.789, p = 0.022; drugs effect, F(3,26) = 0.984, p = 0.007; NAC + Trehalose K Rotenone effect, F(7,161) = 23.703, p = 0.00001; L. rotenone effect, F(7,168) = 8.684, p = 0.000001; rotenoneXdrugs interaction, F(21,168) = 3.966, p = 0.000001; drugs effect, F(3,24) = 0.481, p = 0.00007.
Fig. 3
Fig. 3. The effect of rotenone for four (A, C, E, G, I) and eight weeks (B, D, F, H, J) on hippocampal protein levels of the five mitochondrial respiration complexes was attenuated or counteracted by some of the drugs or their combination administered during the last week/two weeks of rotenone treatment.
Results, expressed as percent of vehicle only, represent means ± SEM of at least 6 mice/group. Our previous results [6] of the effect of rotenone treatment for four and eight weeks on hippocampal protein levels of the complexes were replicated. Two-ways ANOVA with rotenone (with/without) and drugs (with/without) as main factors followed by Fisher’s LSD post-hoc test; asterisks and symbols represent: #p < 0.05, ##p < 0.001 and ^one-tailed p < 0.05 vs. vehicle; *p < 0.05, **p < 0.001 and $one-tailed p < 0.05, vs. rotenone. Only significant results are detailed: Co I – A (4 weeks of Rot): rotenone effect, F(6,85) = 18.47, p < 0.0001. B (8 weeks of Rot): RotenoneXdrugs interaction, F(6,63) = 4.818, p = 0.0004; rotenone effect, F(6,63) = 19.54, p < 0.0001 Co II – C (4 weeks of Rot): rotenone effect, F(6,92) = 23.39, p < 0.0001. D (8 weeks of Rot): rotenone effect, F(6,69) = 8.014, p < 0.0001. Co III – E. (4 weeks of Rot): RotenoneXdrugs interaction, F(6,84) = 6.711, p < 0.0001; rotenone effect, F(6,84) = 34.67, p < 0.0001. F (8 weeks of Rot): RotenoneXdrugs interaction, F(6,68) = 3.167, p = 0.085; rotenone effect, F(6,68) = 16.89, p < 0.0001. Co IV – G (4 weeks of Rot): Rotenone effect, F(6,88) = 14.91, p < 0.0001. H (8 weeks of Rot): Rotenone effect, F(6, 62) = 56.13, p < 0.0001; Co V - I (4 weeks of Rot): RotenoneXdrugs interaction, F(6,89) = 8.891, p < 0.0001; rotenone effect, F(6,89) = 47.02, p < 0.0001. J (8 weeks of Rot): Rotenone effect, F(6, 68) = 6.45, p < 0.0001.
Fig. 4
Fig. 4. The effect of rotenone for four (A, C, E, G, I) and eight weeks (B, D, F, H, J) on frontal cortex protein levels of the five mitochondrial respiration complexes was attenuated or counteracted by some of the drugs or their combination administered during the last week/two weeks of rotenone treatment.
Results, expressed as percent of vehicle only, represent means ± SEM of at least 6 mice/group. Our previous results of the effect of rotenone treatment for four and eight weeks on frontal cortex protein levels of the complexes [6] were replicated. Two-ways ANOVA with rotenone (with/without) and drugs (with/without) as main factors followed by Fisher’s LSD post-hoc test; asterisks and symbol represent: #p < 0.05 vs. vehicle; *p < 0.05, **p < 0.001 and $one-tailed p < 0.05 vs. rotenone. Only significant results are detailed: Co I – A (4 weeks of Rot) rotenoneXdrugs interaction, F(6,67) = 16.64, p < 0.0001; rotenone effect, F(6,67) = 18.77, p < 0.0001. B (8 weeks of Rot) rotenoneXdrugs interaction, F(6,70) = 2.102, p = 0.06; rotenone effect, F(6,70) = 16.94, p < 0.0001. Co II – C (4 weeks of Rot) rrotenone effect, F(6,86) = 31.17, p < 0.000. D 8 weeks of Rot: rotenone effect, F(6,74) = 14.35, p < 0.0001. Co III – E (4 weeks of Rot) rrotenone effect, F(6,84) = 2.433, p = 0.0. F (8 weeks of Rot) rotenoneXdrugs interaction, F(6,72) = 4.632, p = 0.0005; rotenone effect, F(6,72) = 3.028, p = 0.0107. Co IV – G (4 weeks of Rot) rotenone effect, F(6,76) = 12.96, p < 0.000. H (8 weeks of Rot) rotenoneXdrugs interaction, F(6,70) = 6.341, p < 0.0001; rotenone effect, F(6, 70) = 32.8, p < 0.0001. Co V - I (4 weeks of Rot) rotenone effect, F(6,79) = 15.55, p < 0.0001. J (8 weeks of Rot) rotenoneXdrugs interaction, F(6,73) = 2.802, p = 0.016; rotenone effect, F(6, 73) = 10.81, p < 0.0001.
Fig. 5
Fig. 5. Hippocampal (A) and frontal cortex (B) protein levels of the autophagy markers LC3-II (Ai, Aiii, Bi, Biii), p62 (Aii, Aiv, Bii, Biv) and LC3-II/p62 protein levels ratio (Av, Avi, Bv, Bvi) - effect of the drugs tested on their own and of their combinations on rotenone’s effect for four (Ai, Aii, Av, Bi, Bii, Bv) and eight (Aiii, Aiv, Avi, Biii, Biv, Bvi) weeks.
Results of LC3-II and p62, expressed as percent of vehicle only, and of the ratio between the arbitrary units of LC3-II and p62, represent means ± SEM of at least 5 mice/group. Two-ways ANOVA with rotenone (with/without) and drugs (with/without) as main factors followed by Fisher’s LSD post-hoc test; asterisks and symbol represent: #p < 0.05 vs. vehicle; *p < 0.05, **p < 0.001 and $one-tailed p < 0.05 vs. rotenone. Only significant results are detailed: A Hippocampus 4 weeks of rotenone: Ai. LC3-II: rotenone effect, F(6,69) = 6.59, p < 0.0001. Aii p62: rotenoneXdrugs interaction, F(6,67) = 16.64, p < 0.0001; rotenone effect, F(6,67) = 18.77, p < 0.0001. 8 weeks of rotenone: Aiii LC3-II: rotenone effect, F(6,65) = 10.99, p < 0.0001. Aiv p62: rotenone effect, F(6,72) = 11.55, p < 0.0001; drugs effect, F(1,72) = 0.717, p = 0.002. Av LC3-II/p62: drugs effect, F(6,64) = 5.04, p = 0.0003. Avi LC3-II/p62: rotenoneXdrugs interaction, F(6,55) = 5.007, p = 0.0004; drugs effect, F(6,55) = 4.541, p = 0.0008; rotenone effect, F(6,55) = 23.25, p = 0.0001. B Frontal cortex 4 weeks of rotenone: Bi LC3-II: rotenoneXdrugs interaction, F(6,75) = 3.794, p = 0.002; rotenone effect, F(6,75) = 2.618, p = 0.02. Bii p62: rotenone effect, F(6,83) = 4.267, p = 0.0009. 8 weeks of rotenone: Biii LC3-II: rotenoneXdrugs interaction, F(6,65) = 5.216, p = 0.0002; rotenone effect, F(6,65) = 12, p < 0.0001. Biv p62: rotenone effect, F(6,70) = 21.64, p < 0.0001. Bv LC3-II/p62: rotenoneXdrugs interaction, F(6,64) = 2.22, p = 0.05; drugs effect, F(6,64) = 9.521, p < 0.0001. Bvi LC3-II/p62: rotenoneXdrugs interaction, F(6,54) = 12.51, p < 0.0001; drugs effect, F(6,54) = 43.97, p < 0.0001; rotenone effect, F(6,54) = 32.04, p < 0.0001.

Similar articles

Cited by

References

    1. Schulmann A, Ryu E, Goncalves V, Rollins B, Christiansen M, Frye MA, et al. Novel complex interactions between mitochondrial and nuclear DNA in schizophrenia and bipolar disorder. Mol Neuropsychiatry. 2019;5:13–27. - PMC - PubMed
    1. Cyrino LAR, Delwing-de Lima D, Ullmann OM, Maia TP. Concepts of neuroinflammation and their relationship with impaired mitochondrial functions in bipolar disorder. Front Behav Neurosci. 2021;15:609487. doi: 10.3389/fnbeh.2021.609487. - DOI - PMC - PubMed
    1. Scaini G, Rezin GT, Carvalho AF, Streck EL, Berk M, Quevedo J. Mitochondrial dysfunction in bipolar disorder: Evidence, pathophysiology and translational implications. Neurosci Biobehav Rev. 2016;68:694–713. doi: 10.1016/j.neubiorev.2016.06.040. - DOI - PubMed
    1. Luptak M, Hroudova J. Important role of mitochondria and the effect of mood stabilizers on mitochondrial function. Physiol Res. 2019;68:S3–S15. doi: 10.33549/physiolres.934324. - DOI - PubMed
    1. Madireddy S, Madireddy S. Therapeutic interventions to mitigate mitochondrial dysfunction and oxidative stress-induced damage in patients with bipolar disorder. Int J Mol Sci. 2022;23:1844. doi: 10.3390/ijms23031844. - DOI - PMC - PubMed

Publication types