. 2023 Feb;8(2):299-308.
doi: 10.1038/s41564-022-01311-9. Epub 2023 Jan 23.

CD8+ lymphocytes do not impact SIV reservoir establishment under ART

Affiliations

CD8+ lymphocytes do not impact SIV reservoir establishment under ART

Maura Statzu et al. Nat Microbiol. 2023 Feb.

Abstract

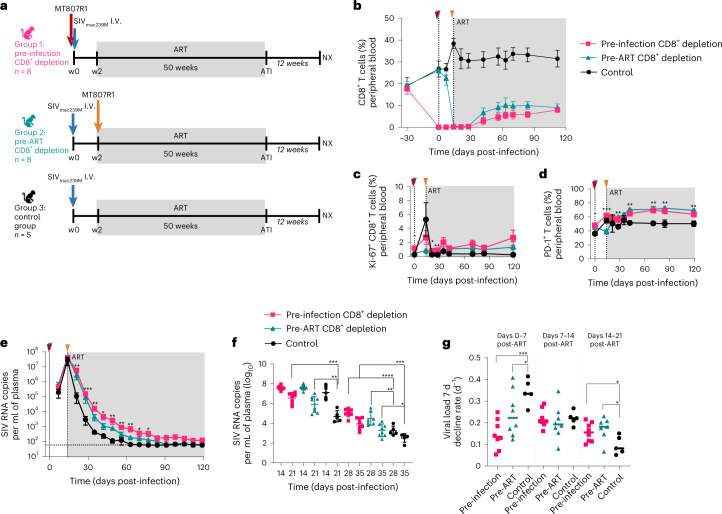
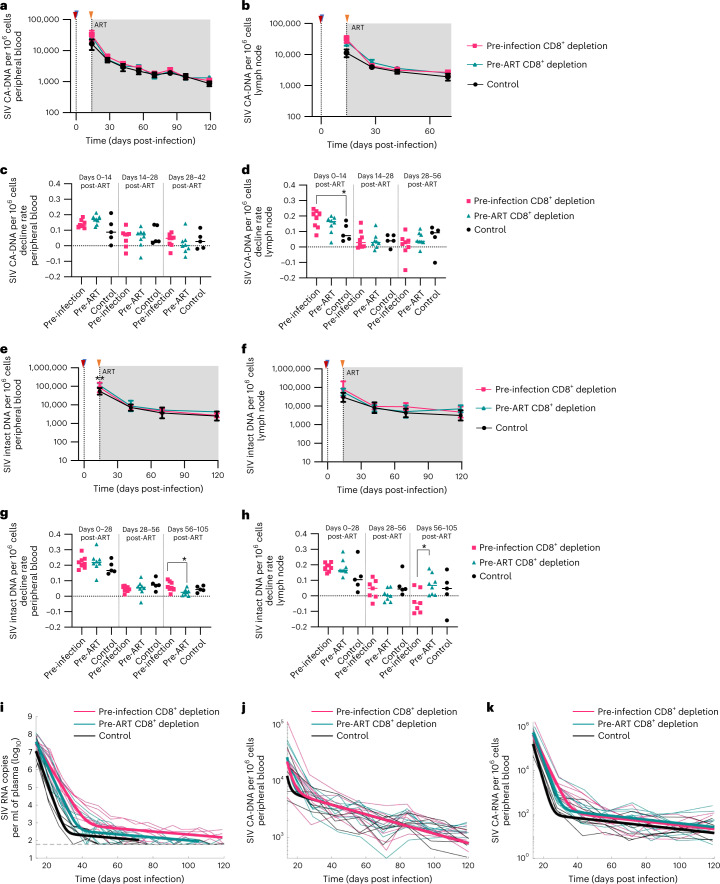
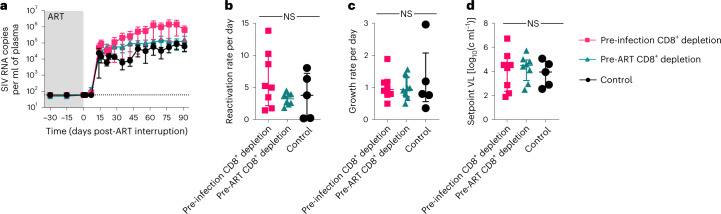
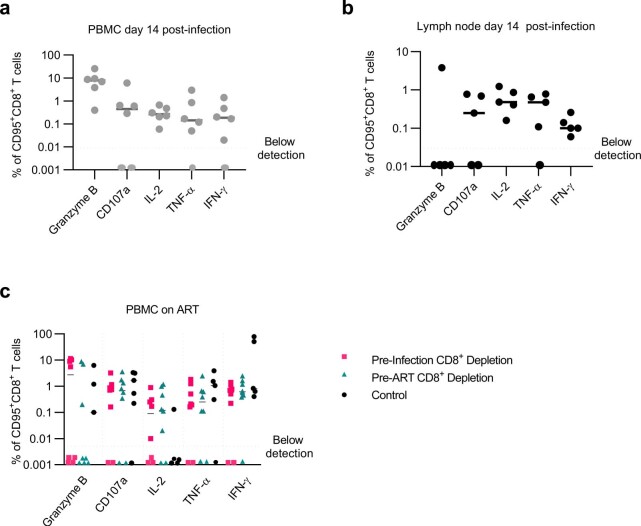
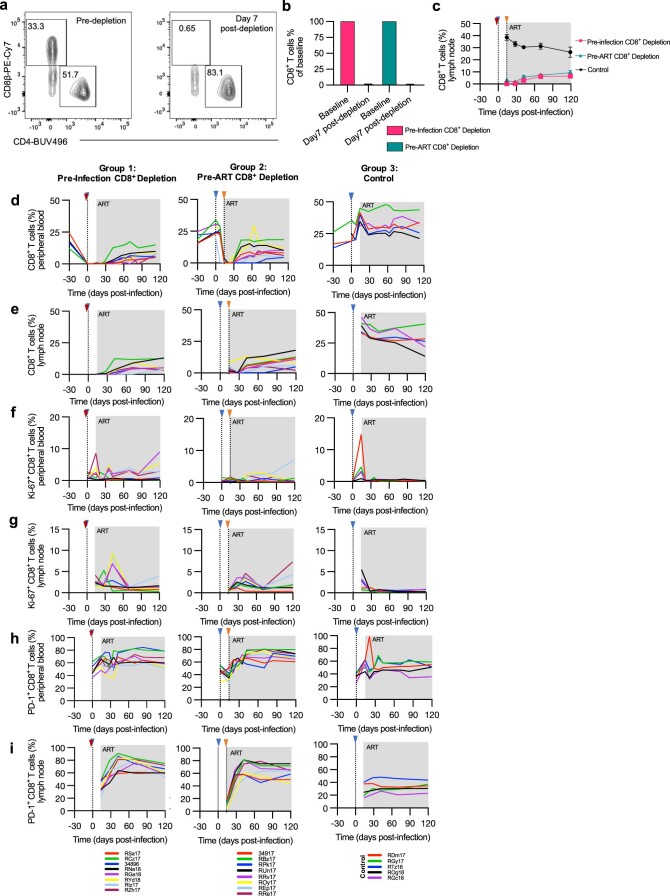
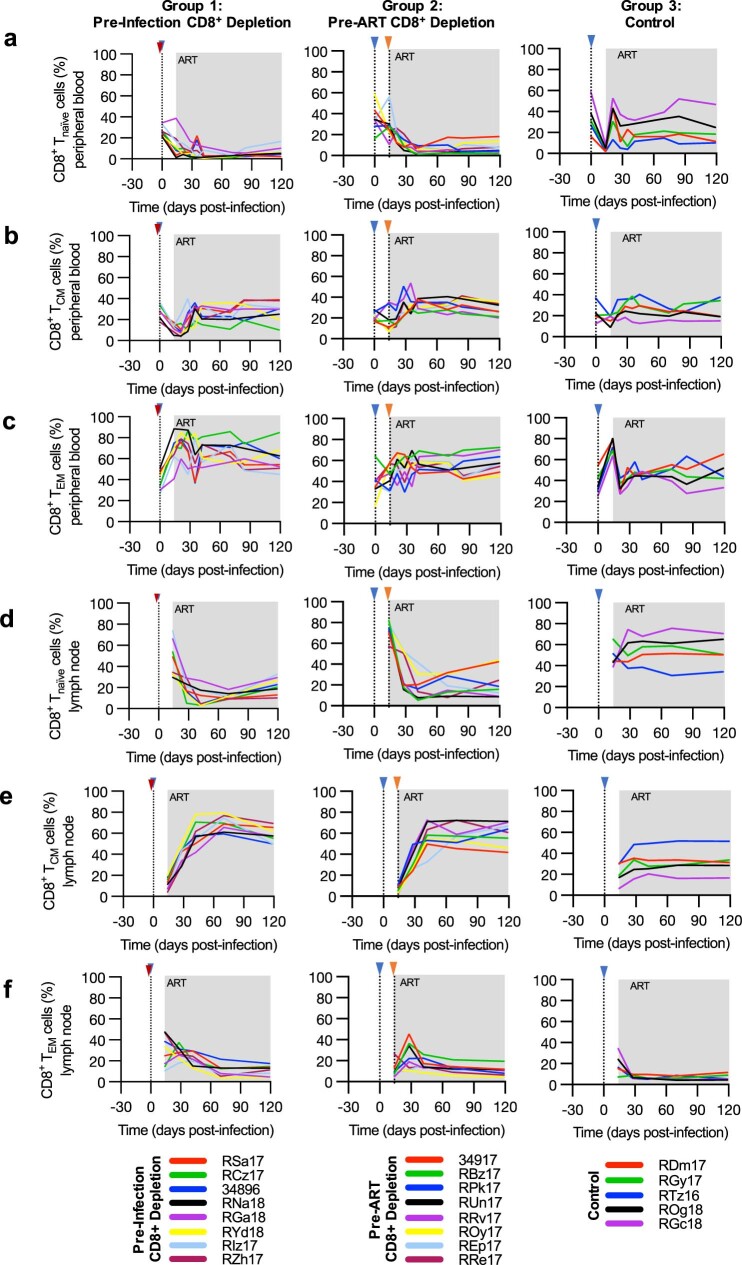
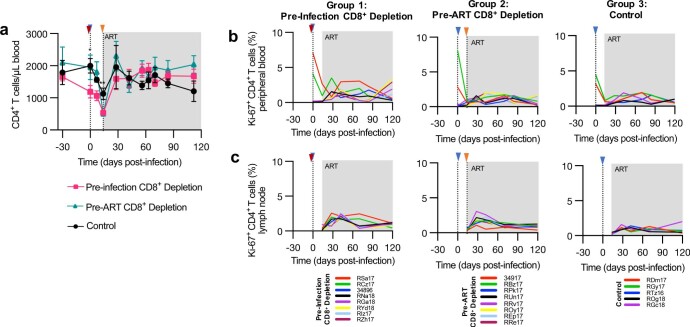
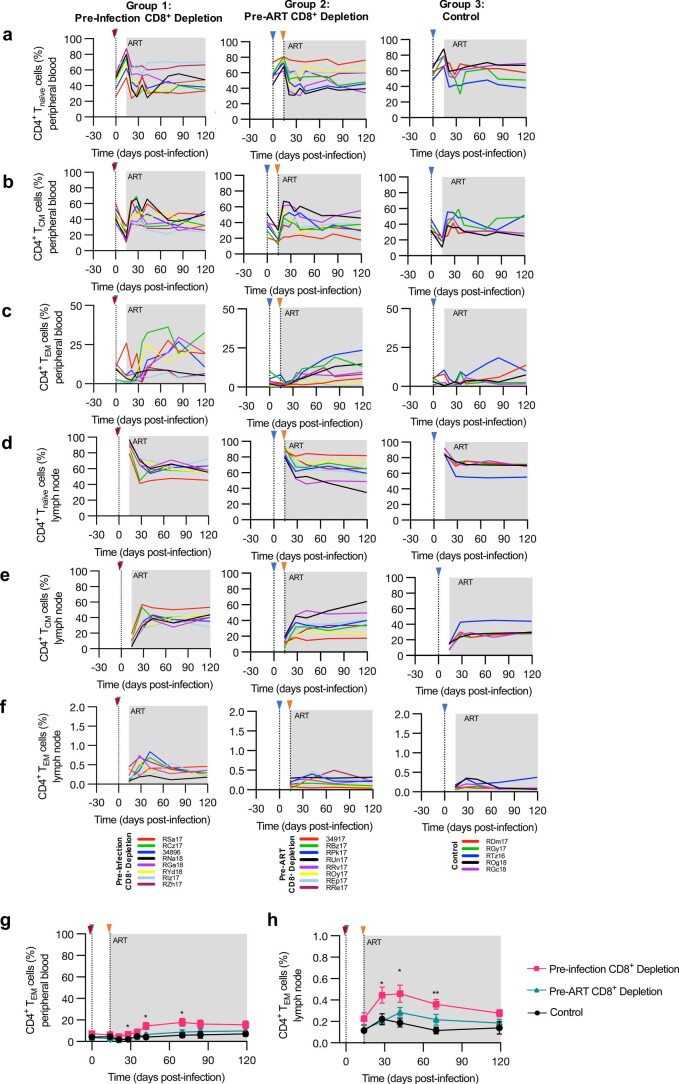
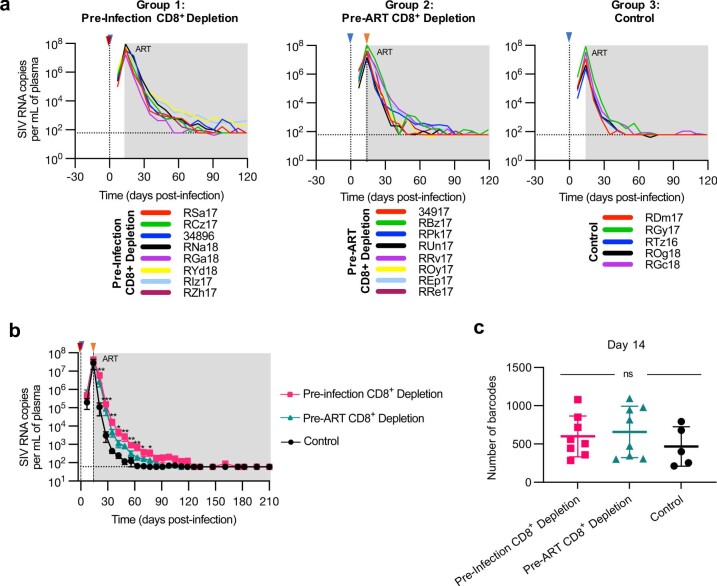
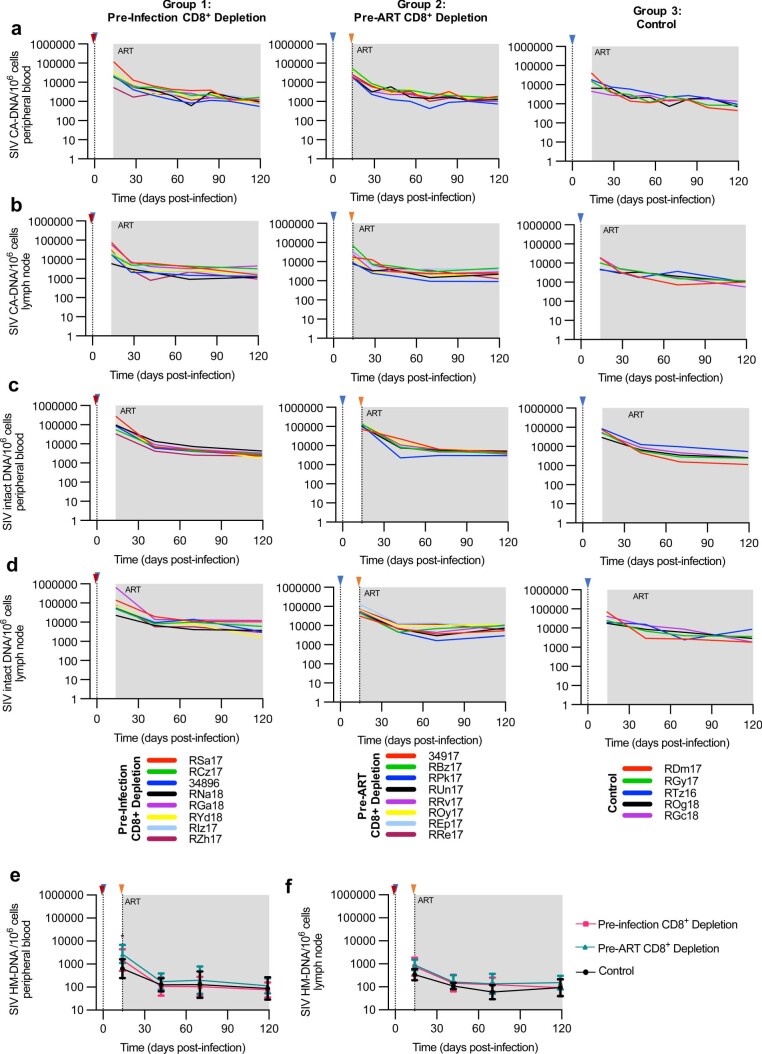
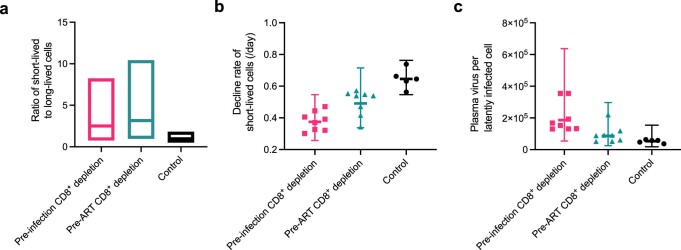
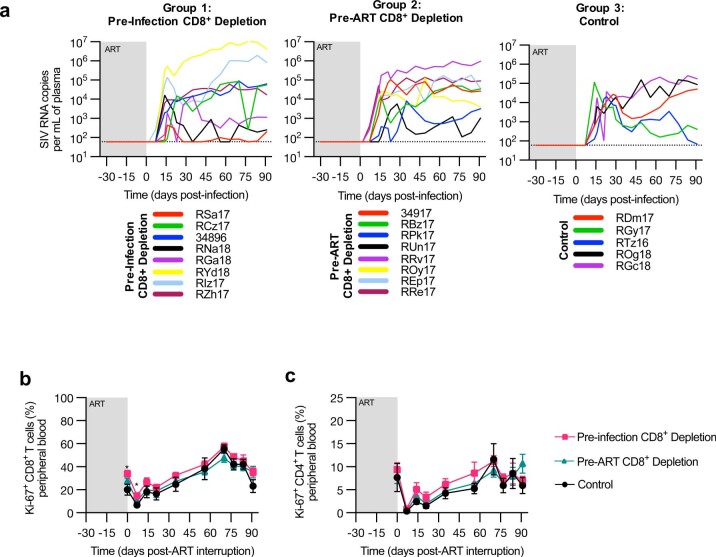
Persistence of the human immunodeficiency virus type-1 (HIV-1) latent reservoir in infected individuals remains a problem despite fully suppressive antiretroviral therapy (ART). While reservoir formation begins during acute infection, the mechanisms responsible for its establishment remain unclear. CD8+ T cells are important during the initial control of viral replication. Here we examined the effect of CD8+ T cells on formation of the latent reservoir in simian immunodeficiency virus (SIV)-infected macaques by performing experimental CD8+ depletion either before infection or before early (that is, day 14 post-infection) ART initiation. We found that CD8+ depletion resulted in slower decline of viremia, indicating that CD8+ lymphocytes reduce the average lifespan of productively infected cells during acute infection and early ART, presumably through SIV-specific cytotoxic T lymphocyte (CTL) activity. However, CD8+ depletion did not change the frequency of infected CD4+ T cells in the blood or lymph node as measured by the total cell-associated viral DNA or intact provirus DNA assay. In addition, the size of the persistent reservoir remained the same when measuring the kinetics of virus rebound after ART interruption. These data indicate that during early SIV infection, the viral reservoir that persists under ART is established largely independent of CTL control.


Conflict of interest statement

The authors declare no competing interests.

Figures

Fig. 1
Fig. 1. Study design, CD8+ T lymphocyte depletion and SIV plasma viral load kinetics.
a, Study design. b, CD8+ T-cell kinetics in peripheral blood after depletion. c,d, Longitudinal flow cytometry analysis of Ki-67 (c) or PD-1 (d) expression in bulk CD8+ T cells after CD8+ T-cell depletion in the Pre-infection depletion group (n = 8 macaques, magenta line), Pre-ART group (n = 8 macaques, teal line) and in the control group (n = 5 macaques, black line). e, SIV plasma viral load in the first 120 d p.i. in the three experimental groups (n = 21 macaques). Limit of detection is 60 copies of SIV RNA per ml of plasma (horizontal dotted line). f, Plasma viral load comparison among the 3 groups at days 14 and 21 (left side) and days 28 and 35 (right side). g, Viral load 7 d decline rate. In ae: blue arrow indicates SIVmac239M infection; red and orange arrows indicate the administration of 50 mg kg−1 MT807R1 before infection or ART initiation, respectively. Grey box represents time on ART. In be: data are mean ± s.e.m. Kruskal Wallis test was used to compare the values between the groups. In bg: magenta squares/lines represent the Pre-Infection group (n = 8 macaques), teal triangles/lines represent the Pre-ART group (n = 8 macaques), black circles/lines represent the control group (n = 5 macaques). In f and g: the horizontal bar in each group represents the mean. A two-sided Welch’s t-test was used to compare values between the groups. *P < 0.05, **P < 0.01, ***P < 0.001, ****P < 0.0001. Source data
Fig. 2
Fig. 2. CD8+ T lymphocyte depletion does not increase the size of the SIV reservoir.
a,b, SIV cell-associated DNA in peripheral blood (a) and in lymph nodes (b). c,d, CA-DNA decline rate between various time points after ART initiation in both peripheral blood (days 0 and 14; days 14 and 28; days 28 and 42) (c) and lymph nodes (days 0 and 14; days 14 and 28; days 28 and 56) (d). e,f, SIV intact proviral DNA in peripheral blood (e) and lymph nodes (f). g,h, Intact proviral DNA decline rate between various time points after ART initiation in both peripheral blood (days 0 and 28; days 28 and 56; days 56 and 105) (g) and lymph nodes (days 0 and 28; days 28 and 56; days 56 and 105) (h). ik, Model fitting of the levels of SIV plasma viral load (i), CA-DNA (j) and CA-RNA (k). The group-based model predictions are shown as thick lines. The data for individual animals are shown as thin lines. The grey dashed line in i indicates the limit of detection. For each group, the parameters (Supplementary Table 2) were estimated under a nonlinear mixed-effects modelling approach. In ak: Pre-infection depletion group (n = 8 macaques, magenta squares/line), Pre-ART group (n = 8 macaques, teal triangles/line) and control group (n = 5 macaques, black circles/line). In a, b, e and f: blue triangle indicates SIVmac239M infection, red triangle indicates CD8+ T-cell depletion before infection, and orange triangle indicates CD8+ T-cell depletion before ART initiation. Grey box represents ART. Longitudinal analysis after CD8+ T-cell depletion was performed in CD4+ T cells derived from peripheral blood and lymph node biopsies. Data are mean ± s.e.m. Kruskal Wallis test was used to compare the values between the groups. In c, d, g and h: the horizontal bar in each group represents the mean. A two-sided Welch’s t-test was used to compare the values between the groups. *P < 0.05, **P < 0.01, ***P < 0.001, ****P < 0.0001.
Fig. 3
Fig. 3. Viral rebound after treatment interruption.
a, SIV plasma viral load after treatment interruption until necropsy in the three experimental groups. Limit of detection is 60 copies of SIV RNA per ml of plasma (horizontal dotted line). Grey box represents ART. Data are mean ± s.e.m. Kruskal Wallis test was used to compare the values between the groups. b, Frequency of virus reactivation after treatment interruption (estimated on the basis of the number and size of barcoded clonotypes observed). c, Viral load growth rate per day during early rebound. d, Setpoint viral load (time-weighted area under curve of viral load at days 30–60 after viral detection). In ad: Pre-infection depletion group (n = 8 macaques, magenta square/line), Pre-ART depletion group (n = 8 macaques, teal triangle/line) and control group (n = 5 macaques, black circle/line). In bd: bars indicate the median with interquartile range. Kruskal Wallis test was used to compare the values between the groups.
Extended Data Fig. 1
Extended Data Fig. 1. SIV-specific CD8+ T cell responses 14 days post-infection and during long-term ART.
Frequency of CD107a+, TNF-α+, IFN-γ+, IL-2+, and Granzyme B+ cells was measured in memory CD8+ T cells from peripheral blood (a; n = 6 macaques, grey circle), lymph node (b; n = 5 macaques, black circle) at day 14 post-infection, and from peripheral blood during long-term ART (c). For Figure c: Pre-infection depletion group (n = 8 macaques, magenta square), Pre-ART depletion group (n = 8 macaques, teal triangle), and control group (n = 5 macaques, black circle). Horizontal dashed line represents the below detection limit.
Extended Data Fig. 2
Extended Data Fig. 2. Effectiveness of CD8+ T cell depletion, longitudinal CD8+ T cell frequencies, Ki-67, and PD-1 expression.
a. Representative flow cytometry shows the absence of CD8β+ cells 7 days post-depletion in the peripheral blood. b. Comparison of CD8β+ frequency to pre-depletion baseline calculated in all CD8depleted macaques (n = 16). For figures ci: Blue triangle indicates SIVmac239M infection, red triangle indicates CD8+ T cell depletion prior to infection, orange triangle indicates CD8+ T cell depletion prior to ART initiation. Grey box represents ART. c. Lymph node CD8+ T cell kinetics in Pre-infection CD8+ depletion group (n = 8 macaques, magenta line), Pre-ART CD8+ depletion group (n = 8 macaques, teal line), and control group (n = 5 macaques, black line). Data are mean ± s.e.m. In Figures ci: lines on each graph represents individual animals in each study group and indicated in key under each column of graphs. d, e. Longitudinal CD8+ T cell percentage in peripheral blood (d), lymph node biopsies (e) in the three experimental groups. f,g. Longitudinal flow cytometry analysis of Ki-67 expression in bulk CD8+ T cells after CD8+ T cell depletion in peripheral blood (f) and lymph node biopsies (g). h, i. Longitudinal flow cytometry analysis of PD-1 expression in bulk CD8+ T cells after CD8+ T cell depletion in peripheral blood and lymph node biopsies.
Extended Data Fig. 3
Extended Data Fig. 3. Phenotypic changes to CD8+ T cells after depletion and reconstitution.
Longitudinal flow cytometry analysis after CD8+ T cell depletion in Pre-infection CD8+ depletion group (n = 8 macaques), Pre-ART CD8+ depletion group (n = 8 macaques), and control group (n = 5 macaques). Blue triangle indicates SIVmac239M infection, red triangle indicates CD8+ T cell depletion prior to infection, orange triangle indicates CD8+ T cell depletion prior to ART initiation. Grey box represents ART. Lines on each graph represents individual animals in each study group and indicated in key under each column of graphs. Percentage of CD28 + CD95 TN, CD28+CD95+ TCM, and CD28CD95+ TEM CD8+ T cells in peripheral blood (a-c) and lymph nodes (df).
Extended Data Fig. 4
Extended Data Fig. 4. CD8+ T cell depletion in SIV-infected Rhesus macaques does not increase CD4+ T cell proliferation.
In Figures a–c: Blue triangle indicates SIVmac239M infection, red triangle indicates CD8+ T cell depletion prior to infection, orange triangle indicates CD8+ T cell depletion prior to ART initiation. Grey box represents ART. a. CD4+ T cell count in peripheral blood in Pre-infection CD8+ depletion group (n = 8 macaques, magenta line), Pre-ART CD8+ depletion group (n = 8 macaques, teal line), and control group (n = 5 macaques, black line). Data are mean ± s.e.m. Kruskal Wallis test was used to compare the value between the groups. b,c. Lines on each graph represents individual animals in each study group and indicated in key under each column of graphs. Longitudinal flow cytometry analysis after CD8+ T cell depletion Pre-infection CD8+ depletion group (n = 8 macaques, magenta line), Pre-ART CD8+ depletion group (n = 8 macaques, teal line), and control group (n = 5 macaques, black line). Percentage of bulk CD4+ T cells that express Ki-67 in peripheral blood (b) and lymph nodes (c). * p value less than 0.05; ** p value less than 0.01.
Extended Data Fig. 5
Extended Data Fig. 5. Phenotypic changes to CD4+ T cells after CD8+ depletion.
Longitudinal flow cytometry analysis after CD8+ T cell depletion in Pre-infection CD8+ depletion group (n = 8 macaques, magenta line), Pre-ART CD8+ depletion group (n = 8 macaques, teal line), and control group (n = 5 macaques, black line). Blue triangle indicates SIVmac239M infection, red triangle indicates CD8+ T cell depletion prior to infection, orange triangle indicates CD8+ T cell depletion prior to ART initiation. Grey box represents ART. Lines on each graph represents individual animals in each study group and indicated in key under each column of graphs. Percentage of CD28+CD95- TN, CD28+CD95+ TCM, and CD28CD95+ TEM CD4+ T cells in peripheral blood (a-c,g) and lymph nodes (d-f,h). For Figures g, h: Data are mean ± s.e.m. Kruskal-Wallis test was used to compare values between the groups. * p value less than 0.05; ** p value less than 0.01.
Extended Data Fig. 6
Extended Data Fig. 6. Longitudinal SIV plasma viremia and barcode analysis.
For Figures a, b: SIV plasma viral load in the three experimental groups. Limit of detection is 60 copies of SIV RNA per mL of plasma (horizontal dashed line). Blue triangle indicates SIVmac239M infection, red triangle indicates CD8+ T cell depletion prior to infection, orange triangle indicates CD8+ T cell depletion prior to ART initiation. Grey box represents ART. a. SIV plasma viremia during the first 120 days p.i in the three experimental groups. Lines on each graph represents individual animals in each study group and indicated in key under each column of graphs. For Figures b, c: magenta squares/lines represent the Pre-Infection group (n = 8 macaques), teal triangles/lines represent the Pre-ART group (n = 8 macaques), black circles/lines represent the control group (n = 5 macaques). b. SIV plasma viremia until day 210 p.i in the three experimental groups. Data are mean ± s.e.m. Kruskal-Wallis tests were used to compare values between the groups. c. Analysis of the barcode diversity at day 14 post infection (at time of ART initiation). Data are mean ± SD. Kruskal-Wallis test was used to compare values between the groups. * p value less than 0.05; ** p value less than 0.01; *** p value less than 0.001; **** p value less than 0.0001.
Extended Data Fig. 7
Extended Data Fig. 7. Longitudinal cell-associated DNA and intact proviral DNA.
Longitudinal analysis after CD8+ T cell depletion in Pre-infection CD8+ depletion group (n = 8 macaques, magenta line), Pre-ART CD8+ depletion group (n = 8 macaques, teal line), and control group (n = 5 macaques, black line). Blue triangle indicates SIVmac239M infection, red triangle indicates CD8+ T cell depletion prior to infection, orange triangle indicates CD8+ T cell depletion prior to ART initiation. Grey box represents ART. Lines on each graph represents individual animals in each study group and indicated in key under each column of graphs. Cell-associated SIV DNA and intact proviral DNA were determined in CD4+ T cells derived from peripheral blood (a, c), and in lymph nodes (b, d). e, f. SIV hypermutated (HM) DNA were determined in CD4+ T cells derived from peripheral blood (e) and lymph node biopsies (f). Data are mean ± s.e.m. Kruskal-Wallis tests were used to compare values between the groups. * p value less than 0.05.
Extended Data Fig. 8
Extended Data Fig. 8. Mixed-effect model.
For Figures a–c: magenta squares/lines represent the Pre-Infection group (n = 8 macaques), teal triangles/lines represent the Pre-ART group (n = 8 macaques), black circles/lines represent the control group (n = 5 macaques). a. Model estimates of the ratio of short-lived cells to long-lived cells at ART initiation. For each group, the parameter estimate is presented as the center bar representing the estimate, and the bounds of the box representing the upper and lower limits of the 95% confidence interval. Pre-Infection group: 71.4% (95% CI = 43.2%, 89.2%); Pre-ART group: 76.0% (95% CI = 48.9%, 91.3%); control group: 48.7% (95% CI = 33.2%, 64.6%); p < 0.001 for comparison of control and each treated group. For Figures b, c: Parameter estimates are presented as fixed effect ± 95% confidence intervals of the fixed effect. b. Model estimates of the decline rate of short-lived cells. Control group = 0.65 /day (95% CI = 0.55, 0.76) versus Pre-infection depletion group = 0.38 /day (95% CI = 0.26, 0.55), (p < 0.001 vs control) and pre-ART depletion group = 0.49 /day (95% CI = 0.34, 0.72), (p = 0.010 vs. control) respectively. c. Model estimates of the plasma virus per long-lived cell. Control group = 5.2 × 104 SIV RNA copies mL−1/(CA-DNA copy/106 cells) (95% CI = 3.0 × 104, 9.1 × 104) versus Pre-infection = 1.86 × 105 (95% CI = 5.4 × 104, 6.4 × 105) (p < 0.001 vs. control) and Pre-ART = 8.7 × 104 (95% CI = 2.5 × 104, 3.0 × 105), (p = 0.14 vs. controls).
Extended Data Fig. 9
Extended Data Fig. 9. Longitudinal SIV plasma viremia and phenotypic changes after treatment interruption.
a. Longitudinal viral loads in the three experimental groups after treatment interruption. Limit of detection is 60 copies of SIV RNA per mL of plasma (horizontal dashed line). Grey box represents ART. Lines on each graph represents individual animals in each study group and indicated in key under each column of graphs. b,c. Longitudinal flow cytometry analysis after treatment interruption in Pre-infection CD8 + depletion group (n = 8 macaques, magenta line), Pre-ART CD8 + depletion group (n = 8 macaques, teal line), and control group (n = 5 macaques, black line). Grey box represents ART. Percentage of bulk CD8+ (b) or CD4+ (c) T cells that express Ki-67 in peripheral blood. Data are mean ± s.e.m. Kruskal-Wallis tests were used to compare values between the groups. * p value less than 0.05.

Comment in

Similar articles

Cited by

References

    1. Finzi D, et al. Identification of a reservoir for HIV-1 in patients on highly active antiretroviral therapy. Science. 1997;278:1295–1300. - PubMed
    1. Wong JK, et al. Recovery of replication-competent HIV despite prolonged suppression of plasma viremia. Science. 1997;278:1291–1295. - PubMed
    1. Chun TW, et al. Presence of an inducible HIV-1 latent reservoir during highly active antiretroviral therapy. Proc. Natl Acad. Sci. USA. 1997;94:13193–13197. - PMC - PubMed
    1. Evans DT, Silvestri G. Non-human primate models in AIDS research. Curr. Opin. HIV AIDS. 2013;8:255–261. - PMC - PubMed
    1. McBrien JB, et al. Mechanisms of CD8+ T cell-mediated suppression of HIV/SIV replication. Eur. J. Immunol. 2018;48:898–914. - PMC - PubMed

Publication types

MeSH terms

Substances