

Understanding metabolic alterations after SARS-CoV-2 infection: insights from the patients' oral microenvironmental metabolites
- PMID: 36690957
- PMCID: PMC9869582
- DOI: 10.1186/s12879-022-07979-y
Understanding metabolic alterations after SARS-CoV-2 infection: insights from the patients' oral microenvironmental metabolites
Abstract
Background: Coronavirus disease 2019 is a type of acute infectious pneumonia and frequently confused with influenza since the initial symptoms. When the virus colonized the patient's mouth, it will cause changes of the oral microenvironment. However, few studies on the alterations of metabolism of the oral microenvironment affected by SARS-CoV-2 infection have been reported. In this study, we explored metabolic alterations of oral microenvironment after SARS-CoV-2 infection.
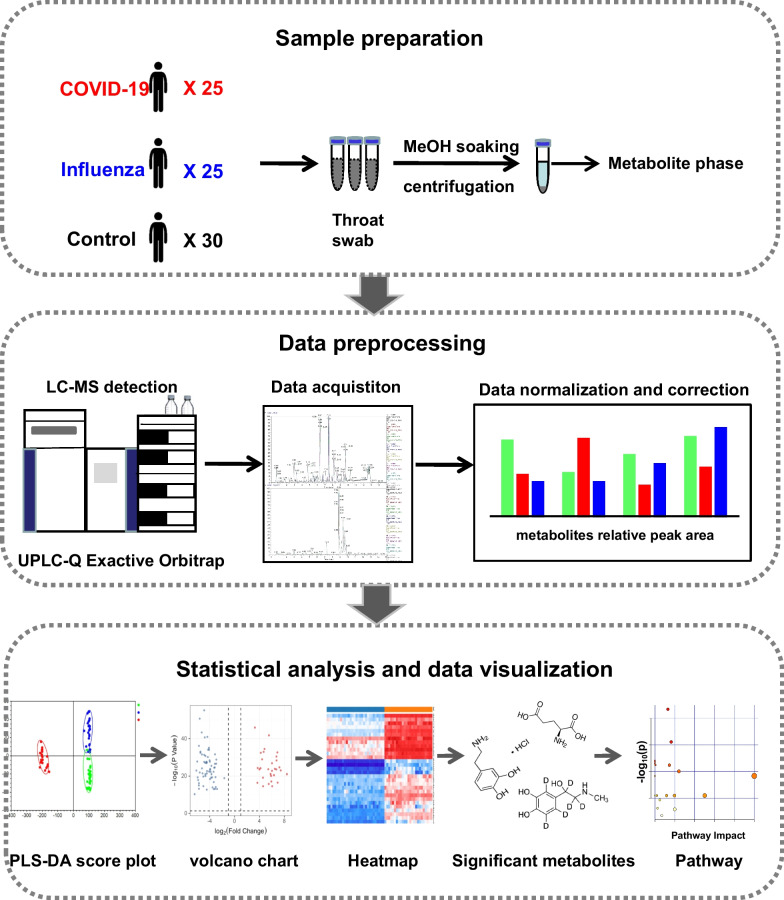
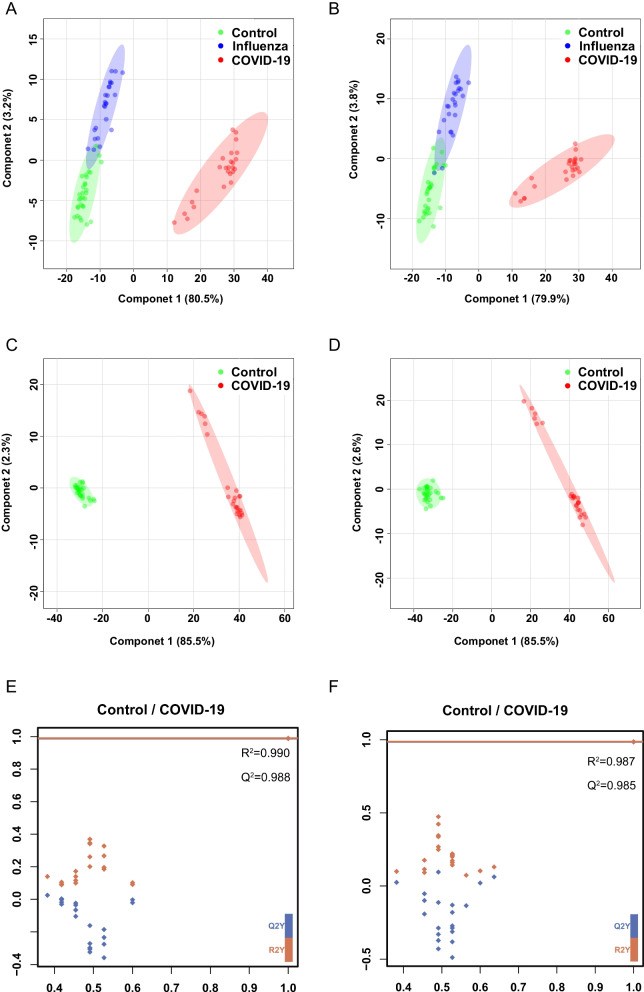
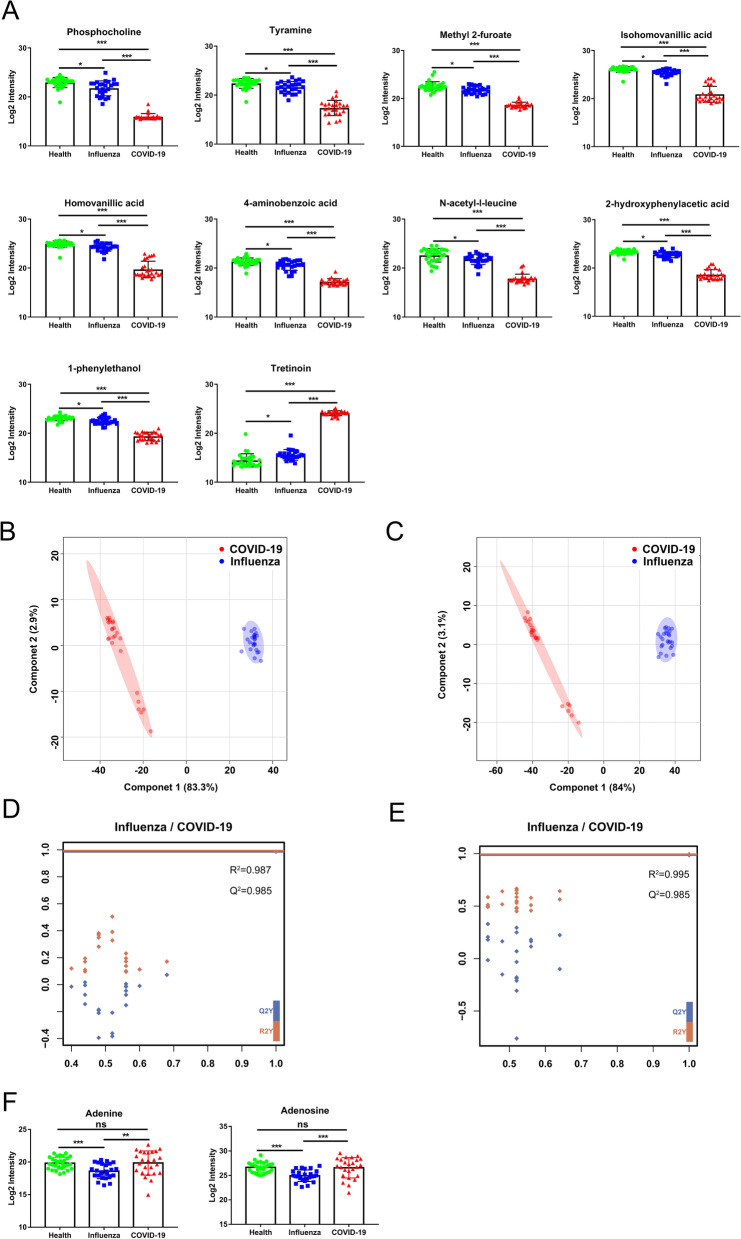
Methods: Untargeted metabolomics (UPLC-MS) was used to investigate the metabolic changes between oral secretion samples of 25 COVID-19 and 30 control participants. To obtain the specific metabolic changes of COVID-19, we selected 25 influenza patients to exclude the metabolic changes caused by the stress response of the immune system to the virus. Multivariate analysis (PCA and PLS-DA plots) and univariate analysis (students' t-test) were used to compare the differences between COVID-19 patients and the controls. Online hiplot tool was used to perform heatmap analysis. Metabolic pathway analysis was conducted by using the MetaboAnalyst 5.0 web application.
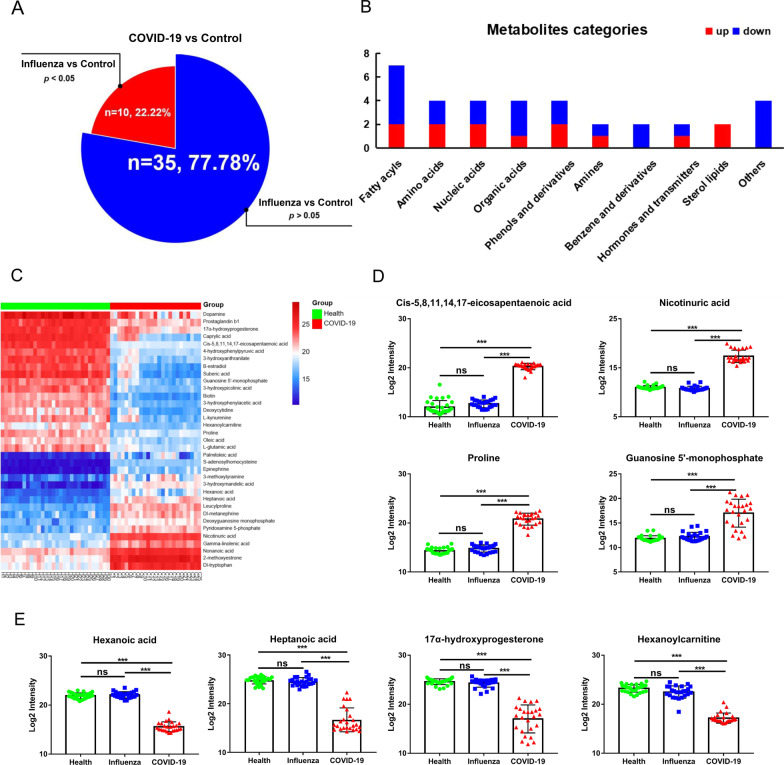
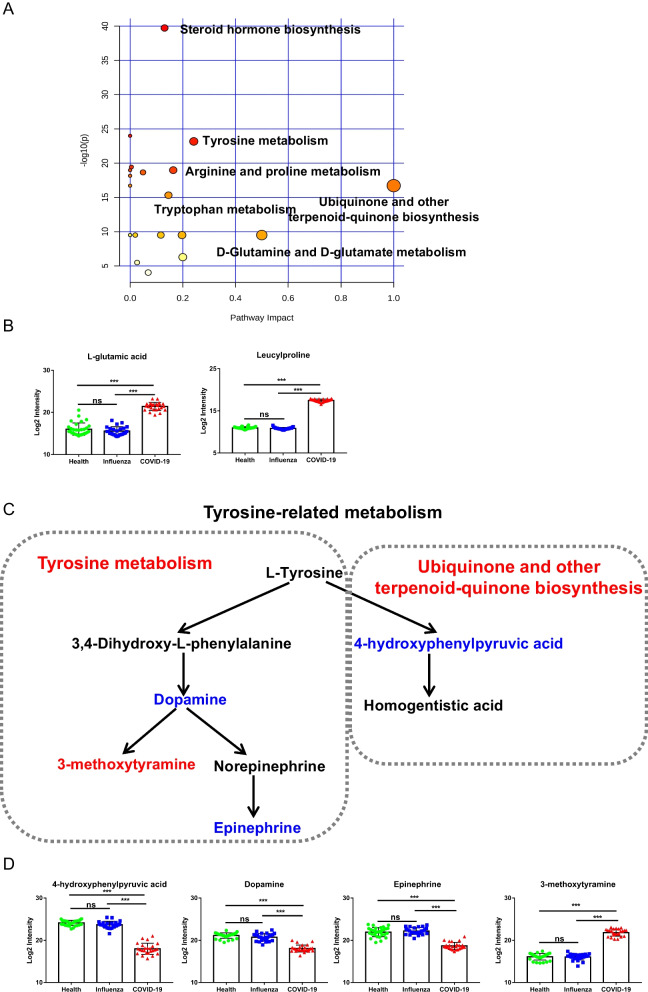
Results: PLS-DA plots showed significant separation of COVID-19 patients and the controls. A total of 45 differential metabolites between COVID-19 and control group were identified. Among them, 35 metabolites were defined as SARS-CoV-2 specific differential metabolites. Especially, the levels of cis-5,8,11,14,17-eicosapentaenoic acid and hexanoic acid changed dramatically based on the FC values. Pathway enrichment found the most significant pathways were tyrosine-related metabolism. Further, we found 10 differential metabolites caused by the virus indicating the body's metabolism changes after viral stimulation. Moreover, adenine and adenosine were defined as influenza virus-specific differential metabolites.
Conclusions: This study revealed that 35 metabolites and tyrosine-related metabolism pathways were significantly changed after SARS-CoV-2 infection. The metabolic alterations of oral microenvironment in COVID-19 provided new insights into its molecular mechanisms for research and prognostic treatment.
Keywords: COVID-19; Influenza; Metabolic pathways; Metabolomics; Oral microenvironment.
© 2023. The Author(s).
Conflict of interest statement
The authors declare that there is no conflict of interest regarding the publication of this paper.
Figures
Similar articles
-
Plasma metabolomic signatures after oral administration of ritonavir in COVID-19 treatment via chemometrics-assisted UPLC/Q-TOF/MS/MS.J Pharm Biomed Anal. 2025 Mar 15;255:116638. doi: 10.1016/j.jpba.2024.116638. Epub 2024 Dec 16. J Pharm Biomed Anal. 2025. PMID: 39700866
-
Using a targeted metabolomics approach to explore differences in ARDS associated with COVID-19 compared to ARDS caused by H1N1 influenza and bacterial pneumonia.Crit Care. 2024 Feb 27;28(1):63. doi: 10.1186/s13054-024-04843-0. Crit Care. 2024. PMID: 38414082 Free PMC article.
-
Cross-Validation of Metabolic Phenotypes in SARS-CoV-2 Infected Subpopulations Using Targeted Liquid Chromatography-Mass Spectrometry (LC-MS).J Proteome Res. 2024 Apr 5;23(4):1313-1327. doi: 10.1021/acs.jproteome.3c00797. Epub 2024 Mar 14. J Proteome Res. 2024. PMID: 38484742 Free PMC article.
-
[Applications of separation technology in novel coronavirus research, epidemic prevention and detection].Se Pu. 2021 Jul 8;39(7):679-685. doi: 10.3724/SP.J.1123.2021.03022. Se Pu. 2021. PMID: 34227364 Free PMC article. Review. Chinese.
-
Could metabolomics drive the fate of COVID-19 pandemic? A narrative review on lights and shadows.Clin Chem Lab Med. 2021 Jul 30;59(12):1891-1905. doi: 10.1515/cclm-2021-0414. Print 2021 Nov 25. Clin Chem Lab Med. 2021. PMID: 34332518 Review.
Cited by
-
Exploring the Molecular Mechanism of Niuxi-Mugua Formula in Treating Coronavirus Disease 2019 via Network Pharmacology, Computational Biology, and Surface Plasmon Resonance Verification.Curr Comput Aided Drug Des. 2024;20(7):1113-1129. doi: 10.2174/0115734099272592231004170422. Curr Comput Aided Drug Des. 2024. PMID: 37855353
-
Nucleotide, Phospholipid, and Kynurenine Metabolites Are Robustly Associated with COVID-19 Severity and Time of Plasma Sample Collection in a Prospective Cohort Study.Int J Mol Sci. 2023 Dec 26;25(1):346. doi: 10.3390/ijms25010346. Int J Mol Sci. 2023. PMID: 38203516 Free PMC article.
-
Bayesian functional analysis for untargeted metabolomics data with matching uncertainty and small sample sizes.Brief Bioinform. 2024 Mar 27;25(3):bbae141. doi: 10.1093/bib/bbae141. Brief Bioinform. 2024. PMID: 38581417 Free PMC article.
References
MeSH terms
Substances
LinkOut - more resources
Full Text Sources
Medical
Miscellaneous
