

Identification and validation of crucial lnc-TRIM28-14 and hub genes promoting gastric cancer peritoneal metastasis
- PMID: 36690975
- PMCID: PMC9872371
- DOI: 10.1186/s12885-023-10544-8
Identification and validation of crucial lnc-TRIM28-14 and hub genes promoting gastric cancer peritoneal metastasis
Abstract
Background: Gastric cancer peritoneal metastasis (GCPM) is an important cause of cancer-related deaths worldwide. Long non-coding RNAs (lncRNAs) play a key role in the regulation of GCPM, but the underlying mechanisms have not been elucidated.
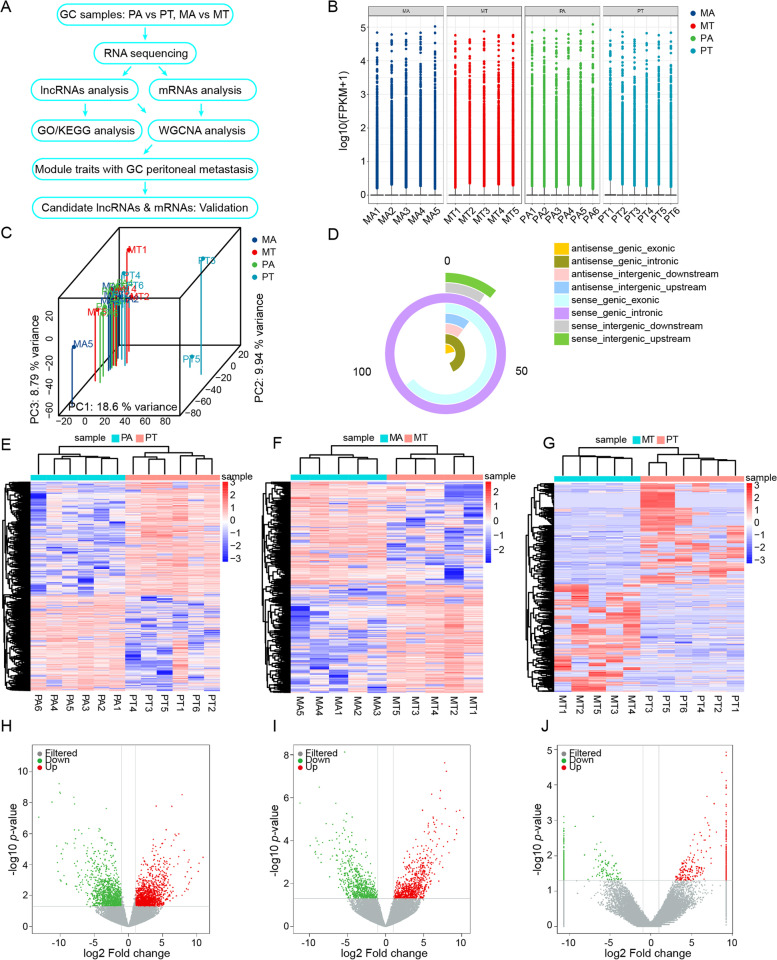
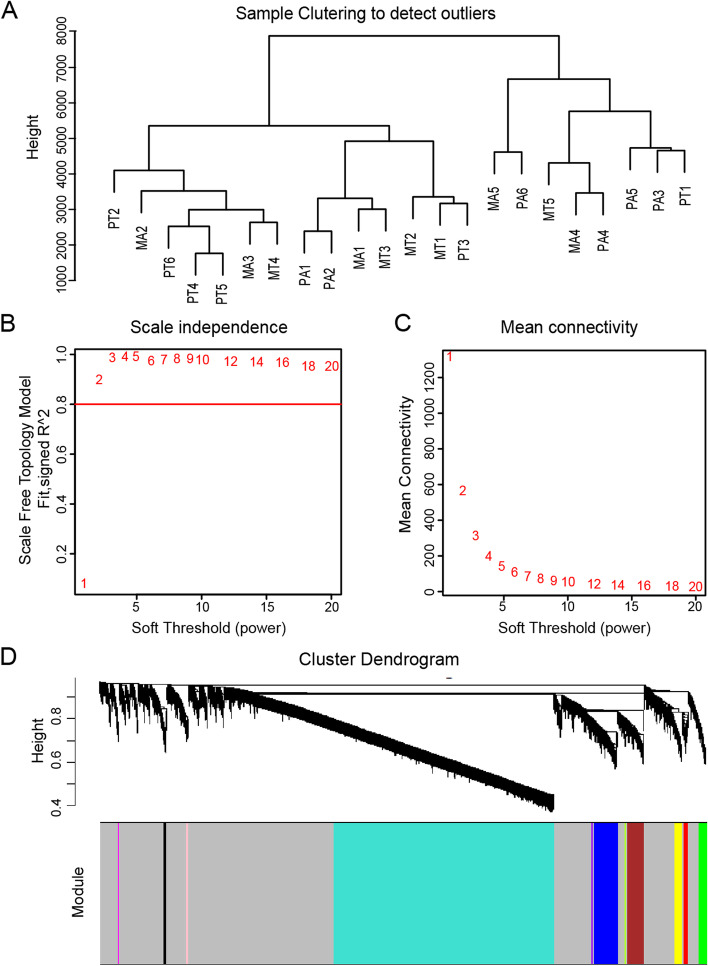
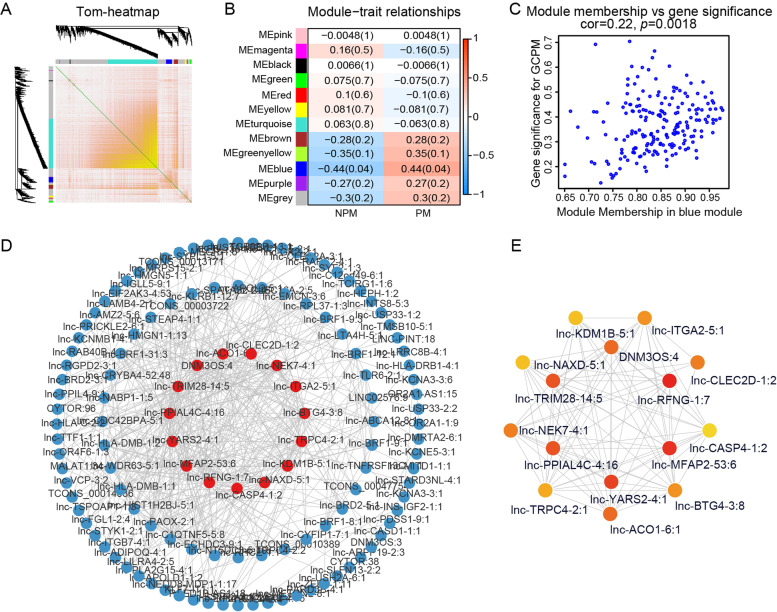
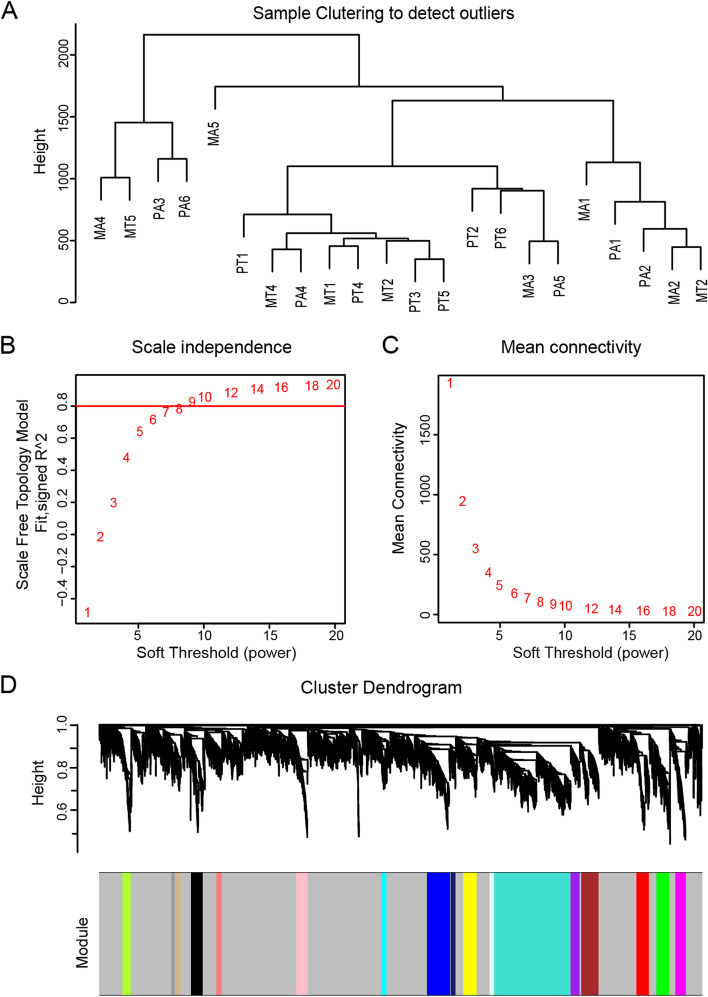
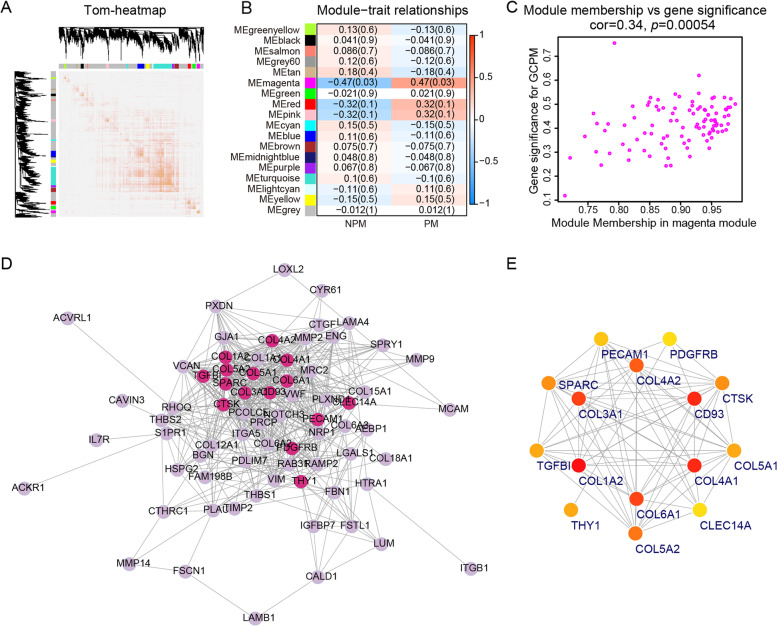
Methods: High-throughput RNA sequencing (RNA-seq) was performed on four groups of clinical specimens (non-metastatic gastric cancer primary tumor, adjacent normal gastric mucosal tissue, gastric cancer primary tumor with peritoneal metastasis and adjacent normal gastric mucosal tissue). After sequencing, many lncRNAs and mRNAs were screened for further Weighted Gene Co-expression Network Analysis (WGCNA). GCPM-related hub lncRNAs and genes were identified by cytoHubba and validated by Quantitative real-time PCR (qRT-PCR), Receiver operating characteristic curve (ROC) analysis and Kaplan-Meier survival analysis. GO, KEGG and GSEA showed GCPM-related pathways. Correlation analysis revealed the potential relationship between hub lncRNAs and genes.
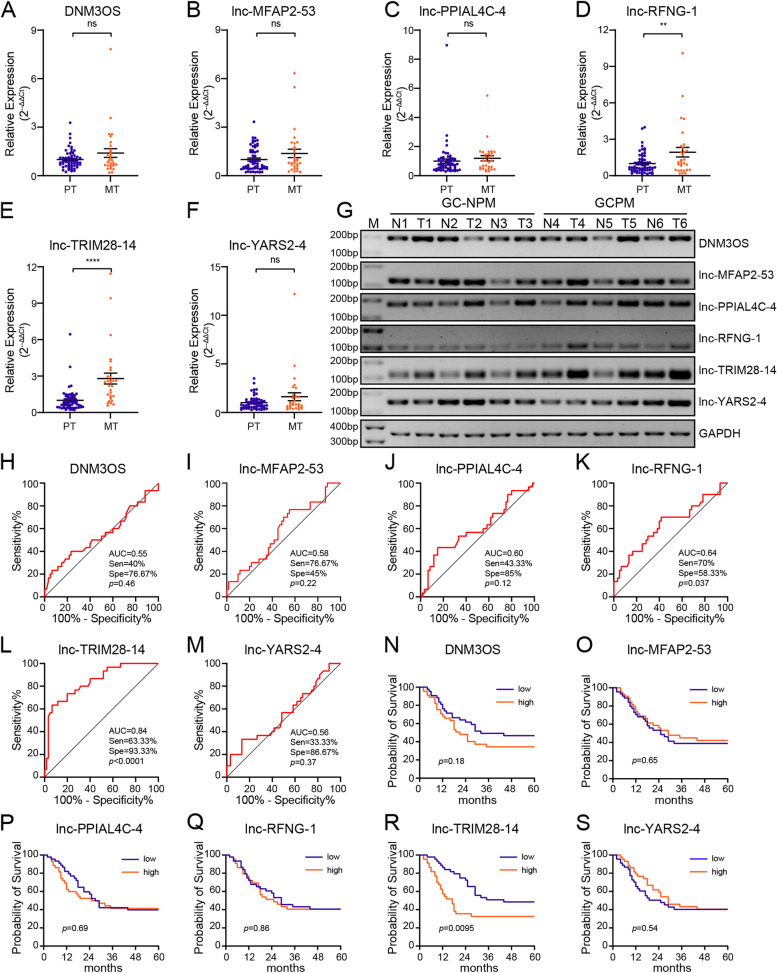
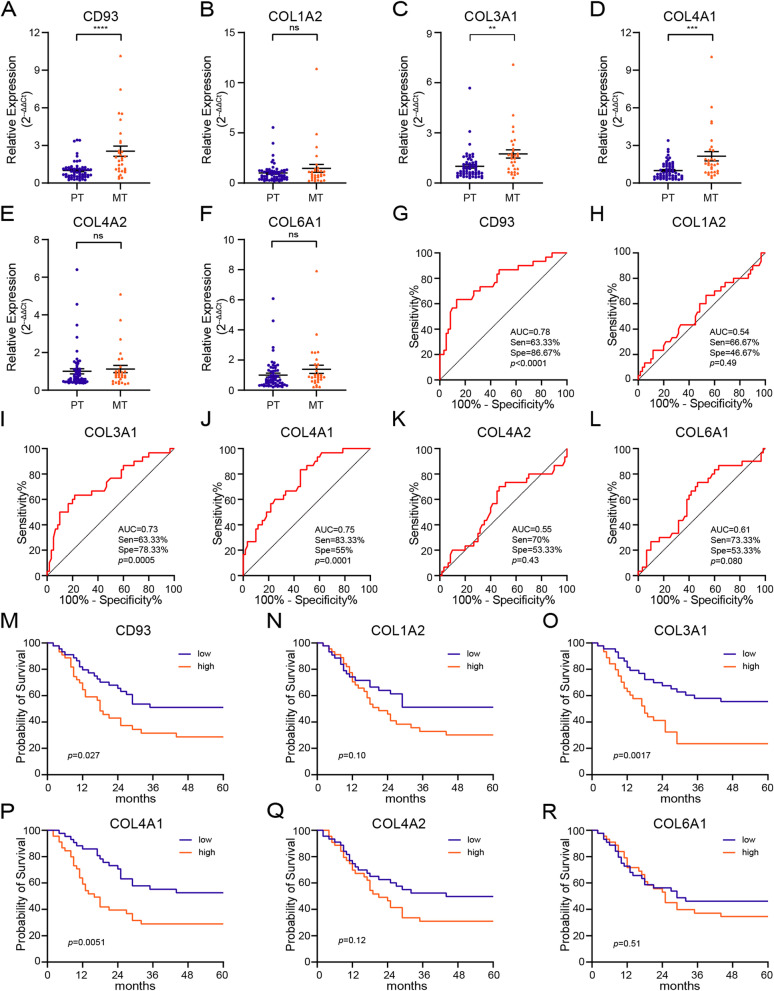
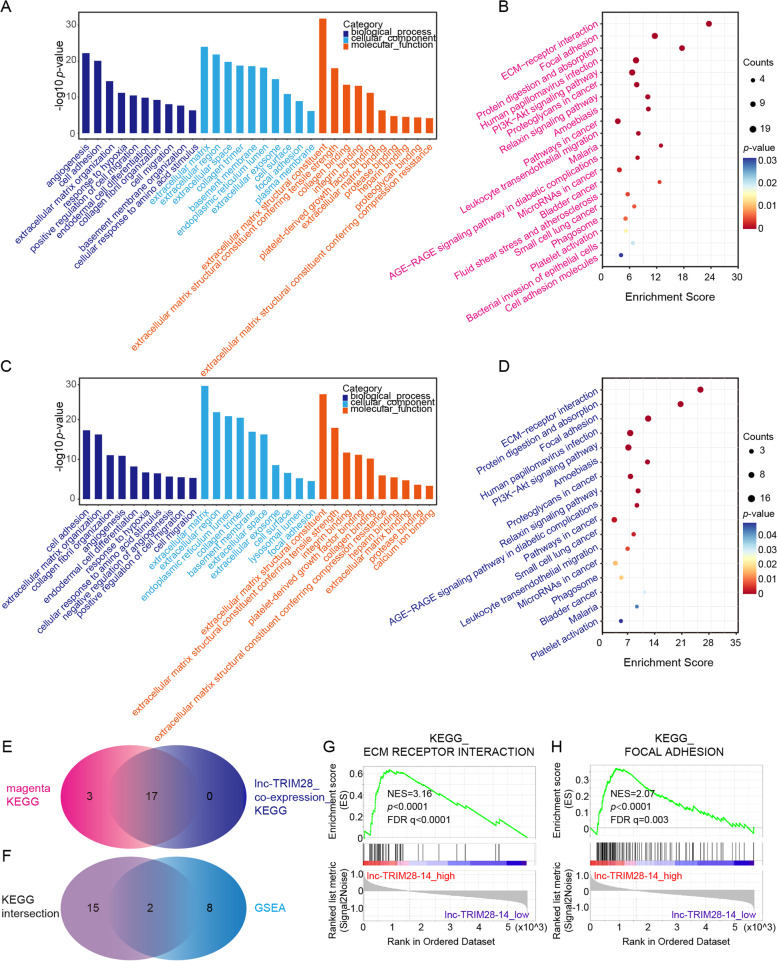
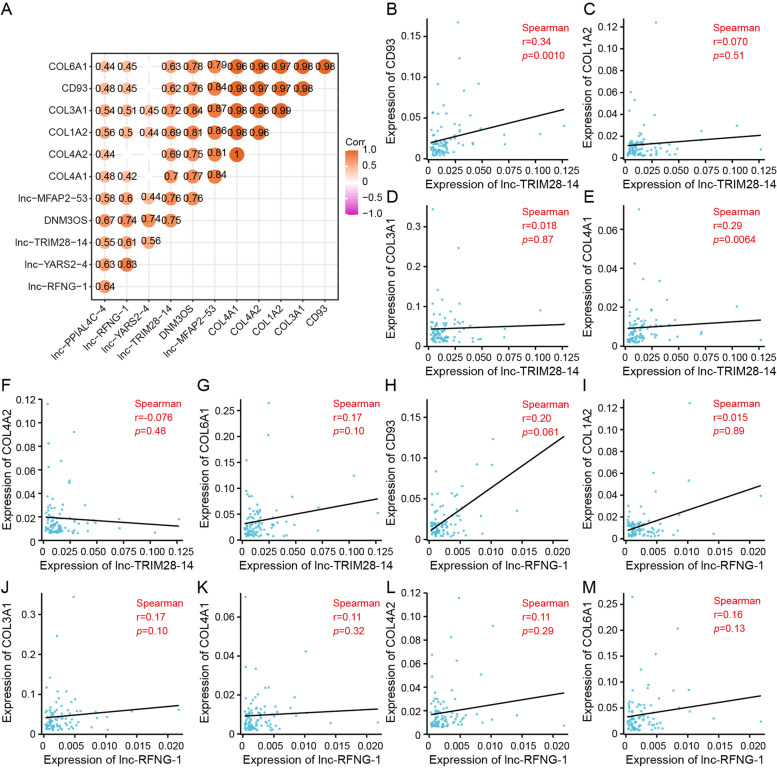
Results: By analyzing lncRNA expression data by WGCNA, we found that blue module was highly correlated with GCPM (r = 0.44, p = 0.04) and six lncRNAs involved in this module (DNM3OS, lnc-MFAP2-53, lnc-PPIAL4C-4, lnc-RFNG-1, lnc-TRIM28-14 and lnc-YARS2-4) were identified. We then performed qRT-PCR validation of gastric cancer specimens and found that the expression of lnc-RFNG-1 and lnc-TRIM28-14 was significantly increased in gastric cancer tissues with peritoneal metastasis. Kaplan-Meier survival analysis showed shorter overall survival time (OS) for gastric cancer patients with high expression of lnc-TRIM28-14. Receiver operating characteristic curve (ROC) analysis showed that lnc-TRIM28-14 could improve the sensitivity and specificity of GCPM diagnosis. In addition, we identified three key mRNAs (CD93, COL3A1 and COL4A1) associated with gastric cancer peritoneal metastasis through WGCNA analysis and clinical specimen validation. Moreover, there was a positive correlation between lnc-TRIM28-14 and the expression of CD93 and COL4A1 in gastric cancer peritoneal metastasis, suggesting a regulatory relationship between them. Subsequent GO, KEGG and GSEA analysis suggested that ECM-receptor interaction and focal adhesion were the hub pathways of GCPM.
Conclusion: In summary, lnc-RFNG-1, lnc-TRIM28-14, CD93, COL3A1 and COL4A1 could be novel tumor biomarkers and potential therapeutic targets for GCPM.
Keywords: Gastric cancer; Peritoneal metastasis; RNA-seq; WGCNA; lncRNA.
© 2023. The Author(s).
Conflict of interest statement
The authors declare that they have no conflicts of interest.
Figures
Similar articles
-
Transcriptional landscape and predictive potential of long noncoding RNAs in peritoneal recurrence of gastric cancer.Mol Cancer. 2024 Dec 30;23(1):284. doi: 10.1186/s12943-024-02196-4. Mol Cancer. 2024. PMID: 39736670 Free PMC article.
-
Deregulation of lncRNA HIST1H2AG-6 and AIM1-3 in peripheral blood mononuclear cells is associated with newly diagnosed type 2 diabetes.BMC Med Genomics. 2021 Jun 6;14(1):149. doi: 10.1186/s12920-021-00994-z. BMC Med Genomics. 2021. PMID: 34092238 Free PMC article.
-
Peritoneal cancer index (PCI) based patient selecting strategy for complete cytoreductive surgery plus hyperthermic intraperitoneal chemotherapy in gastric cancer with peritoneal metastasis: A single-center retrospective analysis of 125 patients.Eur J Surg Oncol. 2021 Jun;47(6):1411-1419. doi: 10.1016/j.ejso.2020.11.139. Epub 2020 Dec 1. Eur J Surg Oncol. 2021. PMID: 33293213
-
Two decades of progress in gastric cancer peritoneal metastasis: a bibliometric perspective on molecular mechanisms and therapeutic innovations.Front Oncol. 2025 May 30;15:1583364. doi: 10.3389/fonc.2025.1583364. eCollection 2025. Front Oncol. 2025. PMID: 40519309 Free PMC article.
-
Integration of Genomic Biology Into Therapeutic Strategies of Gastric Cancer Peritoneal Metastasis.J Clin Oncol. 2022 Aug 20;40(24):2830. doi: 10.1200/JCO.21.02745. Epub 2022 Jun 1. J Clin Oncol. 2022. PMID: 35649219 Free PMC article. Review.
Cited by
-
Metastasis-related long non-coding RNAs AL359220.1, SH3BP5-AS1 and ZF-AS1 are significant for prognostic assessment of lung adenocarcinoma.Aging (Albany NY). 2023 Aug 10;15(15):7551-7564. doi: 10.18632/aging.204923. Epub 2023 Aug 10. Aging (Albany NY). 2023. PMID: 37566767 Free PMC article.
-
Transcriptional landscape and predictive potential of long noncoding RNAs in peritoneal recurrence of gastric cancer.Mol Cancer. 2024 Dec 30;23(1):284. doi: 10.1186/s12943-024-02196-4. Mol Cancer. 2024. PMID: 39736670 Free PMC article.
-
A novel prognostic model based on immunogenic cell death-related genes for improved risk stratification in hepatocellular carcinoma patients.J Cancer Res Clin Oncol. 2023 Sep;149(12):10255-10267. doi: 10.1007/s00432-023-04950-5. Epub 2023 Jun 3. J Cancer Res Clin Oncol. 2023. PMID: 37269346 Free PMC article.
-
Camrelizumab and apatinib combined with chemotherapy in perioperative effective therapy for advanced gastric carcinoma with peritoneal metastasis: a case report.J Gastrointest Oncol. 2023 Dec 31;14(6):2658-2667. doi: 10.21037/jgo-23-741. Epub 2023 Dec 18. J Gastrointest Oncol. 2023. PMID: 38196525 Free PMC article.
-
Revealing Potential Therapeutic Targets in Gastric Cancer through Inflammation and Protein-Protein Interaction Hub Networks.J Cancer. 2025 Jun 12;16(8):2720-2736. doi: 10.7150/jca.112218. eCollection 2025. J Cancer. 2025. PMID: 40535808 Free PMC article.
References
MeSH terms
Substances
LinkOut - more resources
Full Text Sources
Medical
Miscellaneous
