

Temporal relationship between atherogenic dyslipidemia and inflammation and their joint cumulative effect on type 2 diabetes onset: a longitudinal cohort study
- PMID: 36691001
- PMCID: PMC9870774
- DOI: 10.1186/s12916-023-02729-6
Temporal relationship between atherogenic dyslipidemia and inflammation and their joint cumulative effect on type 2 diabetes onset: a longitudinal cohort study
Abstract
Background: Concurrent atherogenic dyslipidemia and elevated inflammation are commonly observed in overt hyperglycemia and have long been proposed to contribute to diabetogenesis. However, the temporal relationship between them and the effect of their cumulative co-exposure on future incident type 2 diabetes (T2D) remains unclear.
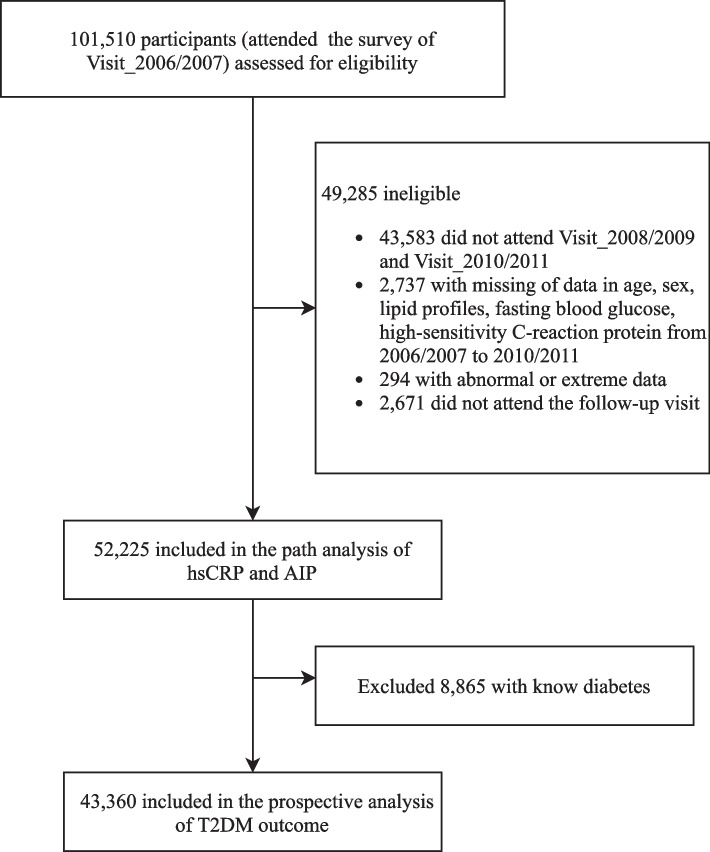
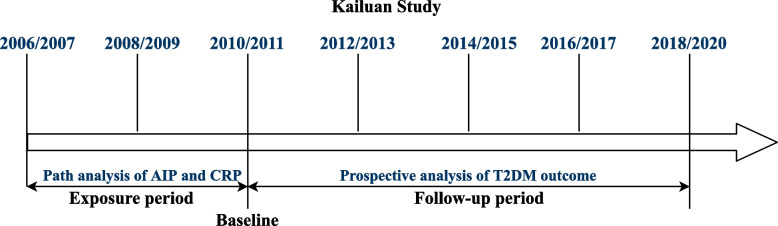
Methods: Longitudinal analysis of data on 52,224 participants from a real-world, prospective cohort study (Kailuan Study) was performed to address the temporal relationship between high-sensitivity C-reactive protein (hsCRP) and the atherogenic index of plasma (AIP, calculated as triglyceride/high-density lipoprotein) in an approximately 4-year exposure period (2006/2007 to 2010/2011). After excluding 8824 participants with known diabetes, 43,360 nondiabetic participants were included for further analysis of the T2D outcome. Cox regression models were used to examine the adjusted hazard ratios (aHRs) upon the cumulative hsCRP (CumCRP) and AIP (CumAIP) in the exposure period.
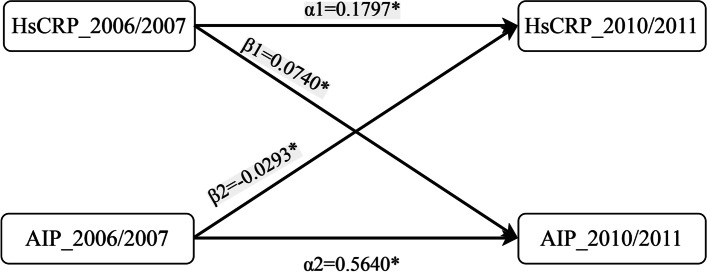
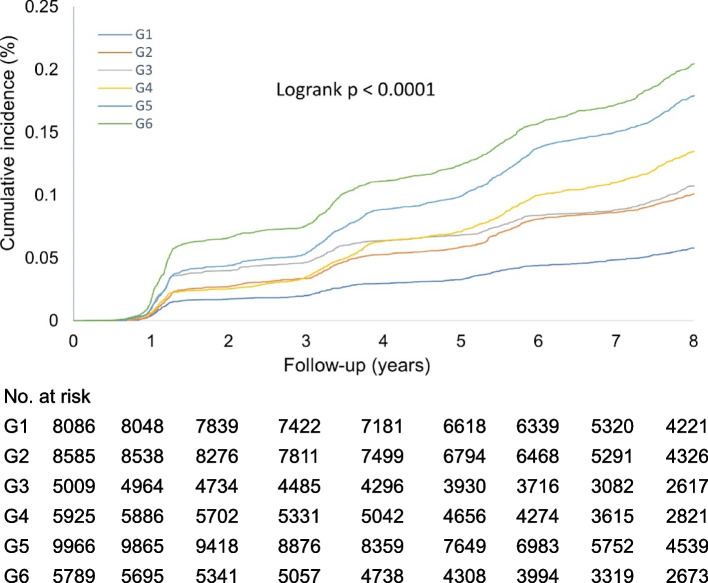
Results: In temporal analysis, the adjusted standardized correlation coefficient (β1) of hsCRP_2006/2007 and AIP_2010/2011 was 0.0740 (95% CI, 0.0659 to 0.0820; P < 0.001), whereas the standardized correlation coefficient (β2) of AIP_2006/2007 and hsCRP_2010/2011 was - 0.0293 (95% CI, - 0.0385 to - 0.0201; P < 0.001), which was significantly less than β1 (P < 0.001). During a median follow-up of 7.9 years, 5,118 T2D cases occurred. Isolated exposure to CumAIP or CumCRP was dose-dependently associated with T2D risks, independent of traditional risk factors. Significant interactions were observed between the median CumAIP (- 0.0701) and CumCRP thresholds (1, 3 mg/L) (P = 0.0308). Compared to CumAIP < - 0.0701 and CumCRP < 1 mg/L, those in the same CumAIP stratum but with increasing CumCRP levels had an approximately 1.5-fold higher T2D risk; those in higher CumAIP stratum had significantly higher aHRs (95% CIs): 1.64 (1.45-1.86), 1.87 (1.68-2.09), and 2.04 (1.81-2.30), respectively, in the CumCRP < 1, 1 ≤ CumCRP < 3, CumCRP ≥ 3 mg/L strata. Additionally, the T2D risks in the co-exposure were more prominent in nonhypertensive, nondyslipidemic, nonprediabetic, or female participants.
Conclusions: These findings suggest a stronger association between elevated hsCRP and future AIP changes than vice versa and highlight the urgent need for combined assessment and management of chronic inflammation and atherogenic dyslipidemia in primary prevention, particularly for those with subclinical risks of T2D.
Keywords: Dyslipidemia; Inflammation; Temporal relationship Longitudinal study; Type 2 diabetes.
© 2023. The Author(s).
Conflict of interest statement
The authors declare that they have no competing interests.
Figures
Similar articles
-
Supra-additive effect of chronic inflammation and atherogenic dyslipidemia on developing type 2 diabetes among young adults: a prospective cohort study.Cardiovasc Diabetol. 2023 Jul 15;22(1):181. doi: 10.1186/s12933-023-01878-5. Cardiovasc Diabetol. 2023. PMID: 37454077 Free PMC article.
-
Measurement of cumulative high-sensitivity C-reactive protein and monocyte to high-density lipoprotein ratio in the risk prediction of type 2 diabetes: a prospective cohort study.J Transl Med. 2024 Jan 28;22(1):110. doi: 10.1186/s12967-024-04895-4. J Transl Med. 2024. PMID: 38281997 Free PMC article.
-
Association of cumulative monocyte to high-density lipoprotein ratio with the risk of type 2 diabetes: a prospective cohort study.Cardiovasc Diabetol. 2022 Dec 3;21(1):268. doi: 10.1186/s12933-022-01701-7. Cardiovasc Diabetol. 2022. PMID: 36463212 Free PMC article.
-
Meta-analysis of Atherogenic Index of Plasma and other lipid parameters in relation to risk of type 2 diabetes mellitus.Prim Care Diabetes. 2015 Feb;9(1):60-7. doi: 10.1016/j.pcd.2014.03.007. Epub 2014 May 5. Prim Care Diabetes. 2015. PMID: 24810146 Review.
-
Prognostic factors for the development and progression of proliferative diabetic retinopathy in people with diabetic retinopathy.Cochrane Database Syst Rev. 2023 Feb 22;2(2):CD013775. doi: 10.1002/14651858.CD013775.pub2. Cochrane Database Syst Rev. 2023. PMID: 36815723 Free PMC article. Review.
Cited by
-
Impact of baseline and trajectory of the atherogenic index of plasma on incident diabetic kidney disease and retinopathy in participants with type 2 diabetes: a longitudinal cohort study.Lipids Health Dis. 2024 Jan 11;23(1):11. doi: 10.1186/s12944-024-02003-5. Lipids Health Dis. 2024. PMID: 38212770 Free PMC article.
-
Nonlinear association between atherogenic index of plasma and type 2 diabetes mellitus in overweight and obesity patients: evidence from Chinese medical examination data.Cardiovasc Diabetol. 2024 Jun 29;23(1):226. doi: 10.1186/s12933-024-02330-y. Cardiovasc Diabetol. 2024. PMID: 38951808 Free PMC article.
-
Time in target range for systolic blood pressure and glucose with cardiovascular disease and all-cause mortality risks.Hypertens Res. 2025 Jan;48(1):256-272. doi: 10.1038/s41440-024-01969-0. Epub 2024 Oct 30. Hypertens Res. 2025. PMID: 39478190
-
Relationship between the cumulative exposure to atherogenic index of plasma and ischemic stroke: a retrospective cohort study.Cardiovasc Diabetol. 2023 Nov 15;22(1):313. doi: 10.1186/s12933-023-02044-7. Cardiovasc Diabetol. 2023. PMID: 37968612 Free PMC article.
-
Association between the atherogenic index of plasma and the systemic immuno-inflammatory index using NHANES data from 2005 to 2018.Sci Rep. 2025 Apr 2;15(1):11245. doi: 10.1038/s41598-025-96090-8. Sci Rep. 2025. PMID: 40175471 Free PMC article.
References
-
- Saeedi P, Petersohn I, Salpea P, Malanda B, Karuranga S, Unwin N, Colagiuri S, Guariguata L, Motala AA, Ogurtsova K, et al. Global and regional diabetes prevalence estimates for 2019 and projections for 2030 and 2045: results from the International Diabetes Federation Diabetes Atlas, 9(th) edition. Diabetes Res Clin Pract. 2019;157:107843. doi: 10.1016/j.diabres.2019.107843. - DOI - PubMed
-
- Khoo CM, Deerochanawong C, Chan SP, Matawaran B, Sheu WH, Chan J, Mithal A, Luk A, Suastika K, Yoon KH, et al. Use of sodium-glucose co-transporter-2 inhibitors in Asian patients with type 2 diabetes and kidney disease: an Asian perspective and expert recommendations. Diabetes Obes Metab. 2021;23(2):299–317. doi: 10.1111/dom.14251. - DOI - PMC - PubMed
-
- Griffin SJ, Borch-Johnsen K, Davies MJ, Khunti K, Rutten GE, Sandbæk A, Sharp SJ, Simmons RK, van den Donk M, Wareham NJ, et al. Effect of early intensive multifactorial therapy on 5-year cardiovascular outcomes in individuals with type 2 diabetes detected by screening (ADDITION-Europe): a cluster-randomised trial. Lancet. 2011;378(9786):156–167. doi: 10.1016/S0140-6736(11)60698-3. - DOI - PMC - PubMed
Publication types
MeSH terms
Substances
Grants and funding
LinkOut - more resources
Full Text Sources
Medical
Research Materials
Miscellaneous
