

Panomics reveals patient individuality as the major driver of colorectal cancer progression
- PMID: 36691026
- PMCID: PMC9869555
- DOI: 10.1186/s12967-022-03855-0
Panomics reveals patient individuality as the major driver of colorectal cancer progression
Abstract
Background: Colorectal cancer (CRC) is one of the most prevalent cancers, with over one million new cases per year. Overall, prognosis of CRC largely depends on the disease stage and metastatic status. As precision oncology for patients with CRC continues to improve, this study aimed to integrate genomic, transcriptomic, and proteomic analyses to identify significant differences in expression during CRC progression using a unique set of paired patient samples while considering tumour heterogeneity.
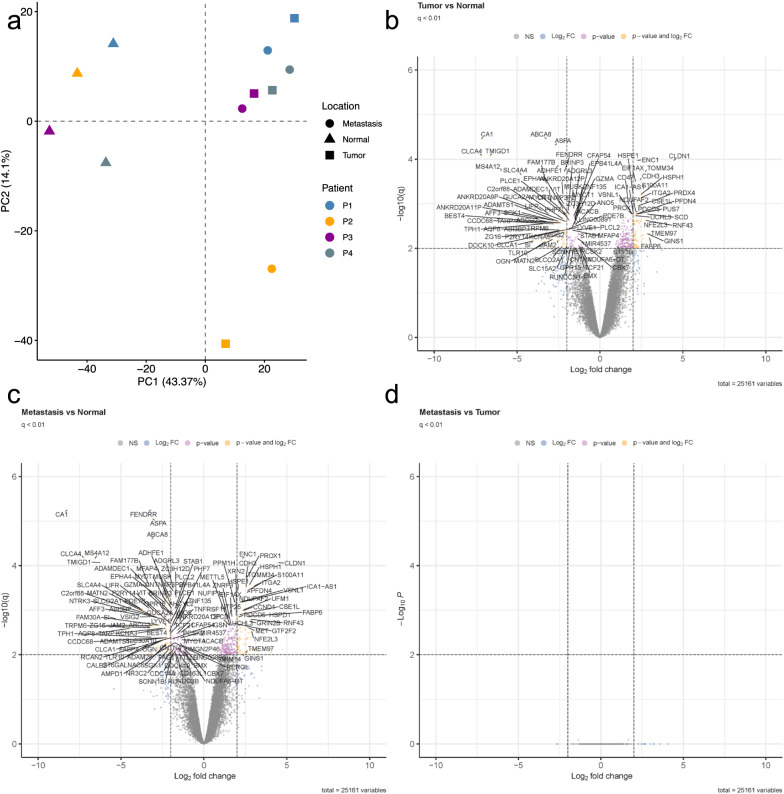
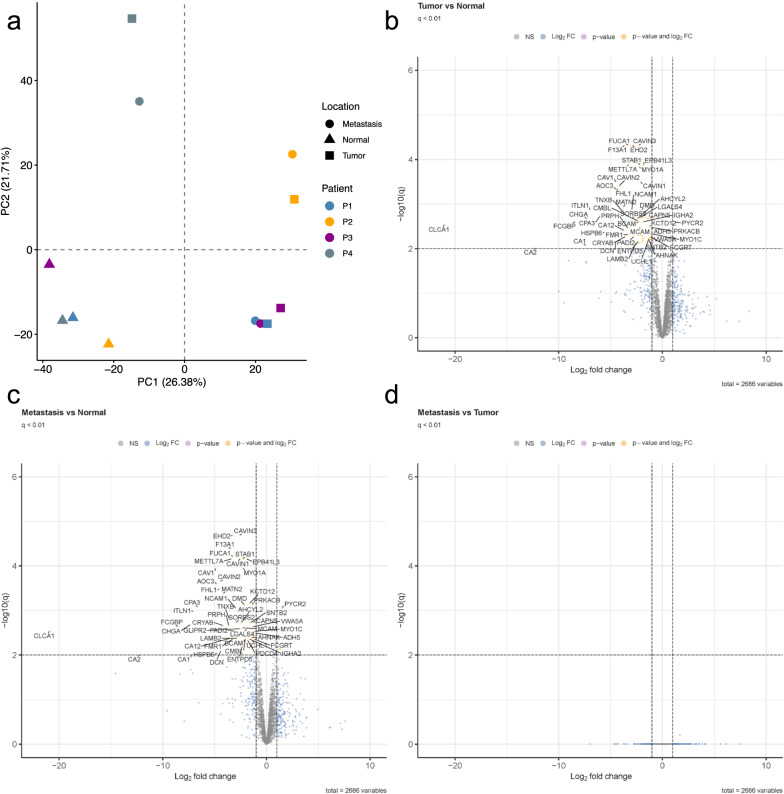
Methods: We analysed fresh-frozen tissue samples prepared under strict cryogenic conditions of matched healthy colon mucosa, colorectal carcinoma, and liver metastasis from the same patients. Somatic mutations of known cancer-related genes were analysed using Illumina's TruSeq Amplicon Cancer Panel; the transcriptome was assessed comprehensively using Clariom D microarrays. The global proteome was evaluated by liquid chromatography-coupled mass spectrometry (LC‒MS/MS) and validated by two-dimensional difference in-gel electrophoresis. Subsequent unsupervised principal component clustering, statistical comparisons, and gene set enrichment analyses were calculated based on differential expression results.
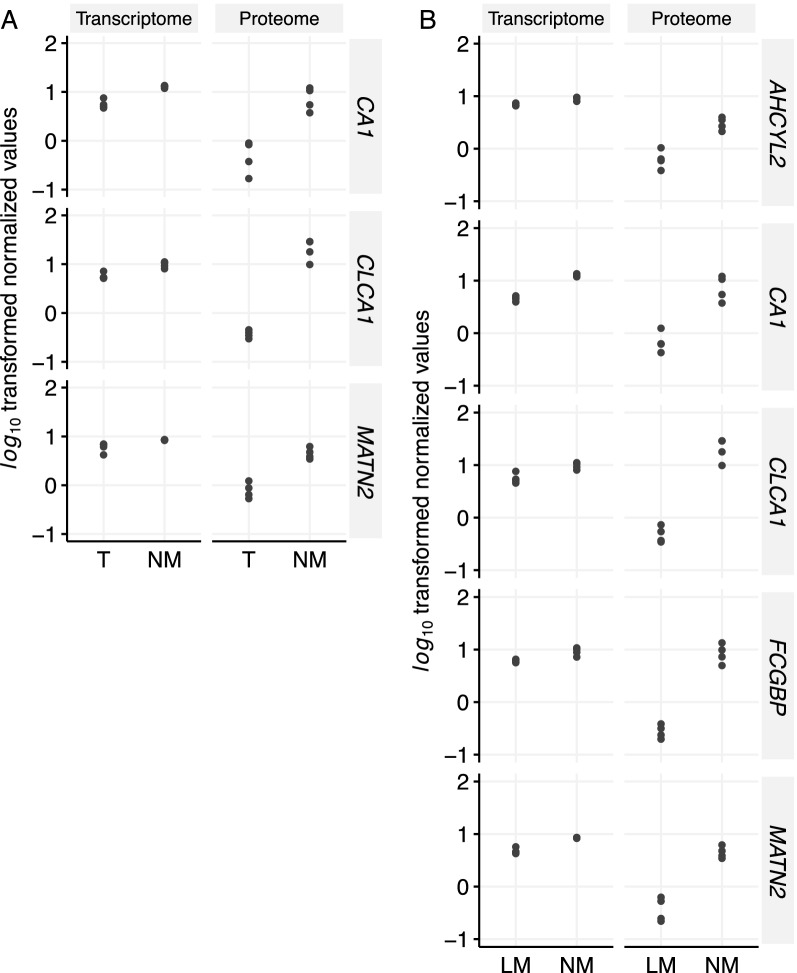
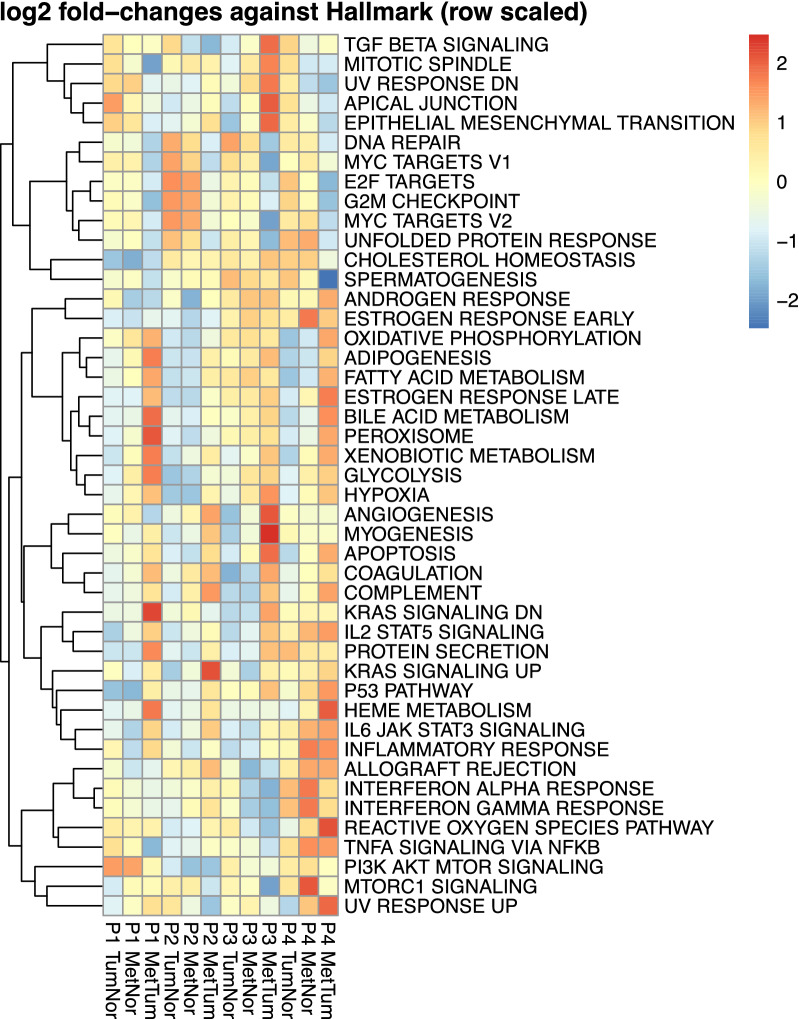
Results: Although panomics revealed low RNA and protein expression of CA1, CLCA1, MATN2, AHCYL2, and FCGBP in malignant tissues compared to healthy colon mucosa, no differentially expressed RNA or protein targets were detected between tumour and metastatic tissues. Subsequent intra-patient comparisons revealed highly specific expression differences (e.g., SRSF3, OLFM4, and CEACAM5) associated with patient-specific transcriptomes and proteomes.
Conclusion: Our research results highlight the importance of inter- and intra-tumour heterogeneity as well as individual, patient-paired evaluations for clinical studies. In addition to changes among groups reflecting CRC progression, we identified significant expression differences between normal colon mucosa, primary tumour, and liver metastasis samples from individuals, which might accelerate implementation of precision oncology in the future.
Keywords: Biomarkers; Colorectal cancer; Metastasis; Panomics; Patient individuality; Tumour heterogeneity.
© 2023. The Author(s).
Conflict of interest statement
The authors declare that there are no competing interests.
Figures
Similar articles
-
Colorectal Cancer Cell Line Proteomes Are Representative of Primary Tumors and Predict Drug Sensitivity.Gastroenterology. 2017 Oct;153(4):1082-1095. doi: 10.1053/j.gastro.2017.06.008. Epub 2017 Jun 16. Gastroenterology. 2017. PMID: 28625833 Free PMC article.
-
Identification and Verification of Two Novel Differentially Expressed Proteins from Non-neoplastic Mucosa and Colorectal Carcinoma Via iTRAQ Combined with Liquid Chromatography-Mass Spectrometry.Pathol Oncol Res. 2020 Apr;26(2):967-976. doi: 10.1007/s12253-019-00651-y. Epub 2019 Mar 29. Pathol Oncol Res. 2020. PMID: 30927204
-
The proteomics of colorectal cancer: identification of a protein signature associated with prognosis.PLoS One. 2011;6(11):e27718. doi: 10.1371/journal.pone.0027718. Epub 2011 Nov 18. PLoS One. 2011. PMID: 22125622 Free PMC article.
-
Proteomics for discovery of candidate colorectal cancer biomarkers.World J Gastroenterol. 2014 Apr 14;20(14):3804-24. doi: 10.3748/wjg.v20.i14.3804. World J Gastroenterol. 2014. PMID: 24744574 Free PMC article. Review.
-
Secretome Proteomic Approaches for Biomarker Discovery: An Update on Colorectal Cancer.Medicina (Kaunas). 2020 Aug 31;56(9):443. doi: 10.3390/medicina56090443. Medicina (Kaunas). 2020. PMID: 32878319 Free PMC article. Review.
Cited by
-
Proteomics-based identification of proteins in tumor-derived exosomes as candidate biomarkers for colorectal cancer.World J Gastrointest Oncol. 2023 Jul 15;15(7):1227-1240. doi: 10.4251/wjgo.v15.i7.1227. World J Gastrointest Oncol. 2023. PMID: 37546562 Free PMC article.
-
Hemoglobin signal network mapping reveals novel indicators for precision medicine.Sci Rep. 2023 Oct 25;13(1):18257. doi: 10.1038/s41598-023-43694-7. Sci Rep. 2023. PMID: 37880310 Free PMC article.
-
Multi-Omic Analysis: A Possible Platform Toward Personalized and Adaptable Cancer Treatment.Ann Surg Oncol. 2024 Aug;31(8):4831-4833. doi: 10.1245/s10434-024-15449-9. Epub 2024 May 22. Ann Surg Oncol. 2024. PMID: 38777897 No abstract available.
References
Publication types
MeSH terms
Substances
LinkOut - more resources
Full Text Sources
Medical
Molecular Biology Databases
Research Materials
Miscellaneous
