. 2023 Jan 24;22(1):17.
doi: 10.1186/s12943-023-01713-1.

Molecular differences of angiogenic versus vessel co-opting colorectal cancer liver metastases at single-cell resolution

Affiliations

Molecular differences of angiogenic versus vessel co-opting colorectal cancer liver metastases at single-cell resolution

Johannes Robert Fleischer et al. Mol Cancer. .

Abstract

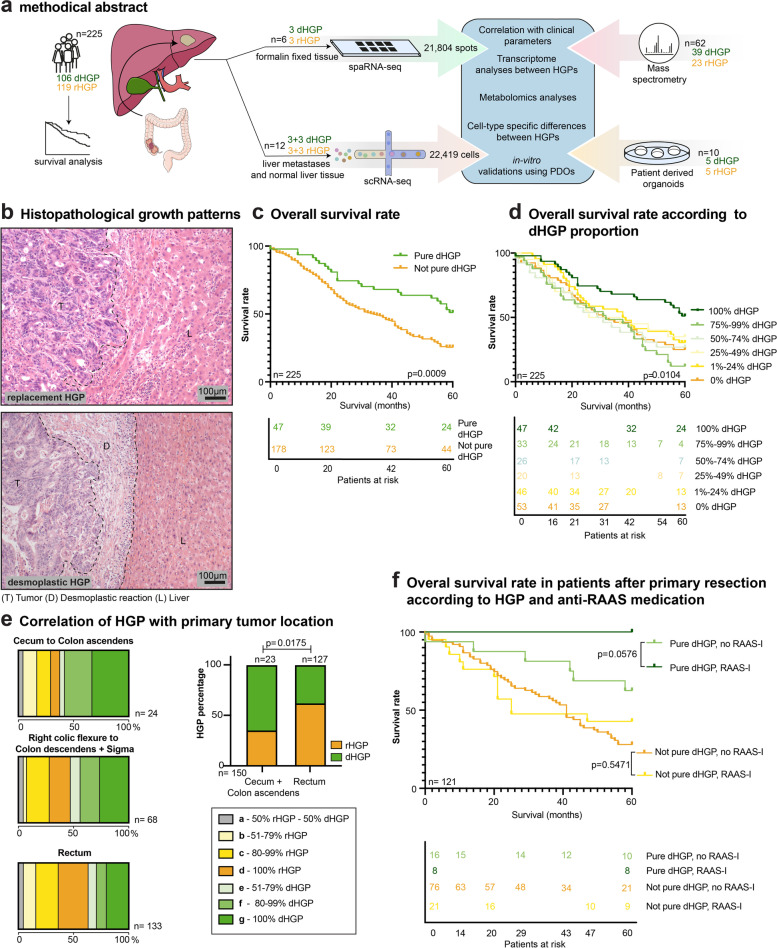
Background: Colorectal cancer liver metastases (CRCLM) are associated with a poor prognosis, reflected by a five-year survival rate of 14%. Anti-angiogenic therapy through anti-VEGF antibody administration is one of the limited therapies available. However, only a subgroup of metastases uses sprouting angiogenesis to secure their nutrients and oxygen supply, while others rely on vessel co-option (VCO). The distinct mode of vascularization is reflected by specific histopathological growth patterns (HGPs), which have proven prognostic and predictive significance. Nevertheless, their molecular mechanisms are poorly understood.

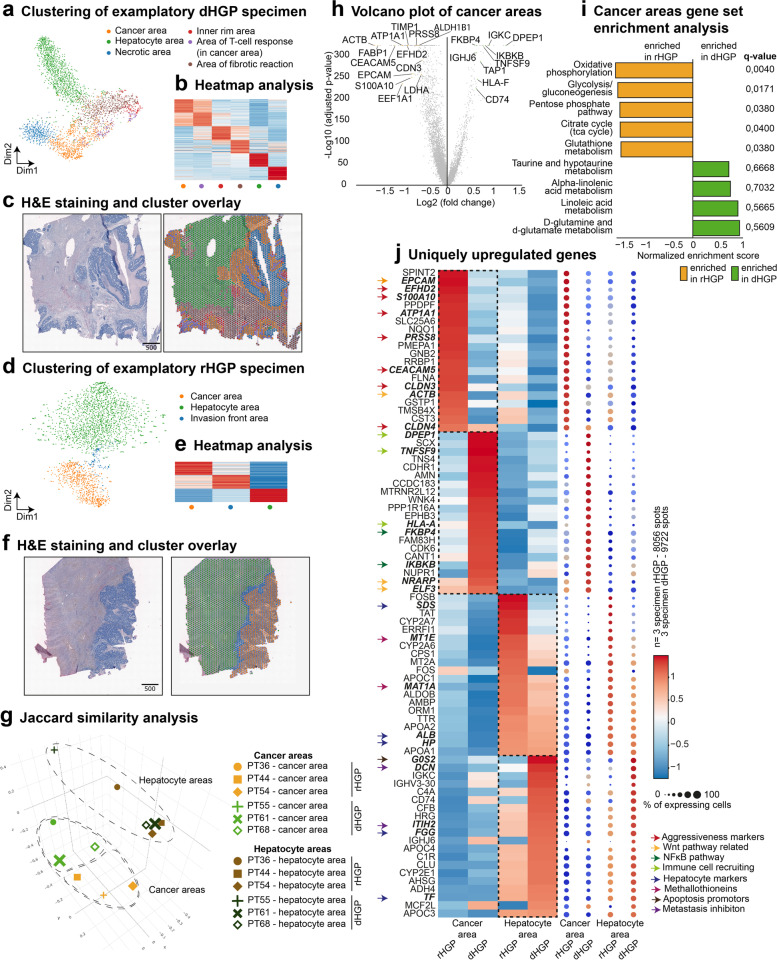
Methods: We evaluated CRCLM from 225 patients regarding their HGP and clinical data. Moreover, we performed spatial (21,804 spots) and single-cell (22,419 cells) RNA sequencing analyses to explore molecular differences in detail, further validated in vitro through immunohistochemical analysis and patient-derived organoid cultures.

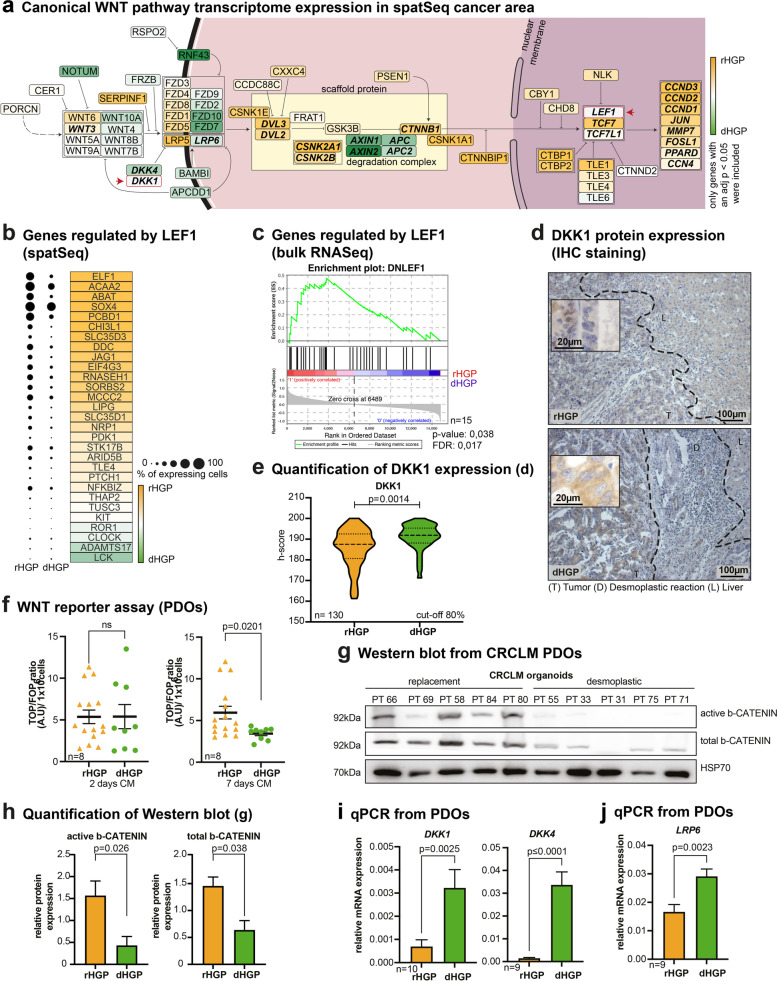
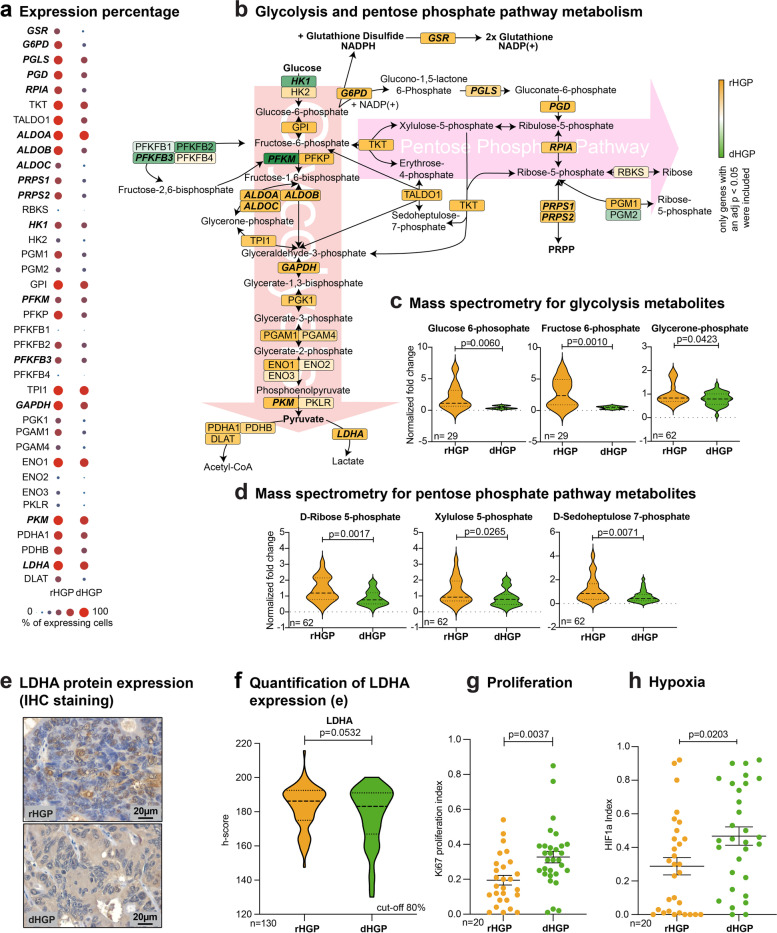
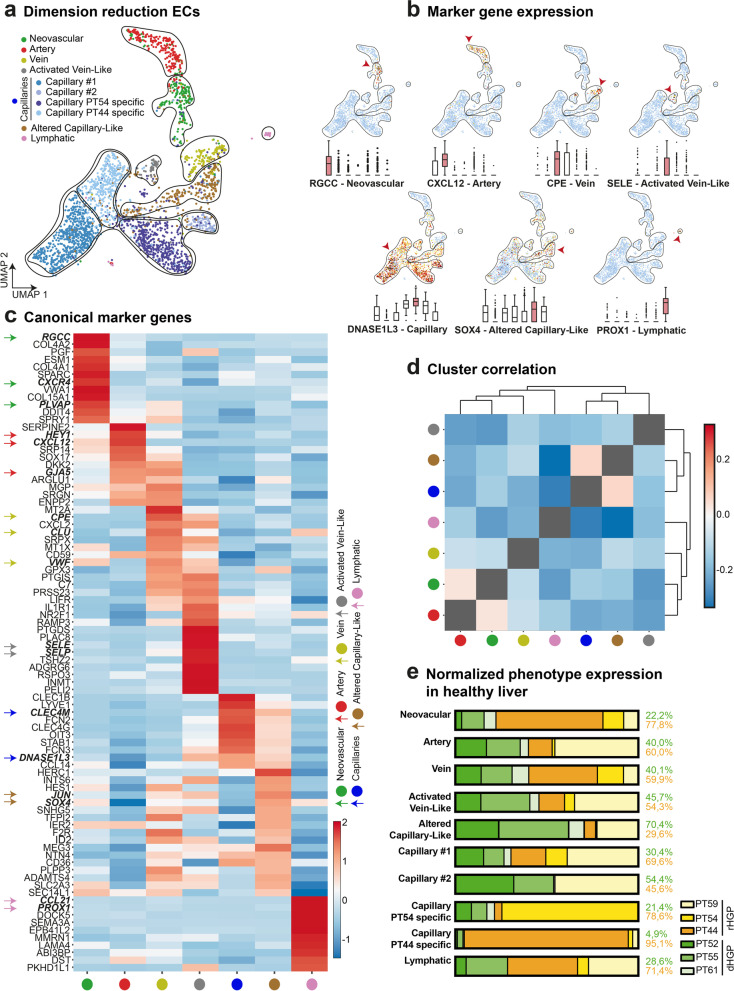
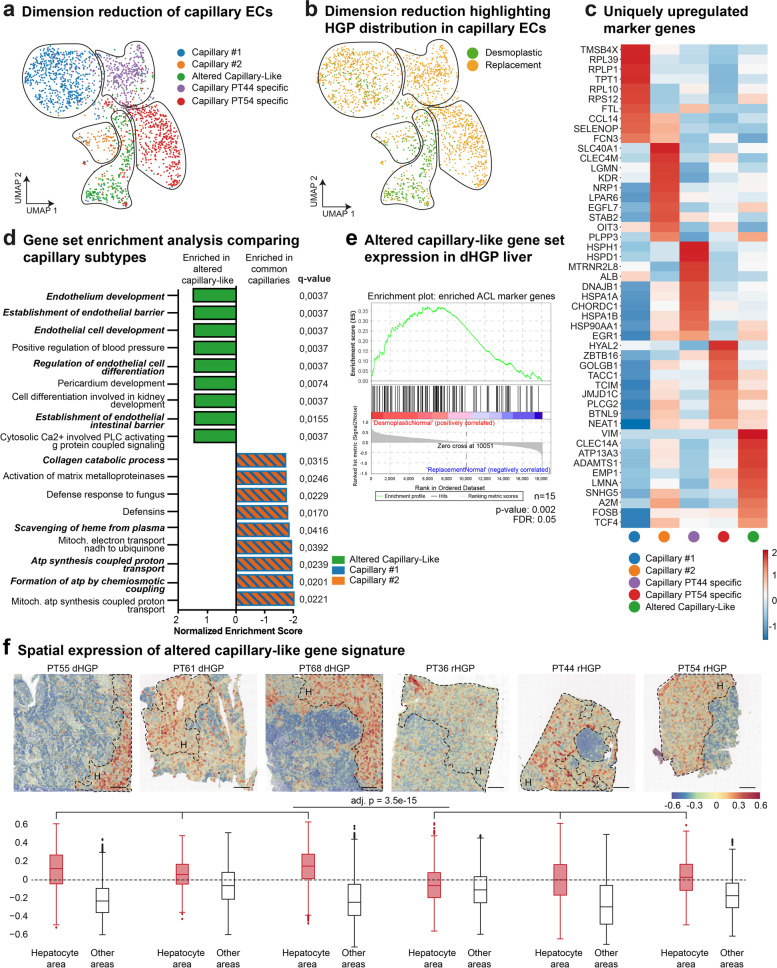
Results: We detected specific metabolic alterations and a signature of WNT signalling activation in metastatic cancer cells related to the VCO phenotype. Importantly, in the corresponding healthy liver of CRCLM displaying sprouting angiogenesis, we identified a predominantly expressed capillary subtype of endothelial cells, which could be further explored as a possible predictor for HGP relying on sprouting angiogenesis.

Conclusion: These findings may prove to be novel therapeutic targets to the treatment of CRCLM, in special the ones relying on VCO.

Keywords: Colorectal cancer liver metastases; Glycolysis; Histopathological growth patterns; Pentose phosphate pathway; Sprouting angiogenesis; Vessel co-option; WNT signalling.


Conflict of interest statement

The authors declare no competing interests.

Figures

Fig. 1
Fig. 1
Primary tumors localized in the rectum are more likely to develop rHGP CRCLM. (a) Graphical abstract of the experimental workflow. (b) Representative H&E images of rHGP and dHGP. T: tumor; L: liver; D: desmoplastic rim. (c) Kaplan–Meier curves: OS after CRCLM resection depending on the HGP (n = 225). (d) Kaplan–Meier curves: sub-stratified OS after CRCLM resection depending on the percentage of dHGP (n = 225). (e) Left box charts: HGP distribution of CRCLM in the context of the localization of the primary tumor. Right bar plot: predominant HGP (after exclusion of CRCLM with 50% of each HGP), in the context of the localization of the primary tumor (p value by chi-square test). (f) Kaplan–Meier curves: OS after CRCLM resection depending on the HGP and the application of therapeutic RAAS inhibition (RAAS-I) in the pre-treatment-naive subgroup (n = 121). P values were calculated by two-sided log-rank test
Fig. 2
Fig. 2
Spatial investigation of cancer areas reveals HGP-specific features. (a) representative t-SNE plot: spots of PT61 clustered via unsupervised Louvain clustering, biologically annotated. (b) Heatmap of 50 uniquely upregulated genes per cluster. (c) H&E staining of PT61 and overlayed Louvain-clustering. (d) representative t-SNE plot: 2,554 spots of PT54 clustered via unsupervised Louvain clustering, biologically annotated. (e) Heatmap of 50 uniquely upregulated genes per cluster. (f) H&E staining of PT54 and overlayed Louvain-clustering. (g) Jaccard similarity PCA on the pairwise Jaccard similarity coefficients between the marker genes of cells from cancer and hepatocytes area clusters in the samples from six different patients. (h) Volcano plot: DEA of cancer areas (dHGP vs rHGP), positive enrichment in dHGP. (i) Waterfall plot: GSEA comparing differentially expressed genes in cancer areas of dHGP vs cancer areas of rHGP (using KEGG metabolism, KEGG cellular processes as gene sets). (j) Heatmap and dot plot: top 20 uniquely upregulated marker genes of pooled spots for cancer areas and hepatic areas according to the HGP
Fig. 3
Fig. 3
Upregulation of canonical WNT signaling in rHGP CRCLM. (a) Canonical WNT signaling pathway mapping: significant differentially expressed genes mapped according to the KEGG WNT signalling pathway. Colour coded according to scaled log fold change values. (b) Dot plot: significant differentially expressed genes regulated by LEF1. Mapped with expression percentages and colour coded according to scaled log fold change values. (c) GSEA: bulk sequencing data from CRCLM showing a gene signature regulated by LEF1 upregulated in rHGP (n = 6 rHGP vs n = 9 dHGP). (d) IHC staining: DKK1 (brown) in CRCLM (n = 130, cut-off 80% angiogenic or vessel-coopting HGP). (e) Violin plot: quantification of d. (f) Scatter plot: TOP/FOP-Flash WNT reporter assay with conditioned media from PDOs (n = 5 rHGP vs n = 3 dHGP). (g) Western blot: active and total ß-Catenin in protein lysates of PDOs (n = 5 rHGP vs n = 5 dHGP). (h) Western blot quantification of g. (i) qRT- PCR analysis for DKK1 (n = 6 rHGP vs n = 4 dHGP) and DKK4 (n = 4 rHGP vs n = 5 dHGP) in PDO-derived RNA. (j) Bar plot: RT-PCR analysis for LRP6 (n = 4 rHGP vs. n = 5 dHGP) in PDO-derived RNA. P values were calculated by unpaired t-test
Fig. 4
Fig. 4
Metabolic profile of CRCLM. (a) Dot plot: significant differentially expressed genes involved in glycolysis and PPP mapped with expression percentages. (b) Pathway mapping: significant differentially expressed genes mapped according to the KEGG signaling pathway. Colour coded according to scaled log fold change values. (c) Violin plots: selected metabolites of glycolysis measured by mass spectrometry (n = 29 or n = 62). (d) Violin plots: selected metabolites of the pentose phosphate pathway measured by mass spectrometry (n = 62). (e) IHC staining: LDHA (brown) in CRCLM (n = 130, cut-off 80% angiogenic or vessel-coopting HGP). (f) Violin plot: quantification of e. (g) Scatter plot: quantification of IHC Ki67 staining (n = 10 rHGP vs n = 10 dHGP in triplicates). (h) Scatter plot: quantification of IHC HIF1a staining (n = 10 rHGP vs n = 10 dHGP in triplicates). P values were calculated by unpaired t-test
Fig. 5
Fig. 5
Specific capillary subtypes in corresponding healthy liver from patients with CRCLM. (a) UMAP plot: 2,654 analysed endothelial cells from healthy liver. Clusters identified via unsupervised Louvain clustering and biologically annotated. (b) Box plots and UMAP plots: quantification for each marker gene of the biologically annotated clusters. (c) Heatmap showing expression of canonical marker genes per cluster. (d) Correlation heatmap of annotated clusters. Hierarchical clustering location for row and column; confidence of branches estimated via bootstrapping (p = 0.05). (e) Bar plots: normalized cell amount and distribution of the origin of the analysed healthy liver endothelial cells
Fig. 6
Fig. 6
Capillary heterogeneity between HGPs in corresponding healthy liver from patients with CRCLM. (a) UMAP plot: 2,008 endothelial cells previously identified as capillary cells. Clustered via unsupervised Louvain clustering and biologically annotated. (b) UMAP plot: 2,008 analysed capillary cells. Colour coded for the HGP of sample of origin. (c) Heatmap showing 10 uniquely upregulated marker genes per cluster. (d) Waterfall plot: GSEA comparing capillary clusters 1 and 2 pooled vs ACL (using PID, KEGG, REACTOME, BP as gene sets). (e) GSEA: bulk sequencing data from corresponding healthy liver of CRCLM showing an upregulated signature of 150 marker genes of the ACL cluster in dHGP (n = 9 dHGP vs n = 6 rHGP). (f) Spatial overlay: spatial expression of a gene set of the 30 most enriched genes in ACL showing a relative enrichment in dHGP. Scale bars 500 µm

Similar articles

Cited by

References

    1. Sung H, Ferlay J, Siegel RL, Laversanne M, Soerjomataram I, Jemal A, Bray F. Global Cancer Statistics 2020: GLOBOCAN Estimates of Incidence and Mortality Worldwide for 36 Cancers in 185 Countries. CA Cancer J Clin. 2021;71:209–249. doi: 10.3322/caac.21660. - DOI - PubMed
    1. Siegel RL, Miller KD, Fuchs HE, Jemal A. Cancer Statistics, 2021. CA Cancer J Clin. 2021;71:7–33. doi: 10.3322/caac.21654. - DOI - PubMed
    1. Robinson JR, Newcomb PA, Hardikar S, Cohen SA, Phipps AI. Stage IV colorectal cancer primary site and patterns of distant metastasis. Cancer Epidemiol. 2017;48:92–95. doi: 10.1016/j.canep.2017.04.003. - DOI - PMC - PubMed
    1. Galjart B, Nierop PMH, van der Stok EP, van den Braak RRJC, Hoppener DJ, Daelemans S, Dirix LY, Verhoef C, Vermeulen PB, Grunhagen DJ. Angiogenic desmoplastic histopathological growth pattern as a prognostic marker of good outcome in patients with colorectal liver metastases. Angiogenesis. 2019;22:355–368. doi: 10.1007/s10456-019-09661-5. - DOI - PMC - PubMed
    1. Hoppener DJ, Galjart B, Nierop PMH, Buisman FE, van der Stok EP, Coebergh van den Braak RRJ, van Amerongen MJ, Balachandran VP, Jarnagin WR, Kingham TP, et al: Histopathological Growth Patterns and Survival After Resection of Colorectal Liver Metastasis: An External Validation Study. JNCI Cancer Spectr. 2021;5. - PMC - PubMed

Publication types

MeSH terms