. 2023 Jan 23;20(1):13.
doi: 10.1186/s12974-022-02680-y.

Early peripheral blood gene expression associated with good and poor 90-day ischemic stroke outcomes

Affiliations

Early peripheral blood gene expression associated with good and poor 90-day ischemic stroke outcomes

Hajar Amini et al. J Neuroinflammation. .

Abstract

Background: This study identified early immune gene responses in peripheral blood associated with 90-day ischemic stroke (IS) outcomes.

Methods: Peripheral blood samples from the CLEAR trial IS patients at ≤ 3 h, 5 h, and 24 h after stroke were compared to vascular risk factor matched controls. Whole-transcriptome analyses identified genes and networks associated with 90-day IS outcome assessed using the modified Rankin Scale (mRS) and the NIH Stroke Scale (NIHSS).

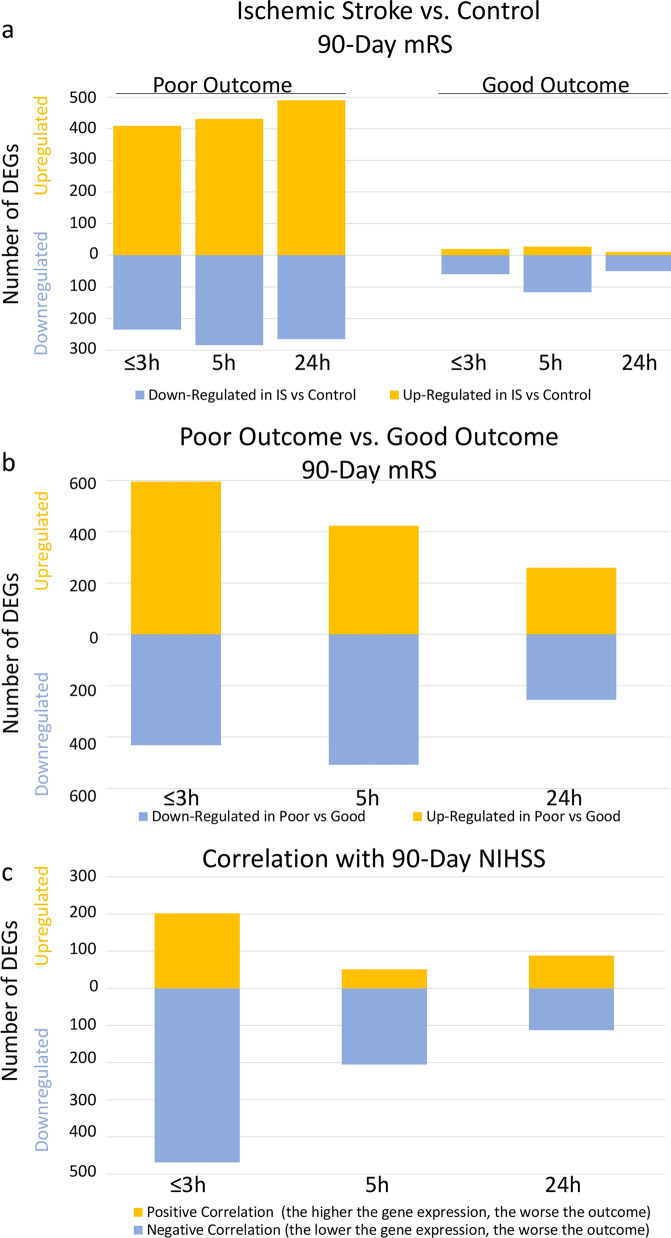
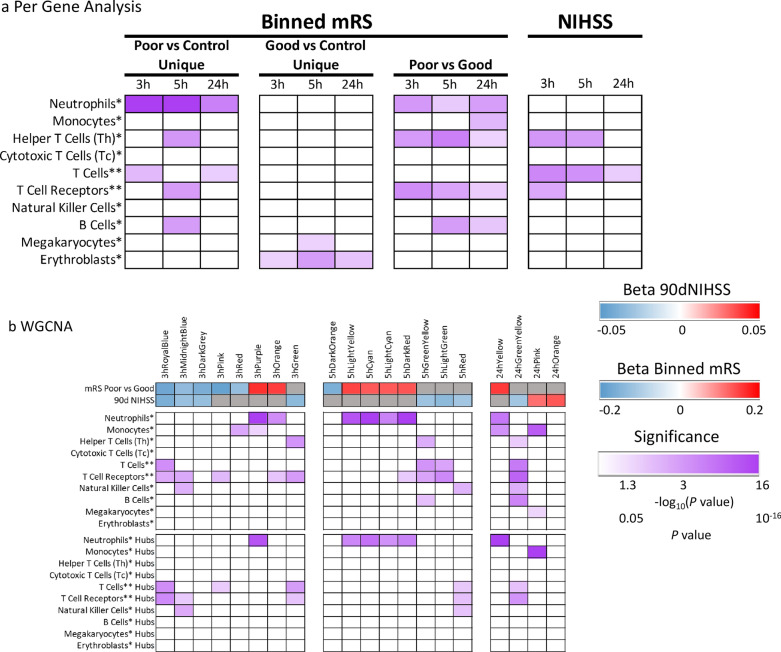
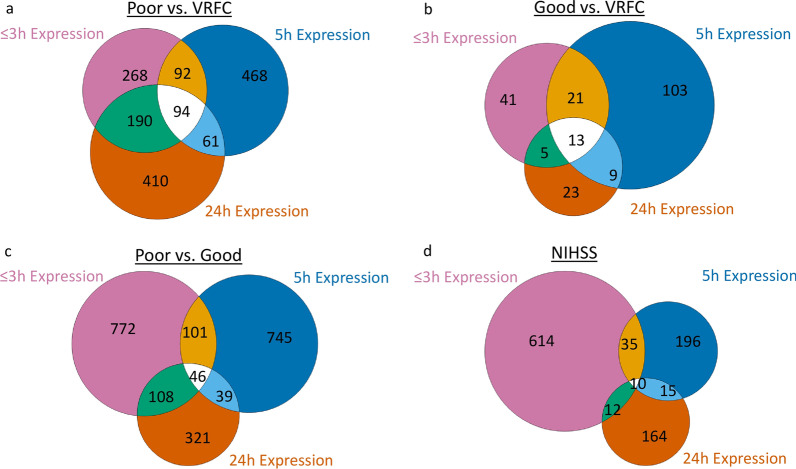
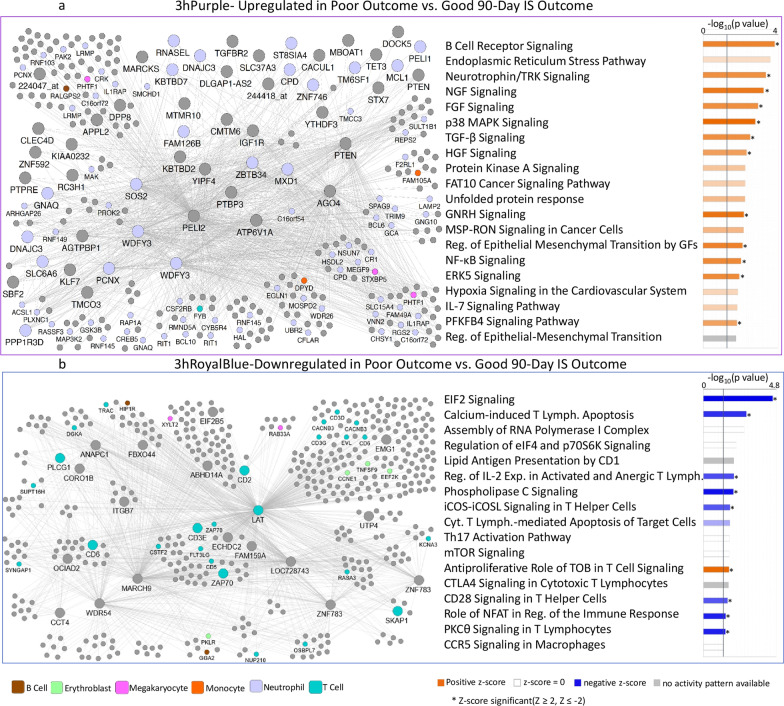
Results: The expression of 467, 526, and 571 genes measured at ≤ 3, 5 and 24 h after IS, respectively, were associated with poor 90-day mRS outcome (mRS ≥ 3), while 49, 100 and 35 genes at ≤ 3, 5 and 24 h after IS were associated with good mRS 90-day outcome (mRS ≤ 2). Poor outcomes were associated with up-regulated genes or pathways such as IL-6, IL-7, IL-1, STAT3, S100A12, acute phase response, P38/MAPK, FGF, TGFA, MMP9, NF-kB, Toll-like receptor, iNOS, and PI3K/AKT. There were 94 probe sets shared for poor outcomes vs. controls at all three time-points that correlated with 90-day mRS; 13 probe sets were shared for good outcomes vs. controls at all three time-points; and 46 probe sets were shared for poor vs. good outcomes at all three time-points that correlated with 90-day mRS. Weighted Gene Co-Expression Network Analysis (WGCNA) revealed modules significantly associated with 90-day outcome for mRS and NIHSS. Poor outcome modules were enriched with up-regulated neutrophil genes and with down-regulated T cell, B cell and monocyte-specific genes; and good outcome modules were associated with erythroblasts and megakaryocytes. Finally, genes identified by genome-wide association studies (GWAS) to contain significant stroke risk loci or loci associated with stroke outcome including ATP2B, GRK5, SH3PXD2A, CENPQ, HOXC4, HDAC9, BNC2, PTPN11, PIK3CG, CDK6, and PDE4DIP were significantly differentially expressed as a function of stroke outcome in the current study.

Conclusions: This study suggests the immune response after stroke may impact functional outcomes and that some of the early post-stroke gene expression markers associated with outcome could be useful for predicting outcomes and could be targets for improving outcomes.

Keywords: Gene expression; Ischemic stroke; Outcomes; Transcriptome; WGCNA.


Conflict of interest statement

The authors report no competing financial interests and declare no competing interests.

Figures

Fig. 1
Fig. 1
Numbers of up- and down-regulated differentially expressed genes (DEGs) at the three time-points ≤ 3 h, 5 h and 24 h after ischemic stroke. a Ischemic Stroke (IS) was compared to Vascular Risk Factor Controls (Control) for the Poor Outcome participants (mRS of 3–5 at 90 days) and for the Good Outcome participants (mRS of 0–2 at 90 days). b IS Poor Outcome participants were compared to the IS Good Outcome participants. c Numbers of DEGs that correlated with the 90-day NIHSS. The genes from the list for a passed FDR-corrected P value < 0.05 and a fold change (FC) >|2|. The list for the DEGs in b had a P value < 0.05 and a fold change (FC) >|1.3|. The list of the DEGs in c had P value < 0.005. Yellow represents numbers of up-regulated DEGs. Blue represents numbers of down-regulated DEGs. IS Ischemic Stroke, mRS modified Rankin Score, NIHSS National Institutes of Health Stroke Scale
Fig. 2
Fig. 2
Top 20 most significant pathways enriched with differentially expressed genes (DEGs) in Poor IS Outcome (mRS 3–5) compared to Vascular Risk Factor Controls (Poor vs. VRFC) and in Good IS Outcome (mRS 0–2) compared to Vascular Risk Factor Controls (Good vs. VRFC). The top 20 most significant activation or suppression relevant pathways for these two comparisons are shown for the three time-points after stroke: a ≤ 3 h, b 5 h and c 24 h. Blue bars indicate pathway suppression (negative Z-score), and orange indicates activation (positive Z-score), with darker colors representing larger |Z-score|. ↑ (up arrow) represents Z ≥ 2 significant activation in the poor or good 90-day mRS IS outcome compared to VRFC. ↓ (down arrow) represents Z ≤ -2, significant suppression in the poor or good 90-day mRS IS outcome compared to VRFC. The asterisk * represents significantly enriched pathway (P < 0.05). White cells represent activity pattern prediction of Z = 0 (suppression or activation status cannot be predicated). Grey represents no activity pattern available for the pathway in the IPA knowledge base. Reg. regulation; GFs. growth factors; Expr. expression; Lymph. lymphocytes
Fig. 3
Fig. 3
Enrichment in cell type-specific gene lists for the per-gene lists (a) and WGCNA modules (b). Purple shading represents − log10(P value) where 1.3 corresponds to a P value of 0.05. A higher − log10(P value) corresponds to lower (more significant—darker shades) P value. Non-significant hypergeometric probabilities are displayed as white cells. In a, the results are based on genes differentially expressed in poor 90d mRS IS outcome vs VRFC, good 90d mRS IS outcome vs VRFC, poor 90d mRS IS outcome vs good 90d mRS IS outcome, and genes correlating with 90d NIHSS. In b modules significant for 90-day outcome (mRS poor vs good, and NIHSS) are presented for the ≤ 3 h Network, 5 h Network, and 24 h Network. Blue indicates down-regulated and red up-regulated gene expression with worse outcomes via the beta coefficient for outcome in a linear regression on the module eigengene. Grey indicates modules not significantly associated with the outcome measure. Enrichment of hub gene lists in cell type-specific lists are presented at the bottom. The single asterisk * indicates cell type list from Watkins et al. [21] and the double asterisk ** indicates the cell type list was from Chtanova et al. [20]. Some of the identified Neutrophil genes might be expressed by other granulocytes, i.e., basophils and eosinophils
Fig. 4
Fig. 4
Venn diagram of the number of differentially expressed (DE) probe sets at each of the three time-points (≤ 3 h, 5 h and 24 h) post-stroke. a Numbers of DE probe sets between ischemic stroke (IS) participants with poor 90-day mRS outcomes compared vascular risk factor controls (VRFC). b Numbers of DE probe sets between IS participants with good 90-day mRS outcome compared to VRFC. c Numbers of DE probe sets between participants with poor 90-day mRS outcome compared to participants with good 90-day mRS outcome. d Numbers of DE probe sets that correlated with the 90-day National Institutes of Health Stroke Scale (NIHSS)
Fig. 5
Fig. 5
Network diagram (a left panel) and Pathway Enrichment (a right panel) for the outcome-significant (mRS poor vs. good) for the 3hPurple module. In the a left panel, the network diagram shows the connectivity of hubs and genes within the module. Nodes represent genes within the module and edges represent connections based on co-expression between genes. Larger nodes with large labels are hub genes, representing potential master regulators. Genes are grey by default and colored if they are cell type specific. In the a right panel, the top 20 most significant relevant pathways are displayed. The significance threshold (P = 0.05) corresponds to the vertical black line. Blue shading indicates suppression and orange activation with darker colors representing larger |Z-score|. Grey represents no activity pattern available for the pathway in the IPA knowledge base. An asterisk * represents statistically significant activation or suppression (Z ≥ 2 or Z ≤ − 2) in poor outcome compared to good outcome. In b the Network diagram (b left panel) and Pathway Enrichment (b right panel) for the outcome-significant (mRS poor vs. good) for the 3hRoyalBlue module. The LAT gene is colored as T cell-specific though it is expressed in megakaryocytes and T cells. White bars represent activity pattern prediction of Z = 0 (suppression or activation status cannot be predicated). Other details of this figure are identical to those in a. Reg. regulation, GFs. growth factors, Expr. expression, Lymph. lymphocytes

References

    1. Jickling GC, Sharp FR. Blood biomarkers of ischemic stroke. Neurotherapeutics. 2011;8(3):349. doi: 10.1007/s13311-011-0050-4. - DOI - PMC - PubMed
    1. Lee JM, Fernandez-Cadenas I, Lindgren AG. Using human genetics to understand mechanisms in ischemic stroke outcome: from early brain injury to long-term recovery. Stroke. 2021;52(9):3013–3024. doi: 10.1161/STROKEAHA.121.032622. - DOI - PMC - PubMed
    1. Carmona-Mora P, Ander BP, Jickling GC, et al. Distinct peripheral blood monocyte and neutrophil transcriptional programs following intracerebral hemorrhage and different etiologies of ischemic stroke. J Cereb Blood Flow Metab. 2021;41(6):1398–1416. doi: 10.1177/0271678X20953912. - DOI - PMC - PubMed
    1. Stamova B, Xu H, Jickling G, et al. Gene expression profiling of blood for the prediction of ischemic stroke. Stroke. 2010;41(10):2171–2177. doi: 10.1161/STROKEAHA.110.588335. - DOI - PMC - PubMed
    1. Meller R, Pearson AN, Hardy JJ, et al. Blood transcriptome changes after stroke in an African American population. Ann Clin Transl Neurol. 2016;3(2):70–81. doi: 10.1002/acn3.272. - DOI - PMC - PubMed

Substances