

Sitravatinib as a potent FLT3 inhibitor can overcome gilteritinib resistance in acute myeloid leukemia
- PMID: 36691065
- PMCID: PMC9872318
- DOI: 10.1186/s40364-022-00447-4
Sitravatinib as a potent FLT3 inhibitor can overcome gilteritinib resistance in acute myeloid leukemia
Abstract
Background: Gilteritinib is the only drug approved as monotherapy for acute myeloid leukemia (AML) patients harboring FMS-like tyrosine kinase 3 internal tandem duplication (FLT3-ITD) mutation throughout the world. However, drug resistance inevitably develops in clinical. Sitravatinib is a multi-kinase inhibitor under evaluation in clinical trials of various solid tumors. In this study, we explored the antitumor activity of sitravatinib against FLT3-ITD and clinically-relevant drug resistance in FLT3 mutant AML.
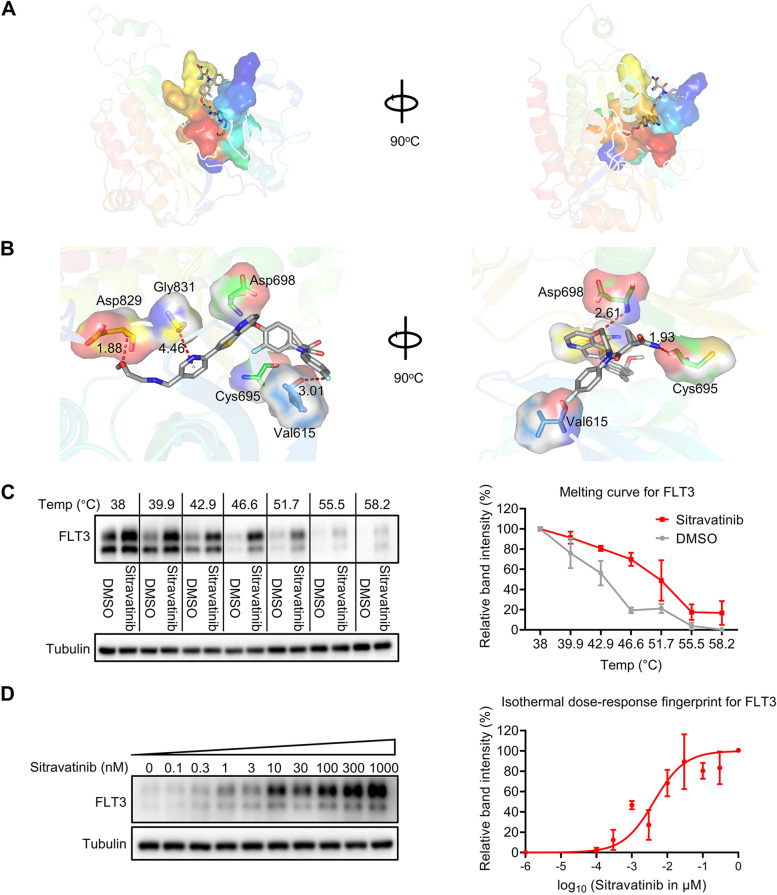
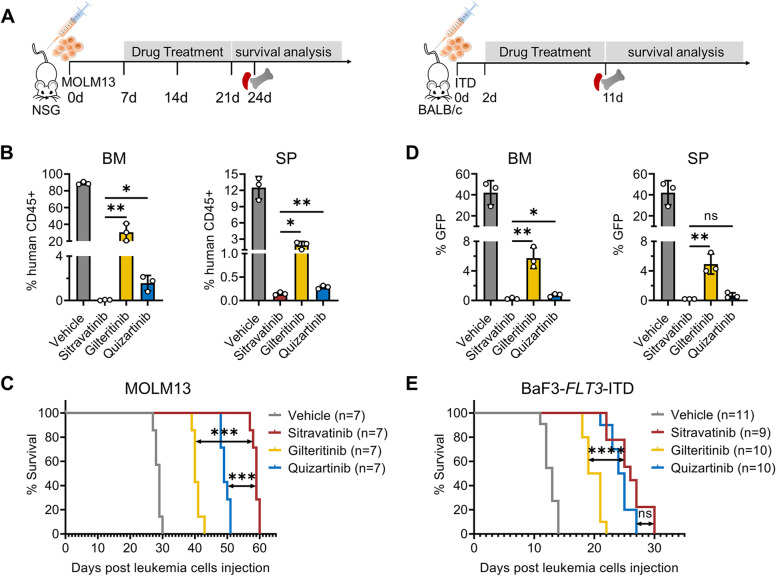
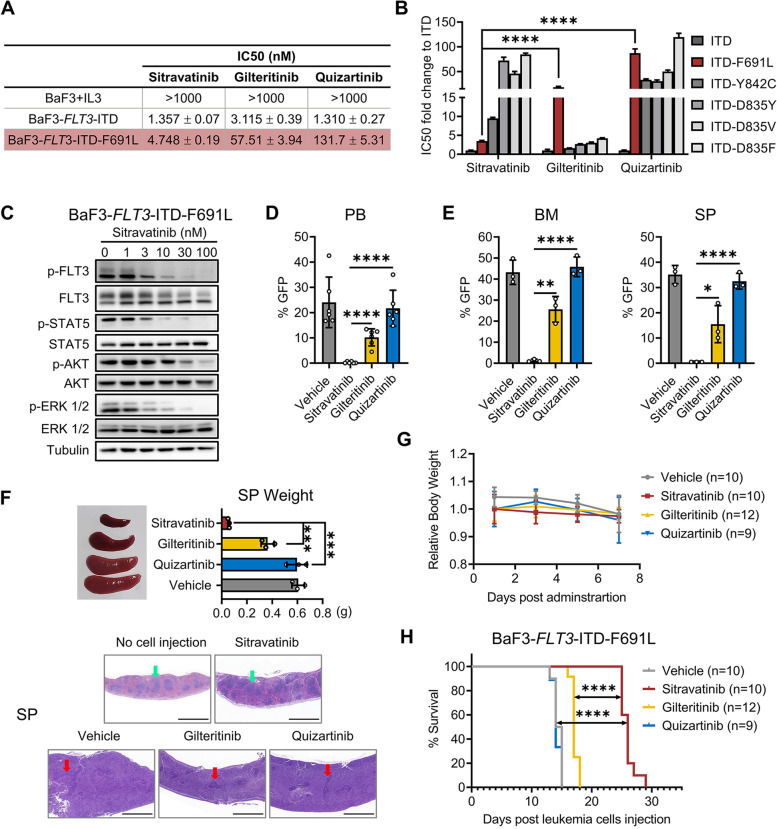
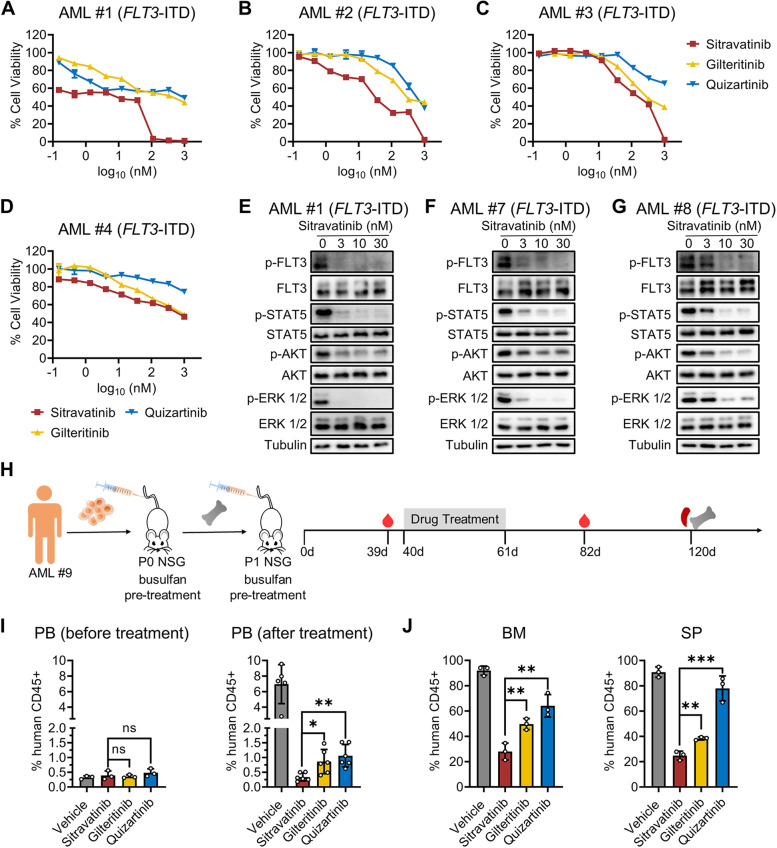
Methods: Growth inhibitory assays were performed in AML cell lines and BaF3 cells expressing various FLT3 mutants to evaluate the antitumor activity of sitravatinib in vitro. Immunoblotting was used to examine the activity of FLT3 and its downstream pathways. Molecular docking was performed to predict the binding sites of FLT3 to sitravatinib. The survival benefit of sitravatinib in vivo was assessed in MOLM13 xenograft mouse models and mouse models of transformed BaF3 cells harboring different FLT3 mutants. Primary patient samples and a patient-derived xenograft (PDX) model were also used to determine the efficacy of sitravatinib.
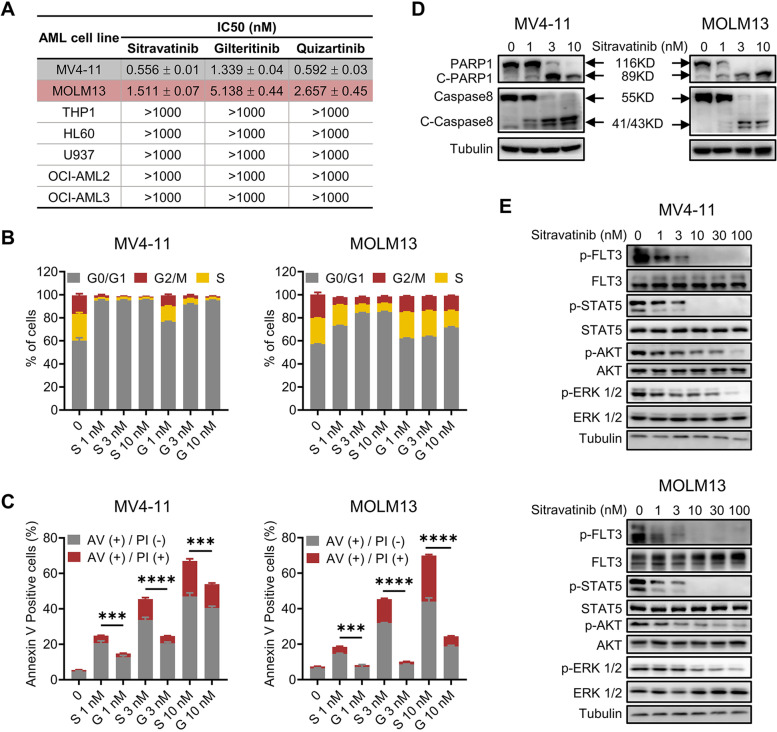
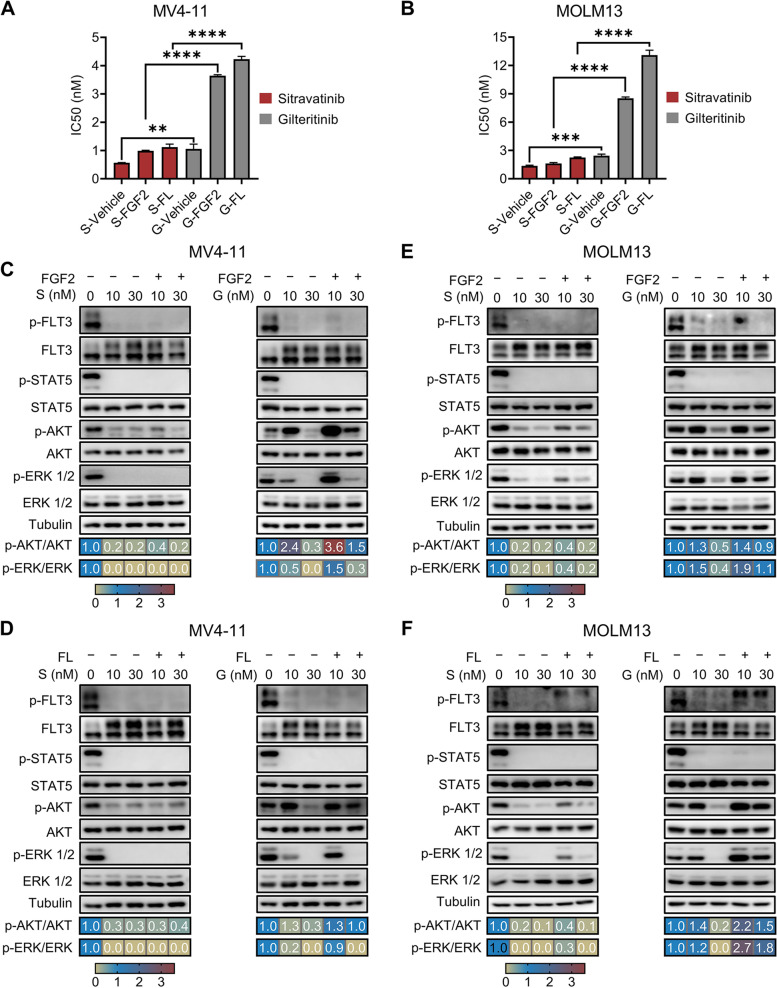
Results: Sitravatinib inhibited cell proliferation, induced cell cycle arrest and apoptosis in FLT3-ITD AML cell lines. In vivo studies showed that sitravatinib exhibited a better therapeutic effect than gilteritinib in MOLM13 xenograft model and BaF3-FLT3-ITD model. Unlike gilteritinib, the predicted binding sites of sitravatinib to FLT3 did not include F691 residue. Sitravatinib displayed a potent inhibitory effect on FLT3-ITD-F691L mutation which conferred resistance to gilteritinib and all other FLT3 inhibitors available, both in vitro and in vivo. Compared with gilteritinib, sitravatinib retained effective activity against FLT3 mutation in the presence of cytokines through the more potent and steady inhibition of p-ERK and p-AKT. Furthermore, patient blasts harboring FLT3-ITD were more sensitive to sitravatinib than to gilteritinib in vitro and in the PDX model.
Conclusions: Our study reveals the potential therapeutic role of sitravatinib in FLT3 mutant AML and provides an alternative inhibitor for the treatment of AML patients who are resistant to current FLT3 inhibitors.
Keywords: AML; Drug resistance; FGF2; FL; FLT3-ITD; FLT3-ITD-F691L; Gilteritinib; Sitravatinib.
© 2023. The Author(s).
Conflict of interest statement
The authors declare no competing interests.
Figures
Similar articles
-
GNF-7, a novel FLT3 inhibitor, overcomes drug resistance for the treatment of FLT3‑ITD acute myeloid leukemia.Cancer Cell Int. 2023 Nov 30;23(1):302. doi: 10.1186/s12935-023-03142-y. Cancer Cell Int. 2023. PMID: 38037057 Free PMC article.
-
Ningetinib, a novel FLT3 inhibitor, overcomes secondary drug resistance in acute myeloid leukemia.Cell Commun Signal. 2024 Jul 8;22(1):355. doi: 10.1186/s12964-024-01729-0. Cell Commun Signal. 2024. PMID: 38978049 Free PMC article.
-
An imidazo[1,2-a]pyridine-pyridine derivative potently inhibits FLT3-ITD and FLT3-ITD secondary mutants, including gilteritinib-resistant FLT3-ITD/F691L.Eur J Med Chem. 2024 Jan 15;264:115977. doi: 10.1016/j.ejmech.2023.115977. Epub 2023 Nov 25. Eur J Med Chem. 2024. PMID: 38056299 Free PMC article.
-
The European Medicines Agency Review of Gilteritinib (Xospata) for the Treatment of Adult Patients with Relapsed or Refractory Acute Myeloid Leukemia with an FLT3 Mutation.Oncologist. 2020 Jul;25(7):e1070-e1076. doi: 10.1634/theoncologist.2019-0976. Epub 2020 Mar 10. Oncologist. 2020. PMID: 32154636 Free PMC article. Review.
-
Gilteritinib: a novel FLT3 inhibitor for acute myeloid leukemia.Biomark Res. 2019 Sep 11;7:19. doi: 10.1186/s40364-019-0170-2. eCollection 2019. Biomark Res. 2019. PMID: 31528345 Free PMC article. Review.
Cited by
-
Targeting multiple receptor tyrosine kinases with sitravatinib: A Phase 1b study in advanced renal cell carcinoma and castrate-resistant prostate cancer.Invest New Drugs. 2024 Oct;42(5):547-558. doi: 10.1007/s10637-024-01465-9. Epub 2024 Aug 21. Invest New Drugs. 2024. PMID: 39168901 Free PMC article. Clinical Trial.
-
Advances in the application of patient-derived xenograft models in acute leukemia resistance.Cancer Drug Resist. 2025 May 28;8:23. doi: 10.20517/cdr.2025.18. eCollection 2025. Cancer Drug Resist. 2025. PMID: 40510031 Free PMC article. Review.
-
Sitravatinib combined with venetoclax exerts effective synergy to eliminate acute myeloid leukemia cells with FLT3-ITD mutations.Transl Oncol. 2025 Sep;59:102467. doi: 10.1016/j.tranon.2025.102467. Epub 2025 Jul 8. Transl Oncol. 2025. PMID: 40633257 Free PMC article.
-
Potentiating Gilteritinib Efficacy Using Nanocomplexation with a Hyaluronic Acid-Epigallocatechin Gallate Conjugate.Polymers (Basel). 2024 Jan 12;16(2):225. doi: 10.3390/polym16020225. Polymers (Basel). 2024. PMID: 38257023 Free PMC article.
-
Mechanisms of Resistance to Small Molecules in Acute Myeloid Leukemia.Cancers (Basel). 2023 Sep 15;15(18):4573. doi: 10.3390/cancers15184573. Cancers (Basel). 2023. PMID: 37760544 Free PMC article. Review.
References
-
- Janke H, Pastore F, Schumacher D, Herold T, Hopfner KP, Schneider S, et al. Activating FLT3 mutants show distinct gain-of-function phenotypes in vitro and a characteristic signaling pathway profile associated with prognosis in acute myeloid leukemia. PLoS ONE. 2014;9(3):e89560. doi: 10.1371/journal.pone.0089560. - DOI - PMC - PubMed
-
- Thiede C, Steudel C, Mohr B, Schaich M, Schäkel U, Platzbecker U, et al. Analysis of FLT3-activating mutations in 979 patients with acute myelogenous leukemia: association with FAB subtypes and identification of subgroups with poor prognosis. Blood. 2002;99(12):4326–4335. doi: 10.1182/blood.V99.12.4326. - DOI - PubMed
Grants and funding
LinkOut - more resources
Full Text Sources
Miscellaneous
