. 2023 Jan 23;24(1):16.
doi: 10.1186/s13059-023-02849-5.

An atlas of lamina-associated chromatin across twelve human cell types reveals an intermediate chromatin subtype

Affiliations

An atlas of lamina-associated chromatin across twelve human cell types reveals an intermediate chromatin subtype

Parisha P Shah et al. Genome Biol. .

Abstract

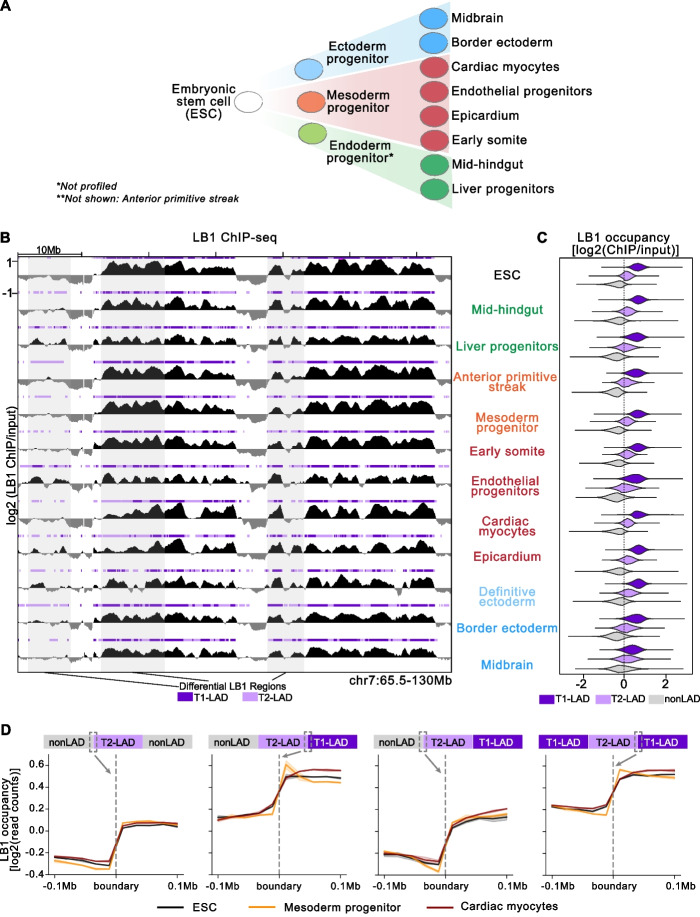
Background: Association of chromatin with lamin proteins at the nuclear periphery has emerged as a potential mechanism to coordinate cell type-specific gene expression and maintain cellular identity via gene silencing. Unlike many histone modifications and chromatin-associated proteins, lamina-associated domains (LADs) are mapped genome-wide in relatively few genetically normal human cell types, which limits our understanding of the role peripheral chromatin plays in development and disease.

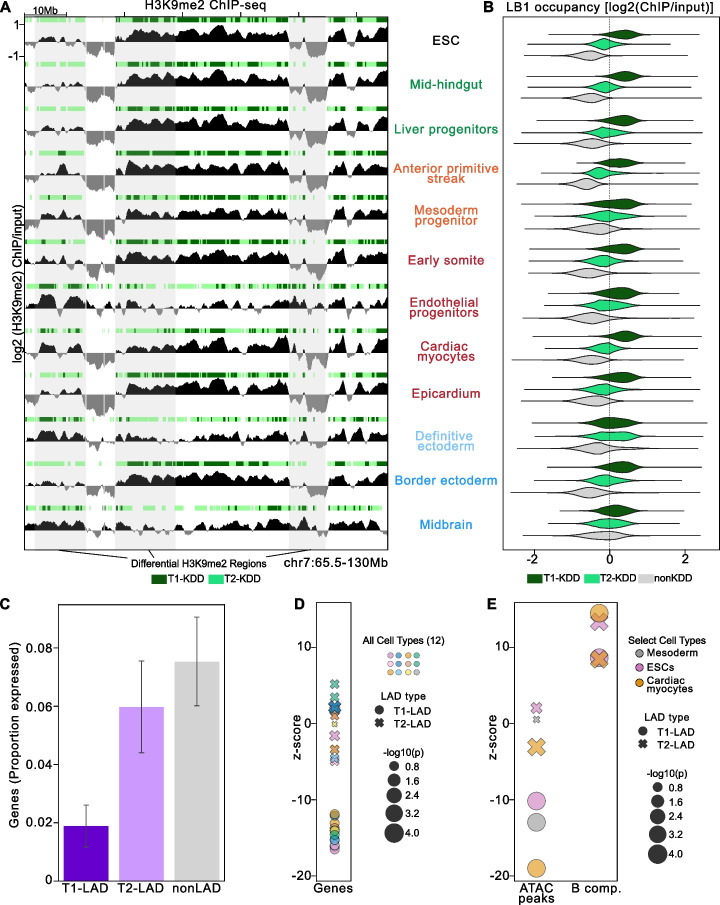
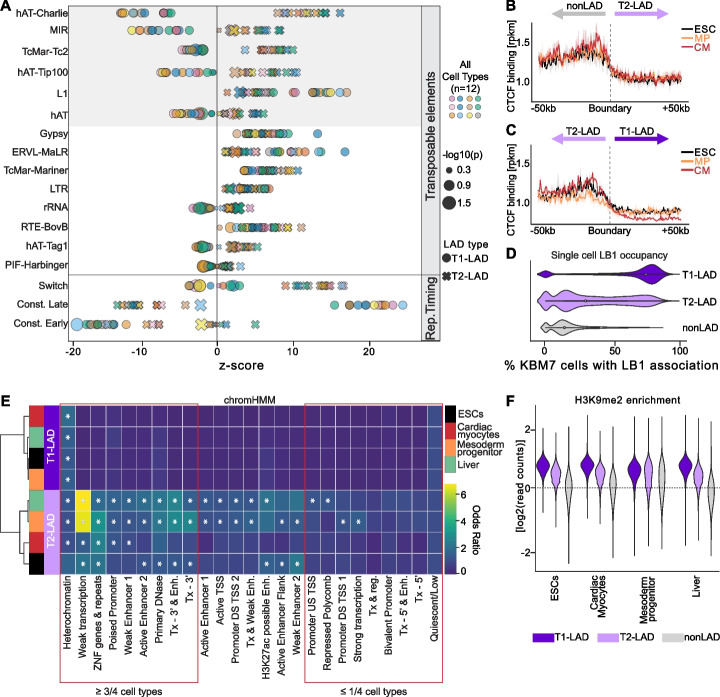
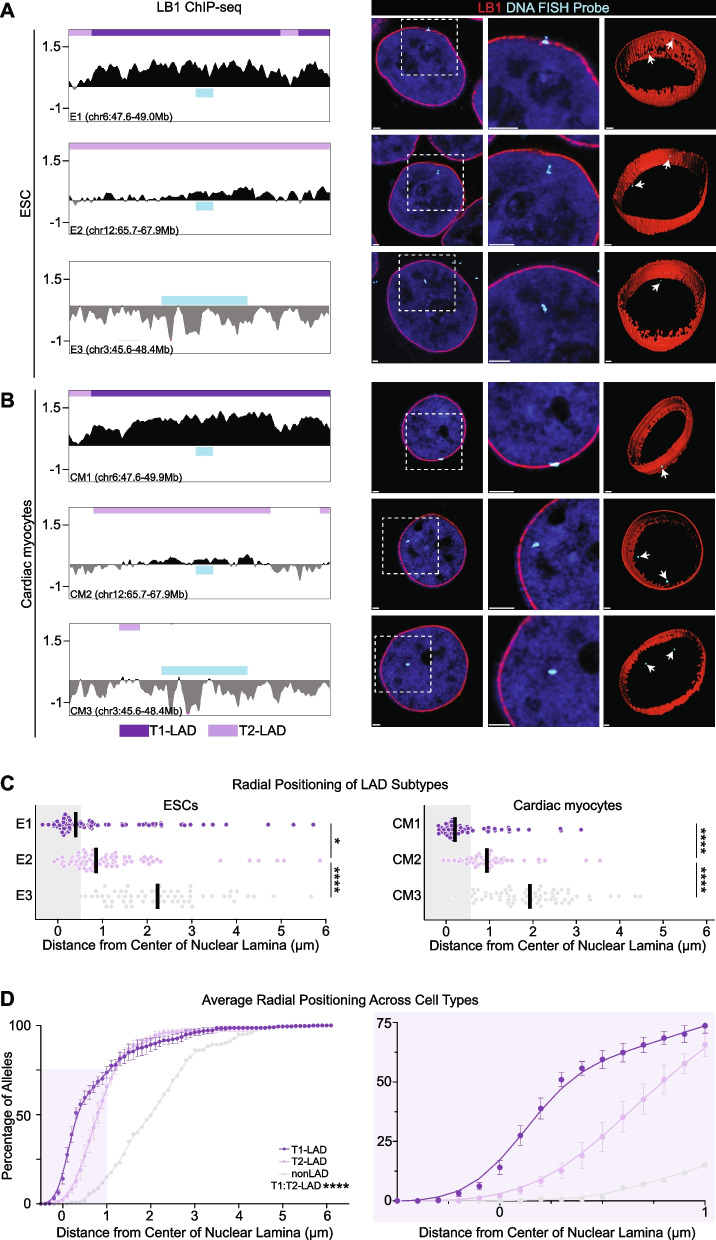
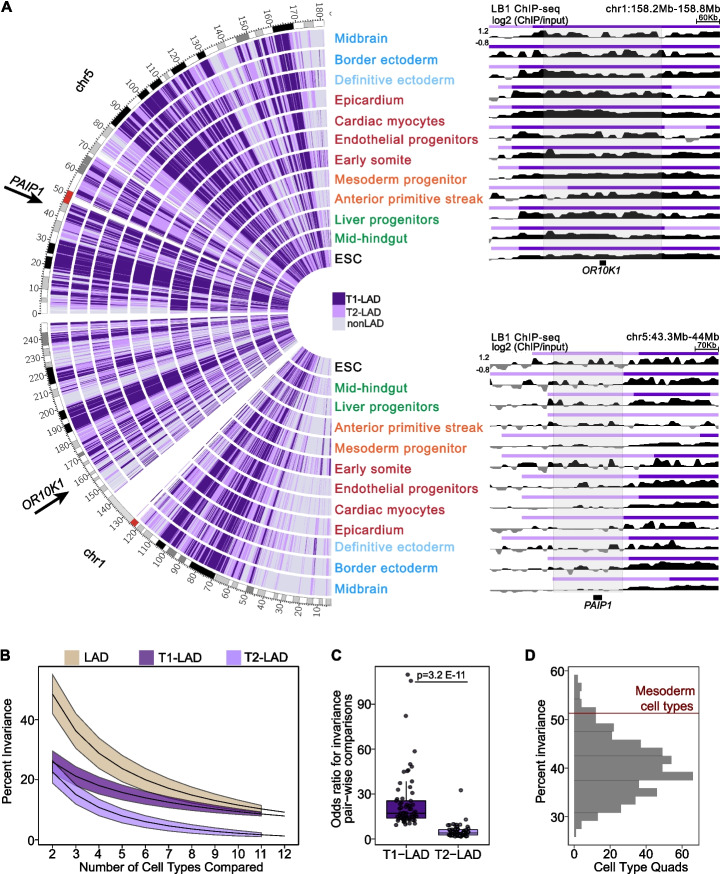
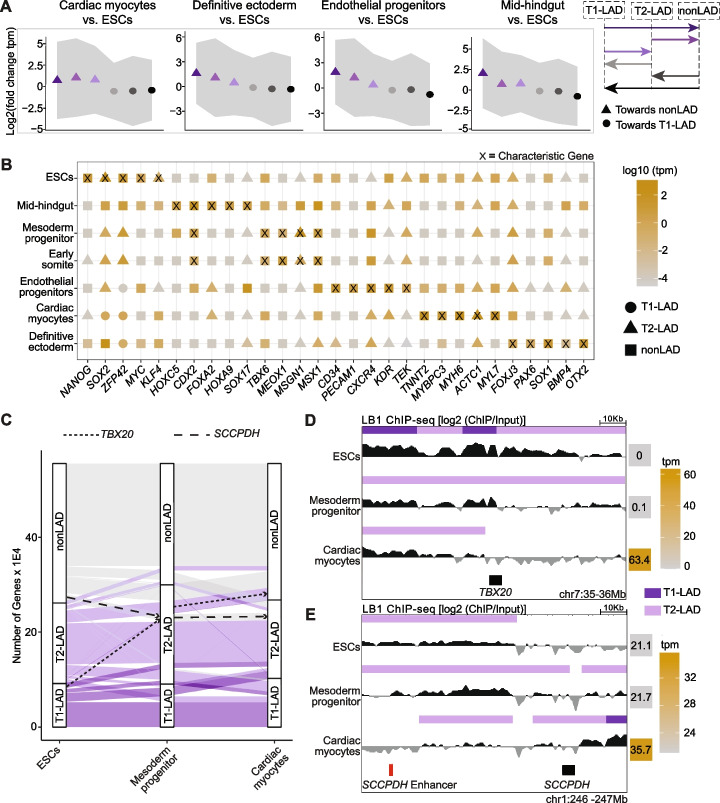
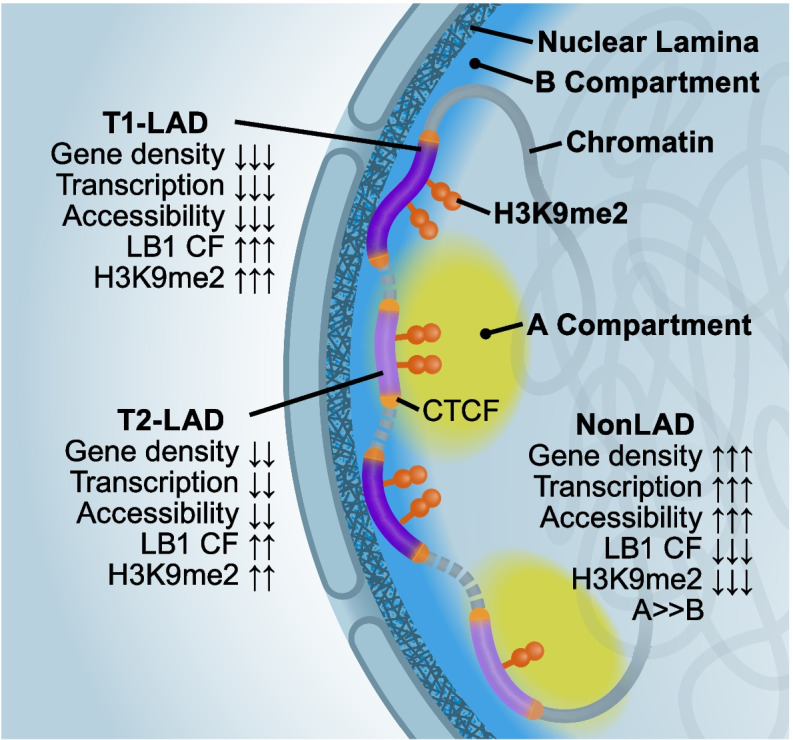
Results: To address this gap, we map LAMIN B1 occupancy across twelve human cell types encompassing pluripotent stem cells, intermediate progenitors, and differentiated cells from all three germ layers. Integrative analyses of this atlas with gene expression and repressive histone modification maps reveal that lamina-associated chromatin in all twelve cell types is organized into at least two subtypes defined by differences in LAMIN B1 occupancy, gene expression, chromatin accessibility, transposable elements, replication timing, and radial positioning. Imaging of fluorescently labeled DNA in single cells validates these subtypes and shows radial positioning of LADs with higher LAMIN B1 occupancy and heterochromatic histone modifications primarily embedded within the lamina. In contrast, the second subtype of lamina-associated chromatin is relatively gene dense, accessible, dynamic across development, and positioned adjacent to the lamina. Most genes gain or lose LAMIN B1 occupancy consistent with cell types along developmental trajectories; however, we also identify examples where the enhancer, but not the gene body and promoter, changes LAD state.

Conclusions: Altogether, this atlas represents the largest resource to date for peripheral chromatin organization studies and reveals an intermediate chromatin subtype.

Keywords: 3D genome; Cellular differentiation; Lamina-associated domains; Peripheral chromatin organization.


Conflict of interest statement

K.C.K. is currently an employee of FaunaBio. A.C. is currently an employee of Orca Bio. K.S.P. is a consultant for Tenaya Therapeutics.

Figures

Fig. 1
Fig. 1
HMM identifies 3 states from LB1 ChIP-seq datasets across 12 human cell types. A Simplified overview of progressive lineage restriction indicating some of the cell types represented in the atlas, shown from greatest (left) to least (right) developmental potential. B Example track view of LB1 enrichment and associated LADs in all 12 cell types assayed (representative replicate track shown). LAD states defined by HMM per cell type shown above each LB1 track. T1-LADs in dark purple; T2-LADs in light purple. Regions highlighted in gray span differential LB1/LAD regions between cell types. Y-axis indicated on the first track is consistent across all tracks shown. C LB1 occupancy per LAD state in all 12 cell types. T1-LADs (dark purple) are the most enriched and nonLADs (gray) are the least enriched for LB1. D LB1 occupancy measured 100 kb up- and downstream of T2-LAD boundaries with nonLADs and T1-LADs shows sharp distinction of LB1 signal between these features
Fig. 2
Fig. 2
LADs correspond closely with KDDs. A Example track view of H3K9me2 enrichment and associated KDDs in all 12 cell types assayed. KDD states as defined by HMM per cell type shown above each H3K9me2 track. T1-KDDs in dark green; T2-KDDs in light green. Regions highlighted in gray span differential H3K9me2/KDD regions between cell types. Y-axis indicated on the first track is consistent across all tracks shown. B LB1 occupancy per KDD state in all 12 cell types. T1-KDDs (dark green) are the most enriched, and nonKDDs (gray) are the least enriched for LB1. C Mean proportion of genes expressed (TPM > 5) per LAD category for cell types with matched RNA-seq data (cardiac myocytes, early somites, mesoderm progenitors, mid-hindgut, definitive ectoderm, and endothelial progenitors). Error bars indicate standard deviation. D Enrichment (positive z-score) or depletion (negative z-score) of genes. Cell types in key are as follows: Row 1 (L-R): ESC, liver progenitors, epicardium, endothelial progenitors; Row 2 (L-R): mid-hindgut, border ectoderm, anterior primitive streak, midbrain; Row 3 (L-R): cardiac myocytes, definitive ectoderm, early somite, mesoderm progenitors. E Enrichment of ATAC-seq peaks [39], and B compartment (B comp.) from matched cell types [40] (see “Methods”)
Fig. 3
Fig. 3
Genomic characterization of LAD subtypes indicates T1- and T2-LAD distinction. A Enrichment of transposable elements (top) and replication timing (RT) domains (bottom) in T1- and T2-LADs across the atlas. Transposable elements differentially enriched in T1- and T2-LADs highlighted in gray. Cell types in key are as follows: Row 1 (L-R): ESC, liver progenitors, epicardium, endothelial progenitors; Row 2 (L-R): mid-hindgut, border ectoderm, anterior primitive streak, midbrain; Row 3 (L-R): cardiac myocytes, definitive ectoderm, early somite, mesoderm progenitors. B,C CTCF binding at transitions from B nonLADs to T2-LADs (including mirrored T2-LAD to nonLAD boundaries) and C T2-LADs to T1-LADs (including mirrored T1-LAD to T2-LAD boundaries) shows CTCF enrichment at T2-LAD boundaries. D Percentage of single cells with LB1 occupancy per LAD locus in mesoderm progenitor cells shows greater overlap with T1-LADs. E chromHMM feature enrichments in LADs from four cell types, as indicated. Asterisks (*) indicate adjusted p-value < 0.01. F H3K9me2 occupancy per LAD state in selected cell types, as indicated (full set in Additional file 2: Fig. S6A). T1-LADs (dark purple) are the most enriched and nonLADs (gray) are least enriched for H3K9me2
Fig. 4
Fig. 4
T1-LAD, T2-LAD and nonLAD regions are distinctly radially positioned within the nucleus. A, B (Left) T1-LAD, T2-LAD, and nonLAD FISH probe locations in LB1 tracks in A ESCs and B cardiac myocytes. Probe indicated by blue box. Each probe in A and B assigned a unique identifier per cell type (E1-E3 and CM1-CM3; see also Additional file 2: Fig. S9A, F). (Right) Representative images of FISH foci (individual slices from Z-stack) from each tested probe region with 3D renderings of all slices to the right for ESCs A and fluorescence-activated cell sorted cardiac myocytes B. Box in the left image indicates the approximate area of the high magnification image in the middle. C Quantification (see “Methods”) of the distance of each FISH focus to the center of the nuclear lamina for the probes (noted by unique identifier) shown in A and B (see Additional file 2: Fig. S9A, B, F-H) relative to the middle of the nuclear lamina (LB1). Gray box indicates the depth of H3K9me2-marked heterochromatin at the nuclear periphery (see “Methods” and Additional file 2: Fig. S9D). D Cumulative frequency distribution of all probes imaged in study. Data in the light purple box on the left highlighted on the right. Error bars represent 1 SEM. Statistical significance of the differences in localization between T1-, T2-, and nonLAD foci in C calculated by a Kruskal-Wallis test with post hoc Dunn test for multiple comparisons. Statistical significance of differences in distribution between T1- and T2-LAD foci in D was calculated by a Kolmorgov-Smirnov test. *p<0.05, ****p<0.0001. Scale bars = 1μm
Fig. 5
Fig. 5
A subset of T1- and T2-LADs are invariant across cell types. A (Left) LAD assignments across chromosomes 1 and 5 compared across the atlas. T1-LADs in dark purple, T2-LADs in light purple, nonLADs in gray. Arrows indicate example genes located in invariant T1- and T2-LADs. (Right, top) Genome browser LB1 tracks of the OR10K1 locus, located in an invariant T1-LAD. (Right, bottom) Genome browser LB1 tracks of the PAIP1 locus, located in an invariant T2-LAD. GO categories associated with these genes are shown in Additional file 7: Table 4. Relative LB1 enrichment (Y-axis) is indicated on the first track and is consistent across all tracks shown on the right. B Percent of invariant LADs across random comparisons from 2 to 12 cell types shows decreased LAD invariance as cell type numbers increase, with T1-LADs being more invariant than T2-LADs, when stratified by LAD subtype. Lines represent means and colored ribbons represent standard deviation. Beige line represents T1- and T2-LADs combined. C Cell type pair comparisons of T1-LAD and T2-LAD variation show significantly higher invariance for T1-LADs across all possible comparisons compared to T2-LADs. T-test was used to calculate significance. D Comparison of genome-wide invariance of HMM calls in all combinations of 4 cell types, with the non-progenitor-related mesoderm cell types marked by a red line at the 96th percentile of the distribution
Fig. 6
Fig. 6
Gene expression changes broadly correspond with LAD states across developmental trajectories. A Fold change in gene expression of differentiated cell types relative to ESCs for each LAD category. Change indicated by arrows in the panel on the right. Points are mean and gray ribbons indicate standard deviation. ANOVA test is significant for all cell types. B LAD assignments and expression levels of characteristic genes for each cell type show that many canonically expressed genes are nonLADs in their respective cell types and located within LADs in alternative cell types. C Gene LAD assignment changes across cells from the mesoderm lineage. T1-LADs in dark purple, T2-LADs in light purple, nonLADs in gray. Genes rarely move from T1-LADs to nonLADs or vice versa, with T2-LADs showing the greatest gene occupancy gains and losses. D,E Track views of LB1 and LAD calls surrounding TBX20 and SCCPDH and the SCCPDH enhancer show gene LAD occupancy changes (TBX20) and enhancer-LAD occupancy changes (SCCPDH enhancer) along a cell trajectory in the mesoderm lineage (ESCs to mesoderm progenitors to cardiac myocytes)
Fig. 7
Fig. 7
Model of T1- and T2-LADs. Data from the atlas shows T1-LADs have greater LB1 contact frequency (CF) and H3K9me2 enrichment, lower transcription, lower overall accessibility, lower gene density, and greater localization with the layer of peripheral LB1 compared to T2-LADs. This suggests that T2-LADs are a peripheral chromatin subtype localized to an intermediate layer of chromatin at the nuclear periphery that borders nonLADs

Similar articles

Cited by

References

    1. Rowley MJ, Corces VG. Organizational principles of 3D genome architecture. Nat Rev Genet. 2018;19:789–800. doi: 10.1038/s41576-018-0060-8. - DOI - PMC - PubMed
    1. Zheng H, Xie W. The role of 3D genome organization in development and cell differentiation. Nat Rev Mol Cell Biol. 2019;20:535–550. doi: 10.1038/s41580-019-0132-4. - DOI - PubMed
    1. Burke B, Stewart CL. The laminopathies: the functional architecture of the nucleus and its contribution to disease. Annu Rev Genomics Hum Genet. 2006;7:369–405. doi: 10.1146/annurev.genom.7.080505.115732. - DOI - PubMed
    1. Worman HJ, Bonne G. “Laminopathies”: a wide spectrum of human diseases. Exp Cell Res. 2007;313:2121–2133. doi: 10.1016/j.yexcr.2007.03.028. - DOI - PMC - PubMed
    1. Guelen L, Pagie L, Brasset E, Meuleman W, Faza MB, Talhout W, et al. Domain organization of human chromosomes revealed by mapping of nuclear lamina interactions. Nature. 2008;453:948–951. doi: 10.1038/nature06947. - DOI - PubMed

Publication types