. 2023 Feb;22(2):e13772.
doi: 10.1111/acel.13772. Epub 2023 Jan 23.

Chronic alcohol metabolism results in DNA repair infidelity and cell cycle-induced senescence in neurons

Affiliations

Chronic alcohol metabolism results in DNA repair infidelity and cell cycle-induced senescence in neurons

Jacquelyne Ka-Li Sun et al. Aging Cell. 2023 Feb.

Abstract

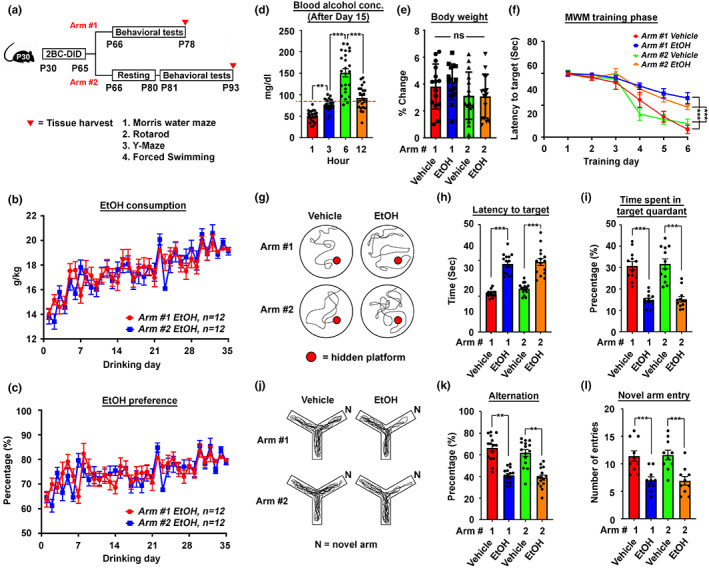
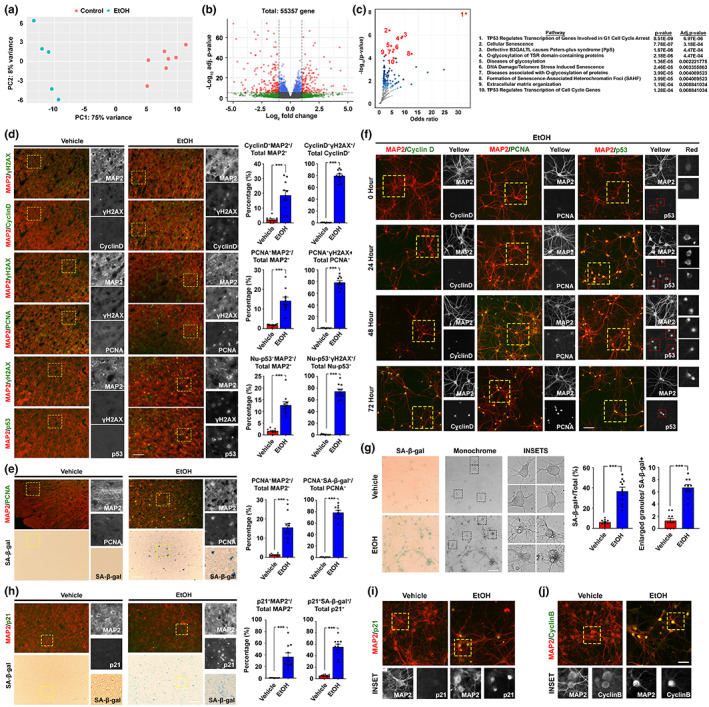
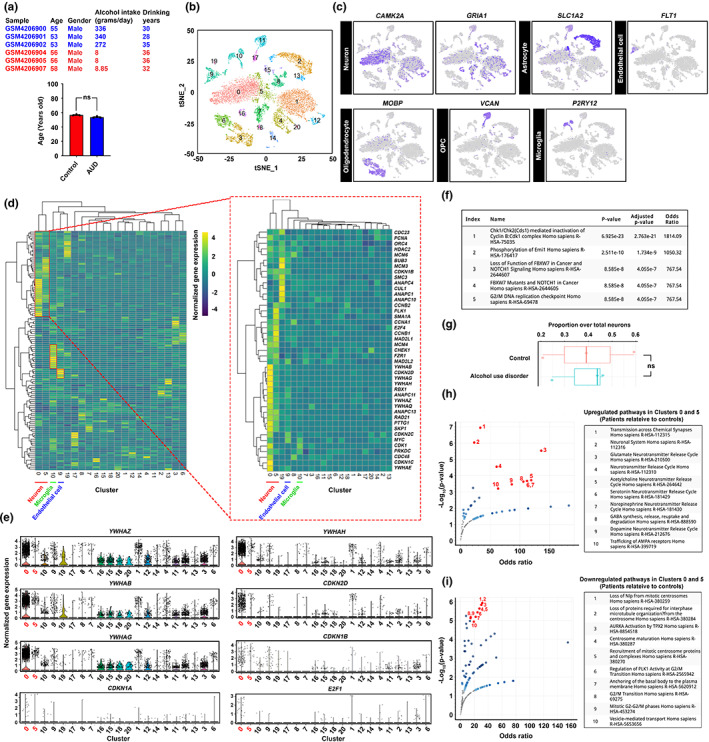
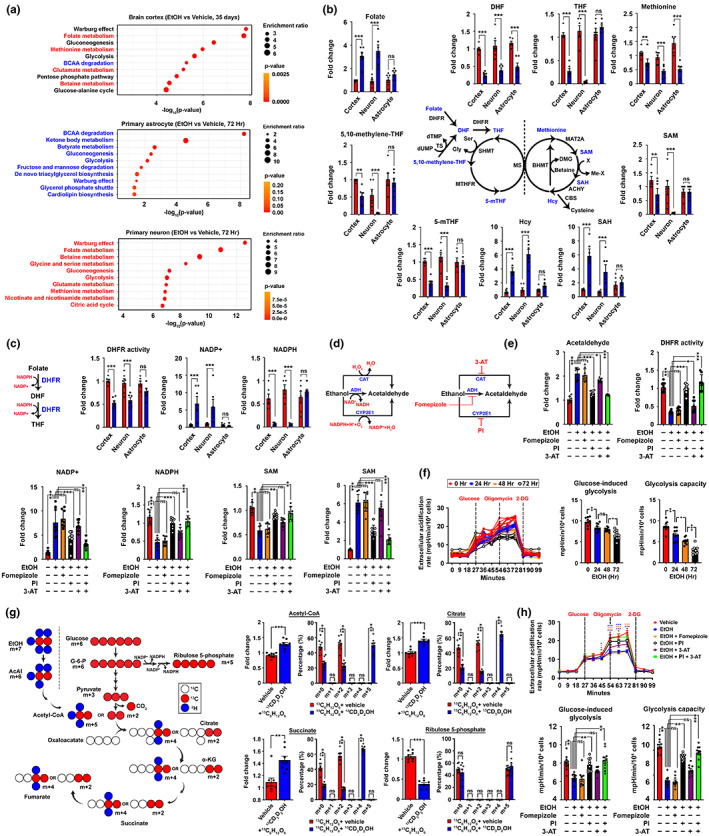
Chronic binge-like drinking is a risk factor for age-related dementia, however, the lasting and irreversible effect of alcohol on the brain remains elusive. Transcriptomic changes in brain cortices revealed pro-ageing hallmarks upon chronic ethanol exposure and these changes predominantly occur in neurons. The changes are attributed to a prioritized ethyl alcohol oxidation in these cells via the NADPH-dependent cytochrome pathway. This hijacks the folate metabolism of the 1-carbon network which supports the pathway choice of DNA repair via the non-cell cycle-dependent mismatch repair networks. The lost-in-function of such results in the de-inactivation of the less preferred cell cycle-dependent homologous recombination (HR) repair, forcing these post-mitotic cells to re-engage in a cell cycle-like process. However, mature neurons are post-mitotic. Therefore, instead of successfully completing a full round of cell cycle which is necessary for the completion of HR-mediated repair; these cells are arrested at checkpoints. The resulting persistence of repair intermediates induces and promotes the nuclear accumulation of p21 and cyclin B-a trigger for permanent cell cycle exits and irreversible senescence response. Supplementation of bioactive 5-methyl tetrahydrofolate simultaneously at times with ethyl alcohol exposure supports the fidelity of the 1-carbon network and hence the activity of the mismatch repair. This prevents aberrant and irreversible cell cycle re-entry and senescence events of neurons. Together, our findings offer a direct connection between binge-drinking behaviour and its irreversible impact on the brain, which makes it a potential risk factor for dementia.

Keywords: 1-carbon metabolism; DNA damage response; cell cycle re-entry; chronic alcohol use; metabolic reprogramming; neuronal senescence.


Conflict of interest statement

None.

Figures

FIGURE 1
FIGURE 1
Mouse 2BC‐DID paradigm revealed lasting cognitive and memory impairments. (a) The schematic diagram illustrates the timeline of the 2BC‐DID treatment paradigm with P30 C57BL/6 mice. Arms #1 and #2 represent two treatment arms with behavioural tests being immediately carried out right after the entire drinking program or being delated after a 14‐day resting period. (b) Ethanol consumption trends and (c) preference of mice in Arms #1 and 2 along the entire 2BC‐DID treatment paradigm (N = 12). (d) Blood alcohol concentration of all alcohol‐administering mice in both Arms #1 and #2 at different time points after the initiation of drinking at day 15 (N = 24, **p < 0.001, ***p < 0.0001, one‐way ANOVA). (e) Percentage body weight changes in mice from all arms and all treatments measured on the day after Day 35 of the drinking paradigm relative to the day before drinking treatment started (N = 12, ns = non‐significant, one‐way ANOVA). (f) The latency to target plot during the training phase (Day 1 to Day 6) in the Morris water maze (MWM) test (N = 12, ***p < 0.0001, two‐way ANOVA). (g) Representative swimming patterns of mice in different treatment arms during the MWM probe trial performed on Day 7. (h) The latency to target and (i) the time spent in target quadrant plots of the probe trial in the MWM test (N = 12, ***p < 0.0001, one‐way ANOVA). (j) Representative walking patterns of mice in different treatment arms in a Y‐maze paradigm. (k) The percentage of alternation and (l) the number of novel time entry was recorded and calculated (N = 12, **p < 0.001, ***P < 0.0001, one‐way ANOVA). Values represent the mean ± SEM.
FIGURE 2
FIGURE 2
Mouse 2BC‐DID paradigm resulted in a transcriptomic profile supporting neuronal senescence. (a) Principal component plot (PCA) indicated that samples from the control and ethanol‐administered group of Arm #2 were distinctly clustered (N = 5–7). (b) The volcano plot indicated that 1643 transcripts were significantly different between the two groups (adjusted p‐value <0.05; Log2(fold change) > |0.5|). (c) With the Reactome pathway database, significantly upregulated genes were clustered, and the volcano plot indicated the odds ratio and significance of the enriched pathways. The top 10 pathways were listed. (d) Representative immunofluorescent staining images of the prefrontal cortex regions of brain samples harvested and the corresponding quantifications (N = 10, ***p < 0.0001, two‐tailed unpaired t‐test, scale bar: 200 μm). (e) Representative SA‐β‐gal and immunofluorescent staining images indicating the relationship between cellular senescence and neuronal cell cycle re‐entry in the prefrontal cortex regions (N = 10, ***p < 0.0001, two‐tailed unpaired t‐test, scale bar: 200 μm). (f) Representative immunofluorescent staining images of primary neurons subjected to ethanol for different time courses in the CIE treatment paradigm (N = 20, scale bar: 100 μm). (g) Representative images of SA‐β‐gal signals in primary neuronal culture subjected to CIE paradigm for 72 h (N = 10, ***p < 0.0001, two‐tailed unpaired t‐test, scale bar: 100 μm). (h) Representative SA‐β‐gal and immunofluorescent staining images indicating the relationship between SA‐β‐gal signals and other senescence markers (i.e., p21) in the prefrontal cortex region (N = 10, ***p < 0.0001, two‐tailed unpaired t‐test, scale bar: 200 μm). (i and j) Representative immunofluorescent staining images of primary neurons subjected to exposure to alcohol for 72 h in the CIE treatment paradigm for senescence markers, including nuclear p21 and cyclin B signals (N = 20, scale bar: 100 μm). Values represent the mean ± SEM.
FIGURE 3
FIGURE 3
Senescent neurons in the post‐mortem brain prefrontal cortex harvested from individuals with alcohol use disorders revealed unique transcriptomic features. (a) Single‐nuclei transcriptome profiling of an existing public dataset (GSE141552) was performed. Age‐ samples (i.e., control group = 56.67 ± 0.6667; AUD = 53.67 ± 0.6667) and sex‐matched samples were selected and analysed. (b) T‐distributed stochastic neighbour embedding (t‐SNE) plot of all nuclei extracted from the dataset, which was then segregated and coloured as 20 distinct clusters of brain cells, based on their transcriptome features. (c) Based on the known markers of the major cell types, clusters of neurons, astrocytes, endothelial cells, oligodendrocytes, oligodendrocyte progenitor cells (OPCs) and microglia were identified. (d) Targeted analyses of cell cycle‐associated genes obtained from the KEGG database (hsa04110) were performed. Heightened expression of cell cycle‐associated genes was observed in clusters 0 (neuron), 5 (neuron), 10 (microglia) and 10 (endothelial cells). (e) Violin plots indicate the expression levels of a number of cell cycle‐related genes that are mostly enriched in clusters 0 and 5. (f) Pathways of 42 cell cycle‐related genes enriched in clusters 0 and 5 relative to the rest of other neurons were clustered based on the Reactome database. The top 5 enriched pathways were listed. (g) The proportion of clusters 0 and 5 neurons over total neurons in control and AUD samples (N = 3, ns = non‐significant, two‐tailed unpaired t‐test). (h and i) Comparison of neurons in clusters 0 and 5 between AUD and control patient samples. With the Reactome pathway database, significantly (h) upregulated and (i) downregulated genes were clustered. The volcano plots indicated the odds ratio and significance of the enriched pathways. The top 10 pathways were listed.
FIGURE 4
FIGURE 4
CYP2E1‐dependent ethanol metabolism hijacks the NADPH/NADP+ homeostasis and global metabolic landscape in neurons. (a) Global metabolic profiling of freshly harvested mouse brain cortex tissues right after completing the entire 2BC‐DID treatment paradigm (Arm #1), so as primary astrocytes and neurons after being subjected to the CIE treatment for 72 h was performed. Differentially changed metabolites were clustered and analysed by the metabolite set enrichment analysis (MESA). Pathways were ranked according to the significance values (N = 6). (b) Schematic diagram of the folate‐methionine cycle, detailed changes in key metabolites involved were shown (N = 6, **p < 0.001, ***p < 0.0001, two‐tailed unpaired t‐test within specific type of samples). (c) Schematic diagram showing the reactions involved in converting folate to DHF and then THF by the common DHFR enzyme. Quantifications of DHFR activities, NADP+ and NADPH levels were performed (N = 6, ***p < 0.0001, ns = non‐significant, two‐tailed unpaired t‐test). (d) Schematic diagram showing the possible reactions in converting ethanol to acetaldehyde, and the specific inhibitors against these reactions (PI: Phenethyl isothiocyanate; 3‐AT: 3‐amino‐1,2,4‐triazole). (e) Changes in DHFR activities so as the levels of acetaldehyde, NADP+, NADPH, SAM and SAH were analysed in primary neurons upon CIE and various drug treatments for 72 h (50 μM fomepizole, 10 μM PI and 20 μM 3‐AT) as indicated (N = 8, ***p < 0.0001, **p < 0.001, *p < 0.01, ns = non‐significant, one‐way ANOVA). (f) Glycolytic functions of primary neurons subjected to the CIE paradigm for various time course was evaluated. Glucose‐induced and maximal glycolytic capacities were calculated (N = 10, **p < 0.001, *p < 0.01, ns = non‐significant, one‐way ANOVA). (g) Schematic presentation of the oxidative reactions of glucose versus ethanol flux into the central carbon metabolic network. Mass isotopologue analysis of acetyl‐CoA, citrate, succinate and ribulose‐5‐phosphate in primary neurons exposed to glucose‐13C6 isotope alone or simultaneously with ethanol‐13C2,1,1,2,2,2‐d5 for 2 h (N = 8, ***p < 0.0001, **p < 0.001, ns = non‐significant, two‐tailed unpaired t‐test). (h) In primary neurons subjected to the CIE paradigm co‐treated with various small molecules for 72 h (50 μM fomepizole, 10 μM PI and 20 μM 3‐AT) as labelled, glycolytic functions against time, glycose‐induced and maximal glycolytic capacities were evaluated (N = 10, ***p < 0.0001, **p < 0.001, *p < 0.01, ns = non‐significant, one‐way ANOVA). Values represent the mean ± SEM.
FIGURE 5
FIGURE 5
Prolonged ethanol exposure results in DNA‐repair infidelity in cortical neurons. (a) Quantifications of 1, N2‐ethanol‐2′‐dG and (b) 1, N2‐propano‐2′‐dG adducts in brain cortical tissues (N = 8, ***p < 0.0001, two‐tailed unpaired t‐test) and primary cortical neuron subjected to the CIE and drug co‐treatment for 72 h (10 μM PI and 20 μM 3‐AT) (N = 8, ***p < 0.0001, **p < 0.001, *p < 0.01, one‐way ANOVA). (c) Product ion spectra of acetaldehyde‐induced DNA crosslinks measured as dinucleosides. Quantification of their relative abundances in brain cortical tissues (N = 8, ***p < 0.0001, two‐tailed unpaired t‐test) and primary cortical neuron subjected to the CIE and drug co‐treatment for 72 h (10 μM PI and 20 μM 3‐AT) (N = 8, ***p < 0.0001, **p < 0.001, *p < 0.01, one‐way ANOVA). (d) Schematic diagram showing the possible repair pathways for ICL lesions in proliferating and non‐proliferating cells. (e) Representative immunofluorescent staining images of the prefrontal cortex regions of brain samples harvested from mice subjected to different length periods of the 2BC‐DID paradigm (N = 10, scale bar: 200 μm). (f) Representative SA‐β‐gal and immunofluorescent staining images indicating the relationship between cellular senescence and the failure of RPA1 (i.e., RPA70) and RAD51 exchange in neurons. Quantifications were shown (N = 10, ***p < 0.0001, two‐tailed unpaired t‐test, scale bar: 200 μm). Values represent the mean ± SEM.
FIGURE 6
FIGURE 6
5‐methyl tetrahydrofolate (5‐mTHF) supplementation supports mismatch repair signalling, and prevents neuronal cell senescence and brain function decline induced by chronic ethanol exposure. (a) Representative Western blots show that CIE treatment for 72 h in primary neurons results in reduced activities of SETD2, as reflected by reduced levels of H3K36me3. Quantification of the relative band intensities between H3K36me3 over total histone H3 levels was shown (N = 6, ***p < 0.0001, two‐tailed unpaired t‐test). (b) Quantification of 5‐mTHF in primary neurons subjected to 72 h of CIE treatment (N = 9, ***p < 0.0001, two‐tailed unpaired t‐test). (c) Representative Western blots showing reduced activities of SETD2 in primary neurons subjected to CIE treatment for 72 h was prevented by co‐administration of 100 nM 5‐mTHF but not the same quantity of folate. Quantification of the relative band intensities between H3K36me3 over total histone H3 levels was shown (N = 6, ***p < 0.0001, ns = non‐significant, one‐way ANOVA). (d) Representative Western blots showing the effect mediated by 100 nM 5‐mTHF on H3K36me3 was dependent on active SETD2 enzyme. Quantification of the relative band intensities between H3K36me3 over total histone H3 levels was shown (N = 6, ***p < 0.0001, ns = non‐significant, one‐way ANOVA). (e) Schematic diagram showing the possible repair pathway choices for ICL lesions in neurons subjected to CIE and 100 nM 5‐mTHF supplementation. (f and g) Representative immunofluorescent staining images of markers in (f) different repair ICL repair pathways, (g) cell cycle reengagement and cellular senescence in primary neurons subjected to the exposure of alcohol for 72 h in the CIE treatment paradigm. Quantifications of relative cell populations were shown below (N = 10, ***p < 0.0001, ns = non‐significant, one‐way ANOVA, scale bar: 100 μm). (h) Quantification of 5‐mTHF in brain cortex tissues subjected to the entire 2BC‐DID paradigm (N = 9, ***p < 0.0001, two‐tailed unpaired t‐test). (i) Representative Western blots showing the reduction in activities of SETD2 in the brain cortex subjected to the entire 2BC‐DID was prevented by intra‐nasal co‐administration of 100 ng/day of 5‐mTHF but not the same quantity of folate (N = 6, ***p < 0.0001, ns = non‐significant, one‐way ANOVA). (j) Representative SA‐β‐gal and immunofluorescent staining images indicating cellular senescence and neuronal cell cycle re‐entry phenomenon in the prefrontal cortex regions were alleviated upon intra‐nasal co‐administration of 100 ng/day 5‐mTHF (N = 10, ***p < 0.0001, own‐way ANOVA, scale bar: 200 μm). (k) Representative swimming patterns of mice revealed that the lasting impact of chronic binge‐like drinking was alleviated upon intra‐nasal co‐administration of 100 ng/day 5‐mTHF. The latency to the target of the probe trial in the MWM test was quantified (N = 10, ***p < 0.0001, **p < 0.001, ns = non‐significant, one‐way ANOVA). (l) Representative walking patterns of mice revealed that the lasting impact of chronic binge‐like drinking was alleviated upon intra‐nasal co‐administration of 100 ng/day 5‐mTHF. The percentage of alternation was recorded and calculated (N = 10, ***p < 0.0001, **p < 0.001, *p < 0.01, ns = non‐significant, one‐way ANOVA). Values represent the mean ± SEM.
FIGURE 7
FIGURE 7
The common ALDH2 loss‐of‐function mutation exacerbates DNA damage‐associated stress and neuronal senescence but was alleviated by a metabolic drug‐nutrient dyad strategy. (a) Schematic diagram showing the mouse breeding scheme. (b) By 3 months of age, mice were subjected to the 2BC‐DID paradigm with or without intranasal drug supplementation, followed by 14 days of alcohol abstained period before undergoing thorough behavioural testing to evaluate the effect of neuronal Aldh2 knockout at both cell and behaviour levels. (c) Ethanol consumption trends and (d) preference of mice along the entire 2BC‐DID treatment paradigm (N = 10). (e) Blood alcohol concentration of all alcohol‐administering mice at different time points after the initiation of drinking on Day 15 (N = 24, **p < 0.001, ***p < 0.0001, one‐way ANOVA). (f) Percentage body weight changes in mice from all arms and all treatments measured on the day after drinking Day 35 relative to the day before the drinking treatment started (N = 10, ns = non‐significant, one‐way ANOVA). (g) Representative swimming patterns in the MWM probe trial, and latencies to target were quantified (N = 8, ***p < 0.0001, ns = non‐significant, one‐way ANOVA). (h) Representative walking patterns in the Y‐maze paradigm, percentage of alternation was quantified (N = 8, ***p < 0.0001, ns = non‐significant, one‐way ANOVA). (i) Representative brain section images illustrating the cyclin B‐ and SA‐β‐gal‐double positive neuronal loads in the prefrontal cortex regions of Aldh2 +/+ and Aldh2 −/− mice after the entire 2BC‐DID treatment paradigm (N = 9, ***p < 0.0001, **p < 0.001, one way ANOVA, scale bar: 200 μm). (j) Representative brain section images illustrating the effect of 5‐mTHF supplementation on the accumulation of cyclin B‐ and SA‐β‐gal‐double positive neurons after the 2BC‐DID treatment paradigm (N = 9, ***p < 0.0001, ns = non‐significant, one‐way ANOVA, scale bar: 200 μm). (k–o) By re‐expressing the human ALDH2*1 or ALDH2*2 variant specifically into prefrontal cortex neurons of Aldh2 −/− mice, supplementation of 100 ng/day 5‐mTHF ±25 μg Alda1 or vehicle in 10 μl total volume along the entire 2BC‐DID treatment paradigm was performed. (k) Representative images and (l) quantification of the proportion of SA‐β‐gal and GFP double‐positive neurons were shown (N = 8, ***p < 0.0001, **p < 0.001, ns = non‐significant, one‐way ANOVA, scale bar: 200 μm). (m) the overall brain cortex ALDH2 activities, (n) behavioural performances in MWM and (o) Y‐maze paradigms were analysed (N = 8, ***p < 0.0001, **p < 0.001, *p < 0.01, ns = non‐significant, one‐way ANOVA). Values represent the mean ± SEM.

Similar articles

Cited by

References

    1. Abdel‐Azeim, S. , Li, X. , Chung, L. W. , & Morokuma, K. (2011). Zinc‐homocysteine binding in cobalamin‐dependent methionine synthase and its role in the substrate activation: DFT, ONIOM, and QM/MM molecular dynamics studies. Journal of Computational Chemistry, 32(15), 3154–3167. 10.1002/jcc.21895 - DOI - PubMed
    1. Becker, H. C. (2013). Animal models of excessive alcohol consumption in rodents. Current Topics in Behavioral Neurosciences, 13, 355–377. 10.1007/7854_2012_203 - DOI - PubMed
    1. Brenner, E. , Tiwari, G. R. , Kapoor, M. , Liu, Y. , Brock, A. , & Mayfield, R. D. (2020). Single cell transcriptome profiling of the human alcohol‐dependent brain. Human Molecular Genetics, 29(7), 1144–1153. 10.1093/hmg/ddaa038 - DOI - PMC - PubMed
    1. Brooks, P. J. , & Theruvathu, J. A. (2005). DNA adducts from acetaldehyde: Implications for alcohol‐related carcinogenesis. Alcohol, 35(3), 187–193. 10.1016/j.alcohol.2005.03.009 - DOI - PubMed
    1. Brunet, A. , Kanai, F. , Stehn, J. , Xu, J. , Sarbassova, D. , Frangioni, J. V. , Dalal, S. N. , Decaprio, J. A. , Greenberg, M. E. , & Yaffe, M. B. (2002). 14‐3‐3 transits to the nucleus and participates in dynamic nucleocytoplasmic transport. The Journal of Cell Biology, 156(5), 817–828. 10.1083/jcb.200112059 - DOI - PMC - PubMed

Publication types