Development and validation of a dynamic 48-hour in-hospital mortality risk stratification for COVID-19 in a UK teaching hospital: a retrospective cohort study
- PMID: 36691139
- PMCID: PMC9445230
- DOI: 10.1136/bmjopen-2021-060026
Development and validation of a dynamic 48-hour in-hospital mortality risk stratification for COVID-19 in a UK teaching hospital: a retrospective cohort study
Abstract
Objectives: To develop a disease stratification model for COVID-19 that updates according to changes in a patient's condition while in hospital to facilitate patient management and resource allocation.
Design: In this retrospective cohort study, we adopted a landmarking approach to dynamic prediction of all-cause in-hospital mortality over the next 48 hours. We accounted for informative predictor missingness and selected predictors using penalised regression.
Setting: All data used in this study were obtained from a single UK teaching hospital.
Participants: We developed the model using 473 consecutive patients with COVID-19 presenting to a UK hospital between 1 March 2020 and 12 September 2020; and temporally validated using data on 1119 patients presenting between 13 September 2020 and 17 March 2021.
Primary and secondary outcome measures: The primary outcome is all-cause in-hospital mortality within 48 hours of the prediction time. We accounted for the competing risks of discharge from hospital alive and transfer to a tertiary intensive care unit for extracorporeal membrane oxygenation.
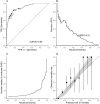
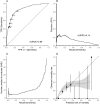
Results: Our final model includes age, Clinical Frailty Scale score, heart rate, respiratory rate, oxygen saturation/fractional inspired oxygen ratio, white cell count, presence of acidosis (pH <7.35) and interleukin-6. Internal validation achieved an area under the receiver operating characteristic (AUROC) of 0.90 (95% CI 0.87 to 0.93) and temporal validation gave an AUROC of 0.86 (95% CI 0.83 to 0.88).
Conclusions: Our model incorporates both static risk factors (eg, age) and evolving clinical and laboratory data, to provide a dynamic risk prediction model that adapts to both sudden and gradual changes in an individual patient's clinical condition. On successful external validation, the model has the potential to be a powerful clinical risk assessment tool.
Trial registration: The study is registered as 'researchregistry5464' on the Research Registry (www.researchregistry.com).
Keywords: COVID-19; epidemiology; risk management; statistics & research methods.
© Author(s) (or their employer(s)) 2022. Re-use permitted under CC BY-NC. No commercial re-use. See rights and permissions. Published by BMJ.
Conflict of interest statement
Competing interests: None Declared.
Figures


Similar articles
-
Risk stratification of patients admitted to hospital with covid-19 using the ISARIC WHO Clinical Characterisation Protocol: development and validation of the 4C Mortality Score.BMJ. 2020 Sep 9;370:m3339. doi: 10.1136/bmj.m3339. BMJ. 2020. PMID: 32907855 Free PMC article.
-
Development and external validation of prognostic models for COVID-19 to support risk stratification in secondary care.BMJ Open. 2022 Jan 17;12(1):e049506. doi: 10.1136/bmjopen-2021-049506. BMJ Open. 2022. PMID: 35039282 Free PMC article.
-
Development and Validation of a Dynamic Real-Time Risk Prediction Model for Intensive Care Units Patients Based on Longitudinal Irregular Data: Multicenter Retrospective Study.J Med Internet Res. 2025 Apr 23;27:e69293. doi: 10.2196/69293. J Med Internet Res. 2025. PMID: 40266658 Free PMC article.
-
Using Predictive Models to Improve Care for Patients Hospitalized with COVID-19 [Internet].Washington (DC): Patient-Centered Outcomes Research Institute (PCORI); 2023 Jan. Washington (DC): Patient-Centered Outcomes Research Institute (PCORI); 2023 Jan. PMID: 38976624 Free Books & Documents. Review.
-
External validation of six COVID-19 prognostic models for predicting mortality risk in older populations in a hospital, primary care, and nursing home setting.J Clin Epidemiol. 2024 Apr;168:111270. doi: 10.1016/j.jclinepi.2024.111270. Epub 2024 Feb 2. J Clin Epidemiol. 2024. PMID: 38311188
Cited by
-
A pipeline to further enhance quality, integrity and reusability of the NCCID clinical data.Sci Data. 2023 Jul 27;10(1):493. doi: 10.1038/s41597-023-02340-7. Sci Data. 2023. PMID: 37500661 Free PMC article.
References
Publication types
MeSH terms
Grants and funding
LinkOut - more resources
Full Text Sources
Medical
