. 2023 Apr 3;191(4):2185-2203.
doi: 10.1093/plphys/kiad035.

Defining the lipidome of Arabidopsis leaf mitochondria: Specific lipid complement and biosynthesis capacity

Affiliations

Defining the lipidome of Arabidopsis leaf mitochondria: Specific lipid complement and biosynthesis capacity

Yi-Tse Liu et al. Plant Physiol. .

Abstract

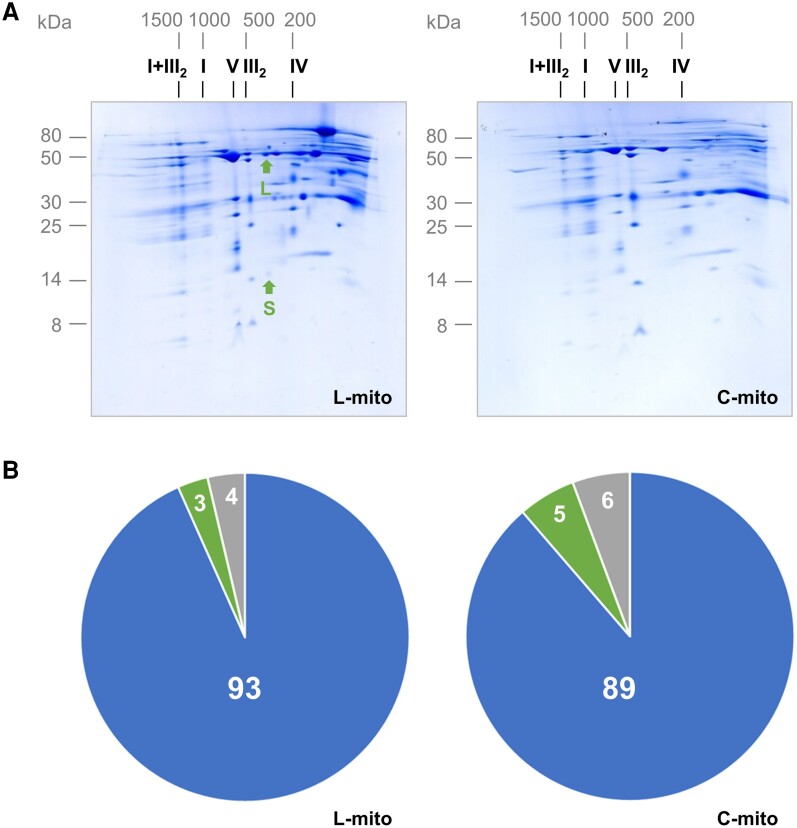
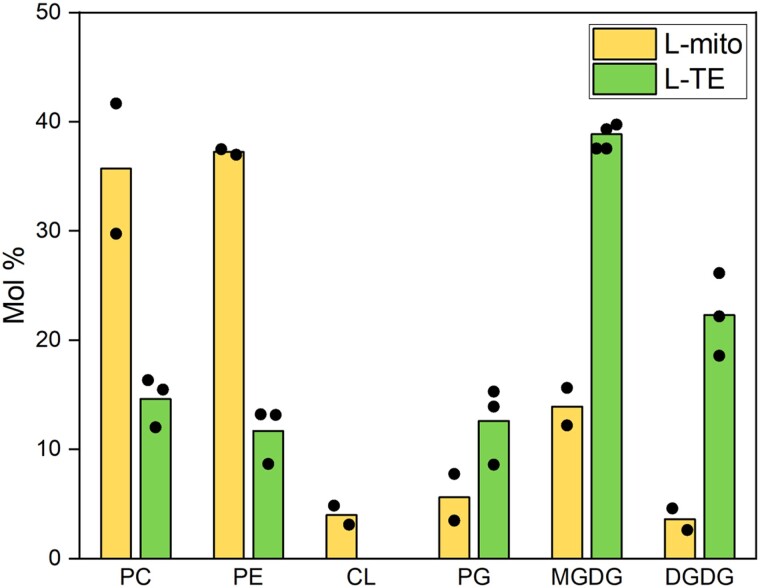
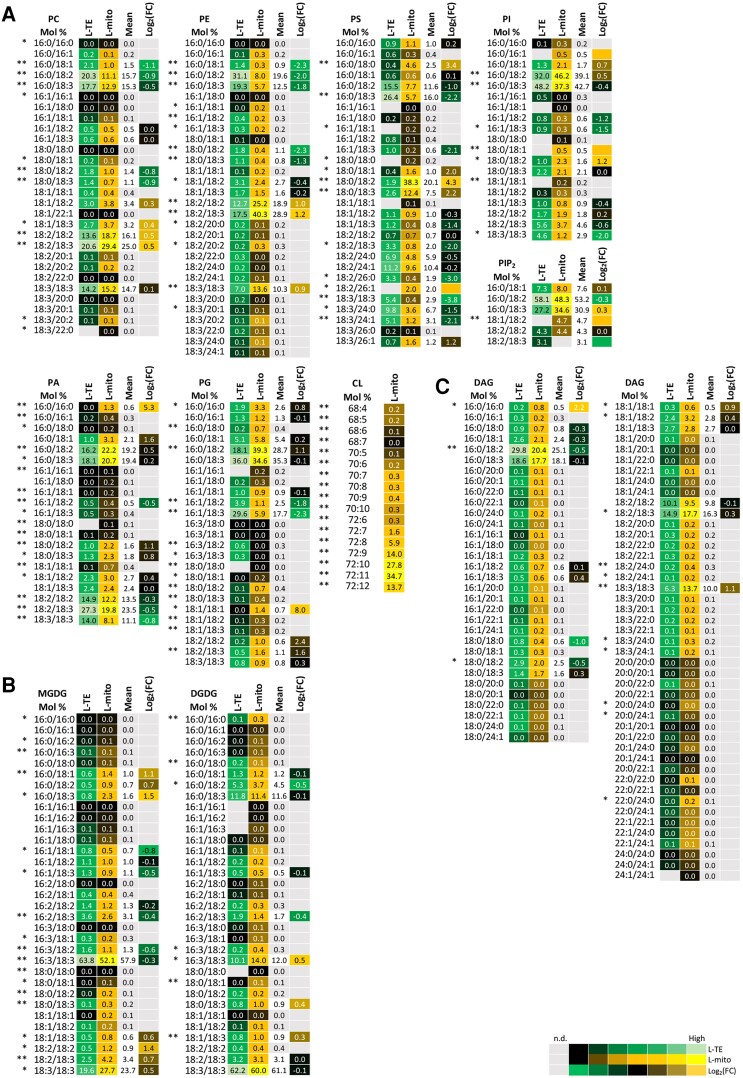
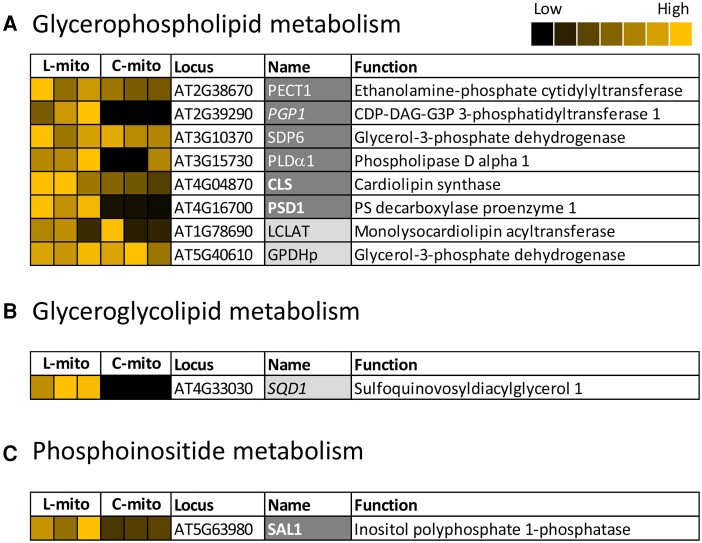
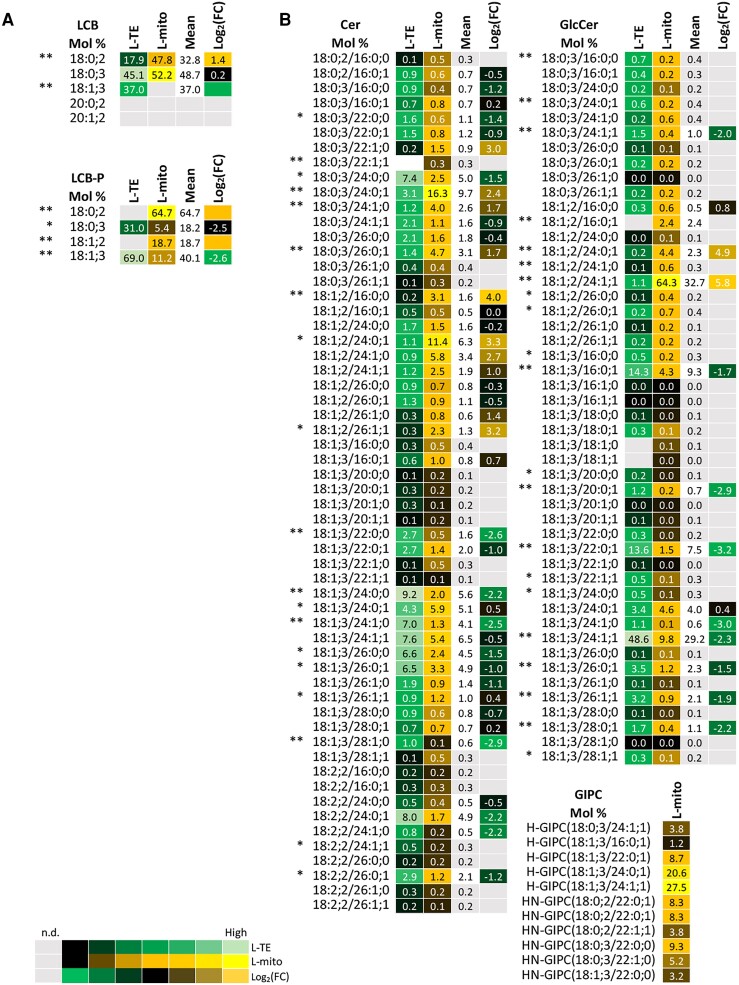
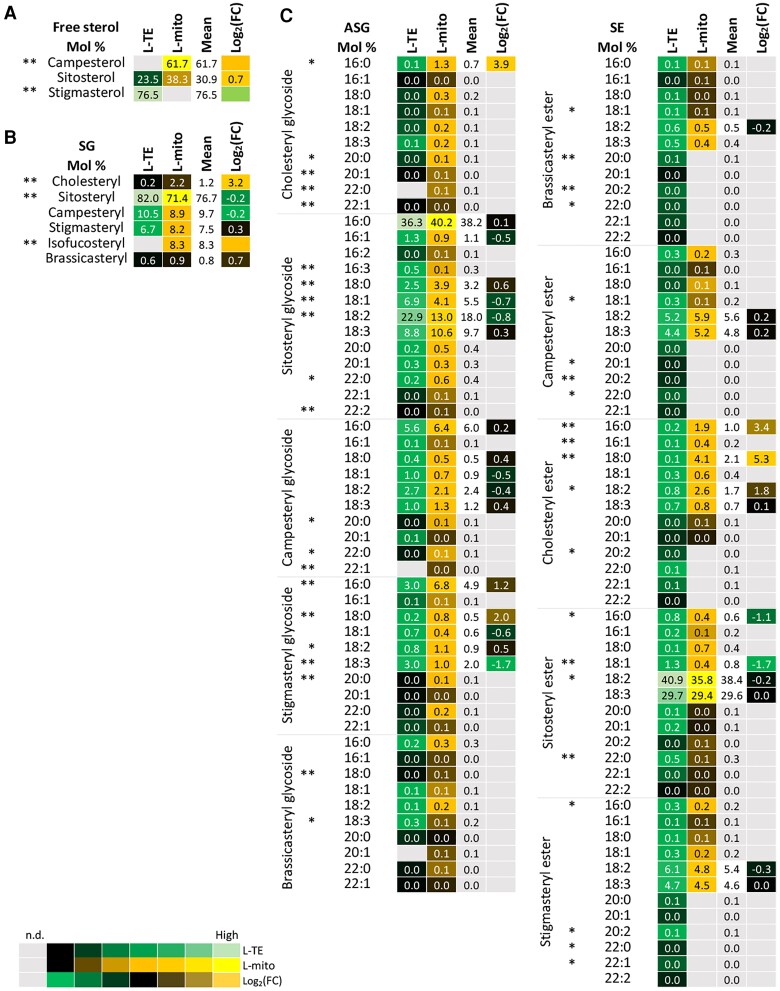
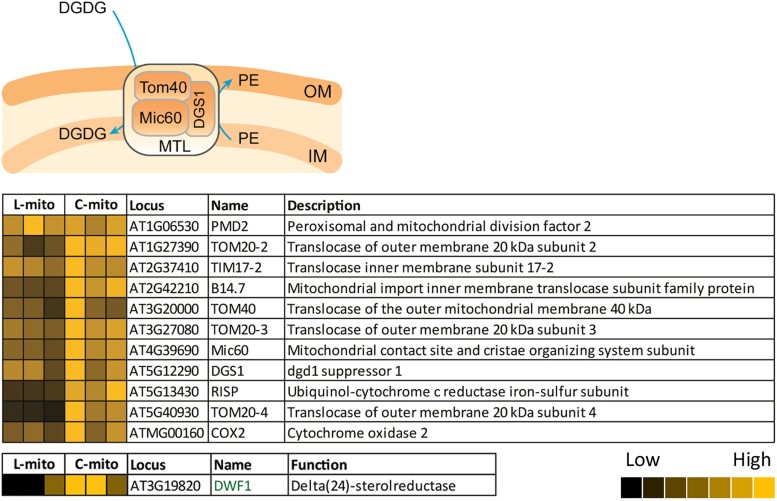
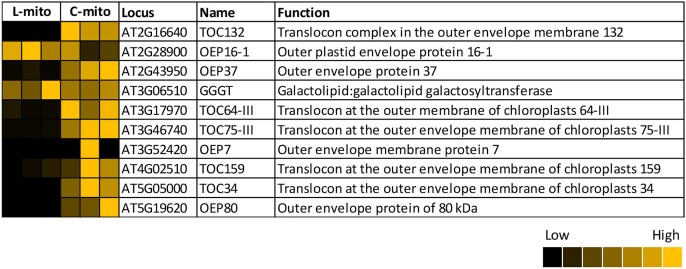
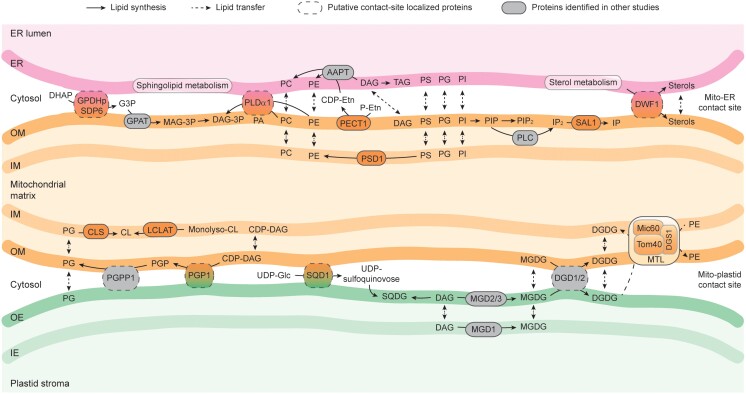
Mitochondria are often considered as the power stations of the cell, playing critical roles in various biological processes such as cellular respiration, photosynthesis, stress responses, and programmed cell death. To maintain the structural and functional integrities of mitochondria, it is crucial to achieve a defined membrane lipid composition between different lipid classes wherein specific proportions of individual lipid species are present. Although mitochondria are capable of self-synthesizing a few lipid classes, many phospholipids are synthesized in the endoplasmic reticulum and transferred to mitochondria via membrane contact sites, as mitochondria are excluded from the vesicular transportation pathway. However, knowledge on the capability of lipid biosynthesis in mitochondria and the precise mechanism of maintaining the homeostasis of mitochondrial lipids is still scarce. Here we describe the lipidome of mitochondria isolated from Arabidopsis (Arabidopsis thaliana) leaves, including the molecular species of glycerolipids, sphingolipids, and sterols, to depict the lipid landscape of mitochondrial membranes. In addition, we define proteins involved in lipid metabolism by proteomic analysis and compare our data with mitochondria from cell cultures since they still serve as model systems. Proteins putatively localized to the membrane contact sites are proposed based on the proteomic results and online databases. Collectively, our results suggest that leaf mitochondria are capable-with the assistance of membrane contact site-localized proteins-of generating several lipid classes including phosphatidylethanolamines, cardiolipins, diacylgalactosylglycerols, and free sterols. We anticipate our work to be a foundation to further investigate the functional roles of lipids and their involvement in biochemical reactions in plant mitochondria.


Conflict of interest statement

Conflict of interest statement. None declared.

Figures

Figure 1
Figure 1
Purity of mitochondrial fractions. The purity of mitochondrial fractions was determined by 2D BN/SDS-PAGE (A) and by summed-up peptide intensities of subcellular compartments based on protein assignments as given by the Subcellular localization database for Arabidopsis proteins (SUBAcon; www.suba.live) (B). A, Mitochondria were isolated from Arabidopsis leaves (L-mito) and cell cultures (C-mito). Proteins were separated by 2D BN/PAGE and Coommassie-stained. Numbers on top and to the left of the 2D gels refer to the masses of standard protein complexes/proteins (in kDa), the roman numbers above the gels to the identity of oxidative phosphorylation (OXPHOS) complexes. I + III2: supercomplex consisting of complex I and dimeric complex III; I: complex I; V: complex V; III2: dimeric complex III; IV: complex IV. The small (S; 14.5 kDa) and the large (L; 53.5 kDa) subunit of Rubisco are indicated by arrows. Mitochondrial preparations derive from three independent experiments, and 2D gels were run for each of the three extractions for L-mito and C-mito. Here one representative gel image is shown and the corresponding 2D gels of the two remaining biological replicates as well as one reference gel each for mitochondrial and chloroplast fractions from Arabidopsis cell culture (Mito ref) or leaves (Cp rev) are shown in Supplemental Figure 1. These three preparations were used for lipidomics with liquid chromatography tandem mass spectrometry (LC–MS/MS) (Figures 3, 5, and 6; Supplemental Figure 3) and proteomics (B). B, Mitochondrial fractions from Arabidopsis leaves and cell cultures were analyzed by label-free quantitative shotgun proteomics. Peptide intensities assigned to subcellular compartments were summed-up, and averaged results for L-mito and C-mito from the three independent experiments were visualized by pie charts (for detailed results see Supplemental Figure 2 and Supplemental Table 1). Blue: mitochondria; green: plastids; gray: others; numbers in %.
Figure 2
Figure 2
Lipid class profiles of purified mitochondria and total leaf extracts. Glycerolipids of leaf total extract (L-TE) and mitochondria isolated from leaves (L-mito) were analyzed by a TLC–GC/FID approach. Data of L-TE represent mean values in mol % from three independent experiments; data of L-mito represent mean values in mol % from two of the three independent experiments. PC, phosphatidylcholine; PE, phosphatidylethanolamine; CL, cardiolipin; PG, phosphatidylglycerol; MGDG, monogalactosyldiacylglycerol; DGDG, digalactosyldiacylglycerol.
Figure 3
Figure 3
Profiles of the distribution and fold changes (FC) of the molecular glycerolipid species between total extracts and mitochondrial fractions isolated from Arabidopsis leaves (L-mito and L-TE). Heat map visualizations of (A) glycerophospholipids, (B) glyceroglycolipids and (C) diacylglycerols illustrate the difference of species distribution based on liquid chromatography tandem mass spectrometry (LC–MS/MS) analyses. Each lipid class is represented by one set of joined columns, only DAG is divided into two sets due to space constraints. Identity of columns in each set from left to right: Column 1 lists the individual lipid class and the identity of the detected molecular lipid species. Column 2 (L-TE) lists the respective distribution of each molecular species in L-TE, expressed as the mean of its relative values in mol % in the three independent experiments also used for proteomics and for sphingolipid and sterol analysis (Figures 1, 5, and 6; Supplemental Table 1). Column 3 (L-mito) lists the respective distribution of each molecular species in L-mito, expressed as the mean of its relative values (mol%) in the three independent experiments also used for proteomics. Column 4 lists the mean distribution of both sample types, and column 5 (Log2(FC)) lists the binary logarithm of fold change. Binary logarithm was applied when the mean values are higher than 0.5 to inspect the FC between L-mito and L-TE. The heat map colors represent mean intensity values according to the color map on the low right-hand side. *, ** indicate P values <0.05 and <0.01, respectively, by Student’s t-test. PC, phosphatidylcholine; PE, phosphatidylethanolamine; PS, phosphatidylserine; PI, phosphatidylinositol; PA, phosphatidic acid; DAG, diacylglycerol; CL, cardiolipin; PG, phosphatidylglycerol; MGDG, monogalactosyldiacylglycerol; DGDG, digalactosyldiacylglycerol.
Figure 4
Figure 4
Mitochondrial localized proteins that are related to glycerolipid biosynthesis in Arabidopsis leaves (L-mito) and cell cultures (C-mito). A, Glycerophospholipid, (B) glyceroglycolipid, and (C) phosphoinositide metabolism. Proteins identified and/or localized in mitochondria were labeled (i) dark gray: proteins identified in the proteomic analysis of this study and also predicted to localize in mitochondria, (ii) light gray: proteins identified in the proteomic analysis of this study in mitochondria but predicted to localize in other organelles, (iii) bold font: exclusively localized in mitochondria and (iv) italic font: only identified in one of the mitochondrial populations. Heat maps visualize the protein abundance of three independent experiments of mitochondria purified from leaves and cell cultures from Figure 1 and listed in Supplemental Tables 1 and 3. The heat map colors represent mean intensity values according to the color map on the top right-hand side. The absolute values represented by each color map are deposited in Supplemental Table 1. Predicted protein localization was based on The Arabidopsis Information Resource (TAIR; www.arabidopsis.org) and the Subcellular localization database for Arabidopsis proteins (SUBAcon; www.suba.live).
Figure 5
Figure 5
Profiles of the distribution and fold changes (FC) of the molecular sphingolipid species between total extracts and mitochondrial fractions isolated from Arabidopsis leaves (L-mito and L-TE). Heat map visualizations of (A) LCB, LCB-P, and (B) complex sphingolipids illustrate the difference of species distribution based on liquid chromatography tandem mass spectrometry (LC–MS/MS) analyses. Each lipid class is represented by one set of joined columns. Identity of columns in each set from left to right: Column 1 lists the individual lipid class and the identity of the detected molecular lipid species. Column 2 (L-TE) lists the respective distribution of each molecular species in L-TE, expressed as the mean of its relative values (mol %) in the three independent experiments also used for proteomics and for glycerolipid and sterol analysis (Figures 1, 3 and 6; Supplemental Table 1). Column 3 (L-mito) lists the respective distribution of each molecular species in L-mito, expressed as the mean of its relative values (mol %) in the three independent experiments also used for proteomics. Column 4 lists the mean distribution of both sample types, and column 5 (Log2(FC)) lists the binary logarithm of fold change. Binary logarithm was applied when the mean values are higher than 0.5 to inspect the FC between L-mito and L-TE. The heat map colors represent mean intensity values according to the color map on the low left-hand side. *, ** indicate P values <0.05 and <0.01, respectively, by Student's t-test. LCB, long-chain base; LCB-P, long chain base-phosphate; Cer, ceramide; GlcCer, glycosylceramide; GIPC, glycosyl inositol phosphoceramide.
Figure 6
Figure 6
Profiles of the distribution and fold changes (FC) of the molecular sterol species between total extracts and mitochondrial fractions isolated from Arabidopsis leaves (L-mito and L-TE). Heat map visualizations of (A) free sterols, (B) steryl glycosides (SG), and (C) acylated steryl glycosides (ASG), and steryl esters (SE) illustrate the difference of species distribution based on liquid chromatography tandem mass spectrometry (LC–MS/MS) analyses. Each lipid class is represented by one set of joined columns. Identity of columns in each set from left to right: Column 1 lists the individual lipid class and the identity of the detected molecular lipid species. Column 2 (L-TE) lists the respective distribution of each molecular species in L-TE, expressed as the mean of its relative values (mol %) in the three independent experiments also used for proteomics and for glycerolipid and sphingolipid analysis (Figures 1, 3 and 5; Supplemental Table 1). Column 3 (L-mito) lists the respective distribution of each molecular species in L-mito, expressed as the mean of its relative values (mol %) in the three independent experiments also used for proteomics. Column 4 lists the mean distribution of both sample types, and column 5 (Log2(FC)) lists the binary logarithm of fold change. The heat map colors represent mean intensity values according to the color map on the low left-hand side. Binary logarithm was applied when the mean values are higher than 0.5 to inspect the FC between L-mito and L-TE. *, ** indicate P values <0.05 and <0.01, respectively, by Student’s t-test.
Figure 7
Figure 7
Mitochondrial transmembrane lipoprotein (MTL) complex-associated proteins in mitochondria. Our proteomic analyses covered 186 of the 214 hypothetical subunits in the MTL complex (listed in Supplemental Table 4); 11 have been investigated by immunoblotting approaches in previous studies. Heat maps visualize the protein abundance of three independent experiments of mitochondria purified from leaves and cell cultures. The heat map colors represent mean intensity values according to the color map on the low right-hand side. The absolute values represented by each color map are deposited in Supplemental Table 1. OM, mitochondrial outer membrane; IM, mitochondrial inner membrane; DGDG, digalactosyldiacylglycerol; PE, phosphatidylethanolamine.
Figure 8
Figure 8
Identified plastid outer envelope proteins in mitochondrial extracts isolated from Arabidopsis leaves (L-mito) and cell cultures (C-mito). Our proteomic analyses identified 10 outer envelope-localized proteins (listed in Supplemental Table 5). Heat maps visualize the protein abundance within the three independent experiments of mitochondria purified from leaves and cell cultures. The heat map colors represent the individual mean intensity values for each protein according to the color map on the low right-hand side. The corresponding iBAQ values as determined in MaxQuant are listed in Supplemental Table 1.
Figure 9
Figure 9
Model of lipid biosynthesis and trafficking within and between mitochondria, endoplasmic reticulum (ER) and plastids in Arabidopsis. Lipid synthesis and transfer between membranes are indicated by arrows, respectively. Proteins identified in mitochondrial extracts isolated from Arabidopsis leaves (L-mito) or cell cultures (C-mito) with additional ER or plastidic localization based on The Arabidopsis Information Resource (TAIR; www.arabidopsis.org) and the Subcellular localization database for Arabidopsis proteins (SUBAcon; www.suba.live) are considered as putative contact-site localized proteins (dashed frame). Lipid biosynthesis-related proteins indicated in other studies are depicted in grey. Full names and functions of involved proteins are itemized in Supplemental Table 1. ER, endoplasmic reticulum; OM, mitochondrial outer membrane; IM, mitochondrial inner membrane; OE, plastid outer envelope; IE, plastid inner envelope; MTL, mitochondrial transmembrane lipoprotein complex; AAPT, aminoalcoholphosphotransferase; CL, cardiolipin; CLS, cardiolipin synthase; LCLAT, monolysocardiolipin acyltransferase; DHAP, dihydroxyacetone phosphate; G3P, glyceraldehyde 3-phosphate; GPAT, glyceraldehyde 3-phosphate acyltransferase; GPDH, glycerol-3-phosphate dehydrogenase; MAG, monoacylglycerol; MAG-3P, monoacylglycerol 3-phosphate; DAG, diacylglycerol; DAG-3P, diacylglycerol 3-phosphate; DWF, dwarf; DGS, digalactosyldiacylglycerol synthase suppressor; Etn, ethanolamine; TAG, triacylglycerol; IP, inositol phosphate; PC, phosphatidylcholine; MGD, monogalactosyldiacylglycerol synthase; MGDG, monogalactosyldiacylglycerol; Mic, mitochondrial contact site and cristae organizing system; DGD, digalactosyldiacylglycerol synthase; DGDG, digalactosyldiacylglycerol; PA, phosphatidic acid; PE, phosphatidylethanolamine; PECT, phosphoethanolamine cytidylyltransferase; PS, phosphatidylserine; PI, phosphatidylinositol; PG, phosphatidylglycerol; PGP, phosphatidylglycerolphosphate; PGP1, phosphatidylglycerolphosphate synthase 1; PGPP, phosphatidylglycerolphosphate phosphatase; PLC, phospholipase C; PLD, phospholipase D; PSD, phosphatidylserine decarboxylase; SAL, myo-inositol polyphosphate 1-phosphatase; SDP, sugar-dependent; SQD, sulfoquinovosyldiacylglycerol synthase; SQDG, sulfoquinovosyldiacylglycerol; Tom, translocase of the outer mitochondrial membrane.

Similar articles

Cited by

References

    1. Achleitner G, Gaigg B, Krasser A, Kainersdorfer E, Kohlwein SD, Perktold A, Zellnig G, Daum G (1999) Association between the endoplasmic reticulum and mitochondria of yeast facilitates interorganelle transport of phospholipids through membrane contact. Eur J Biochem 264(2): 545–553 - PubMed
    1. Alcázar-Román AR, Wente SR (2008) Inositol polyphosphates: a new frontier for regulating gene expression. Chromosoma 117(1): 1–13 - PubMed
    1. Ali U, Li H, Wang X, Guo L (2018) Emerging roles of sphingolipid signaling in plant response to biotic and abiotic stresses. Mol Plant 11(11): 1328–1343 - PubMed
    1. Awai K, Xu C, Tamot B, Benning C (2006) A phosphatidic acid-binding protein of the chloroplast inner envelope membrane involved in lipid trafficking. Proc Natl Acad Sci U S A 103(28): 10817–10822 - PMC - PubMed
    1. Babiychuk E, Müller F, Eubel H, Braun H-P, Frentzen M, Kushnir S (2003) Arabidopsis phosphatidylglycerophosphate synthase 1 is essential for chloroplast differentiation, but is dispensable for mitochondrial function. Plant J 33(5): 899–909 - PubMed

Publication types