. 2023 Jan 7;9(1):e12820.
doi: 10.1016/j.heliyon.2023.e12820. eCollection 2023 Jan.

Hypoxia-Induced Autophagy Is Involved in Radioresistance via HIF1A-Associated Beclin-1 in Glioblastoma Multiforme

Affiliations

Hypoxia-Induced Autophagy Is Involved in Radioresistance via HIF1A-Associated Beclin-1 in Glioblastoma Multiforme

Jielin Wei et al. Heliyon. .

Abstract

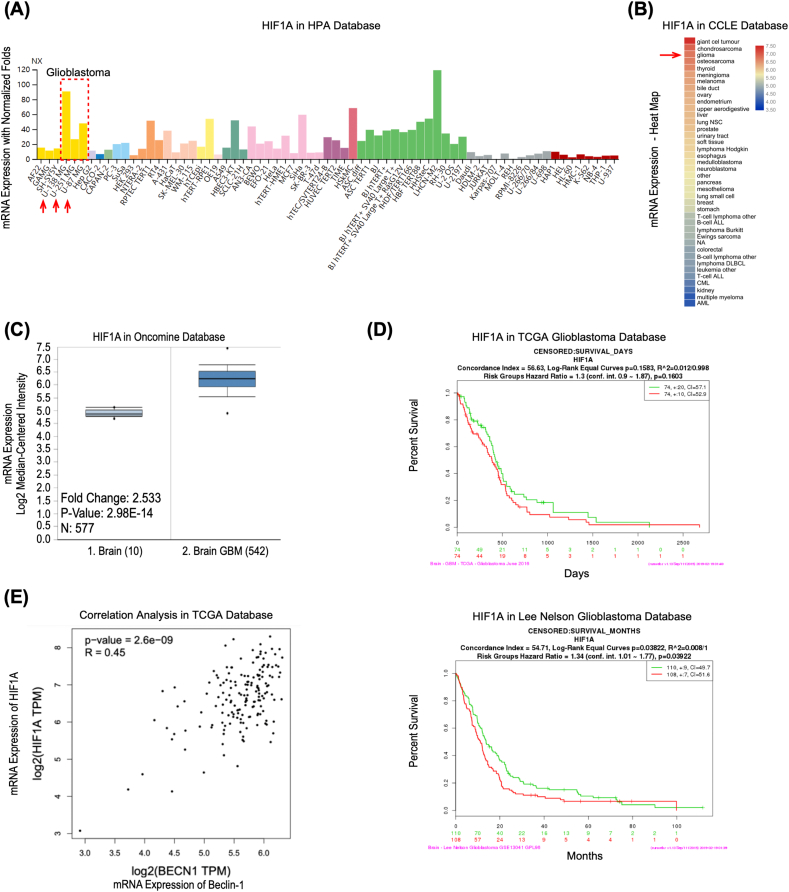
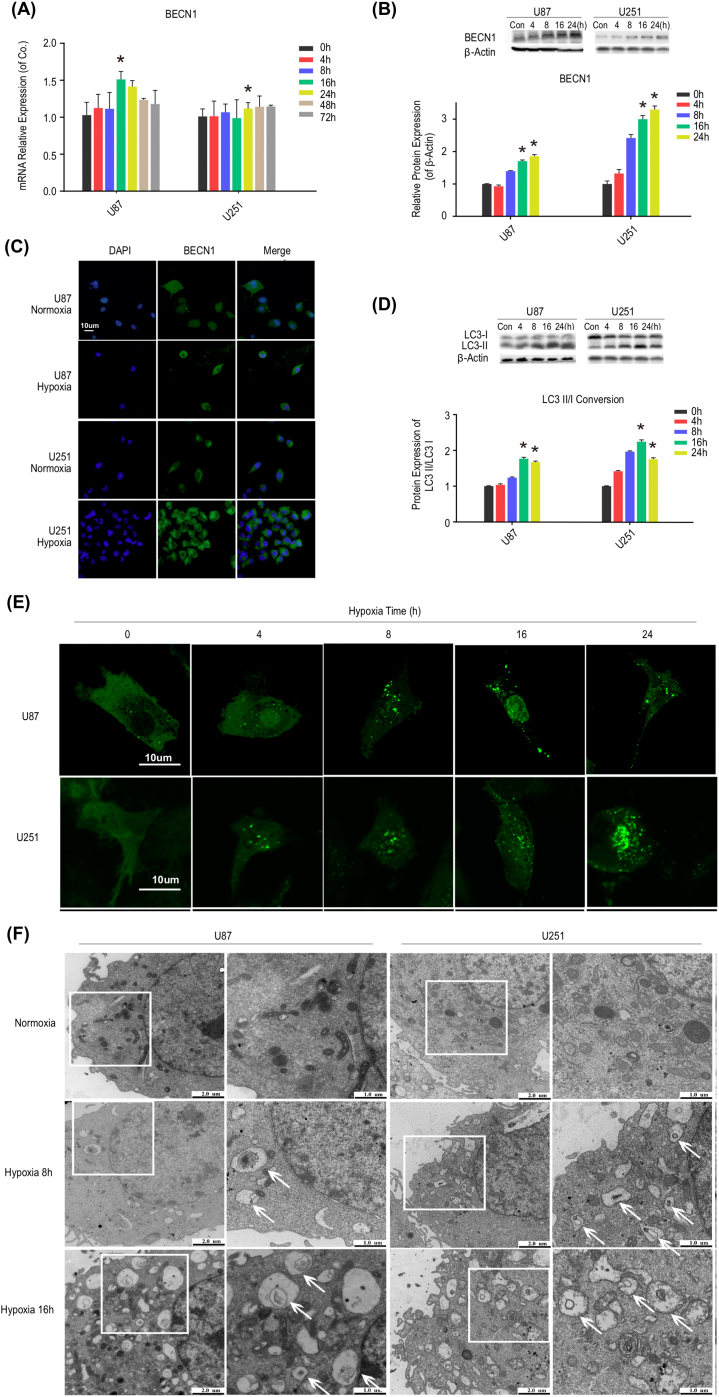
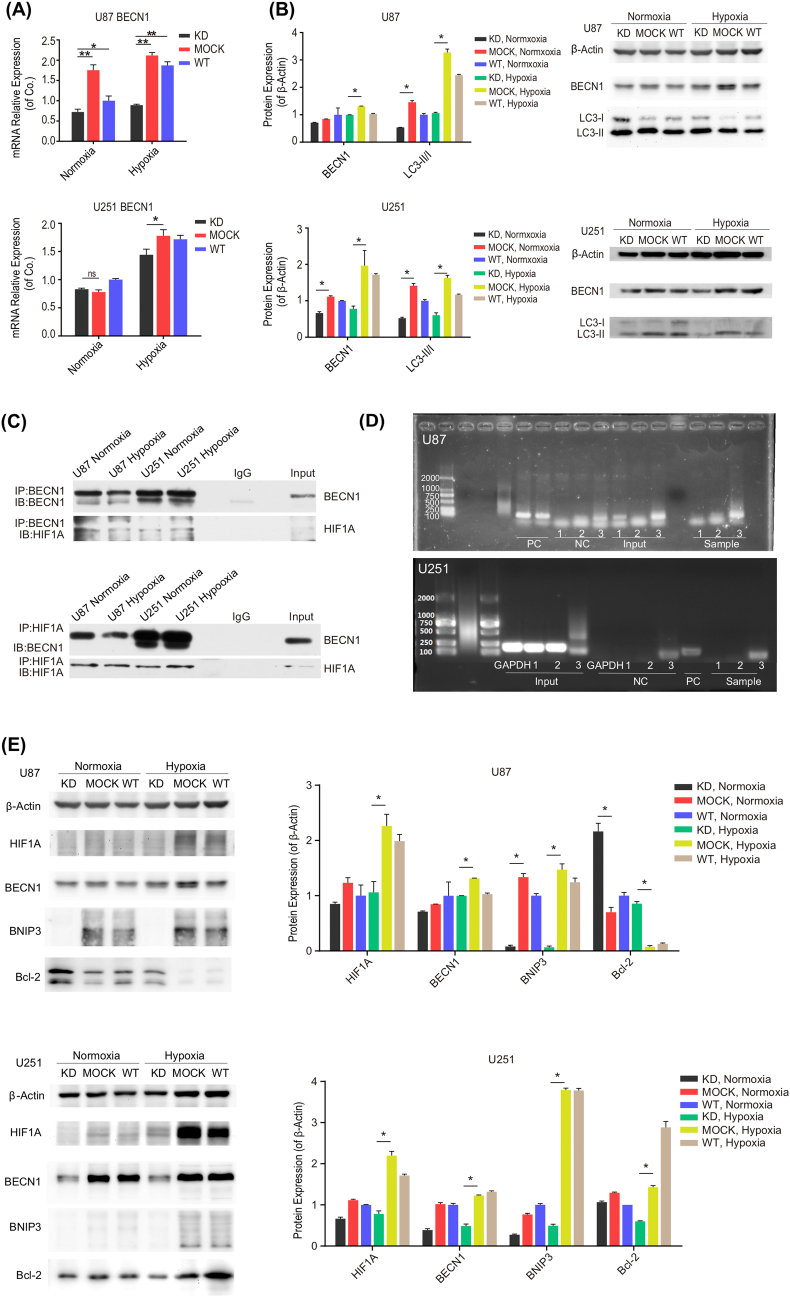
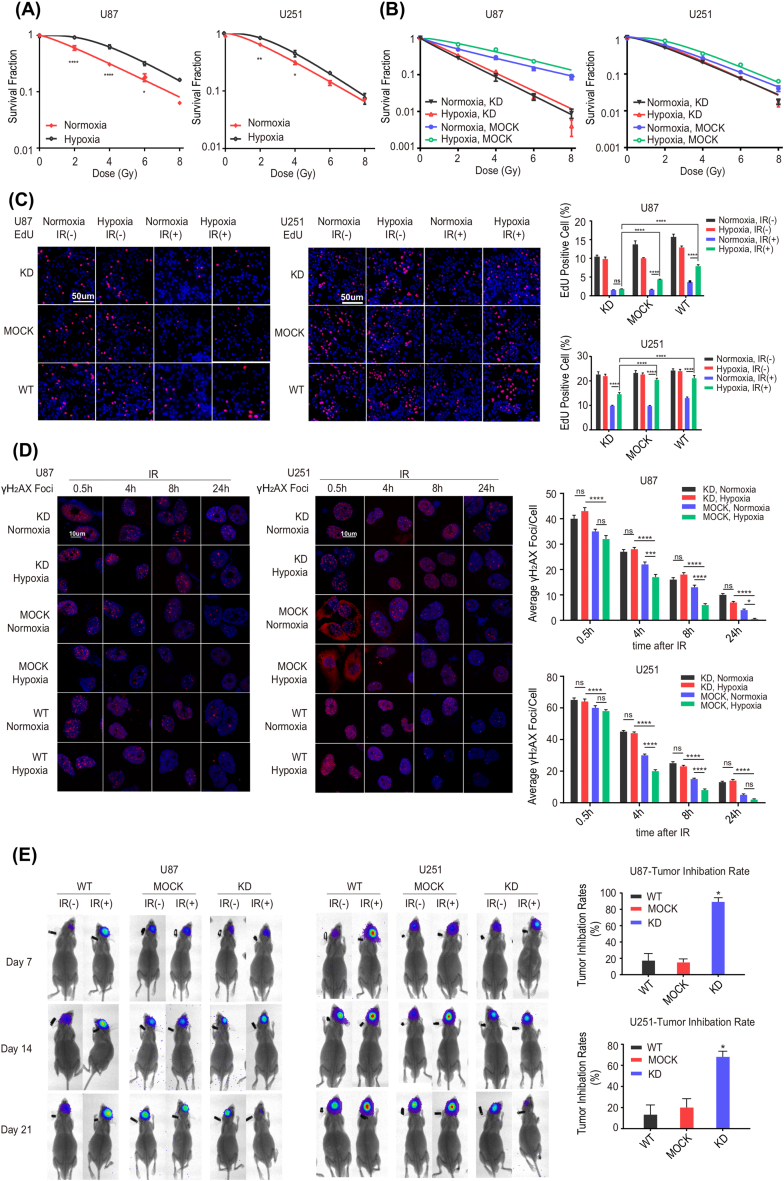
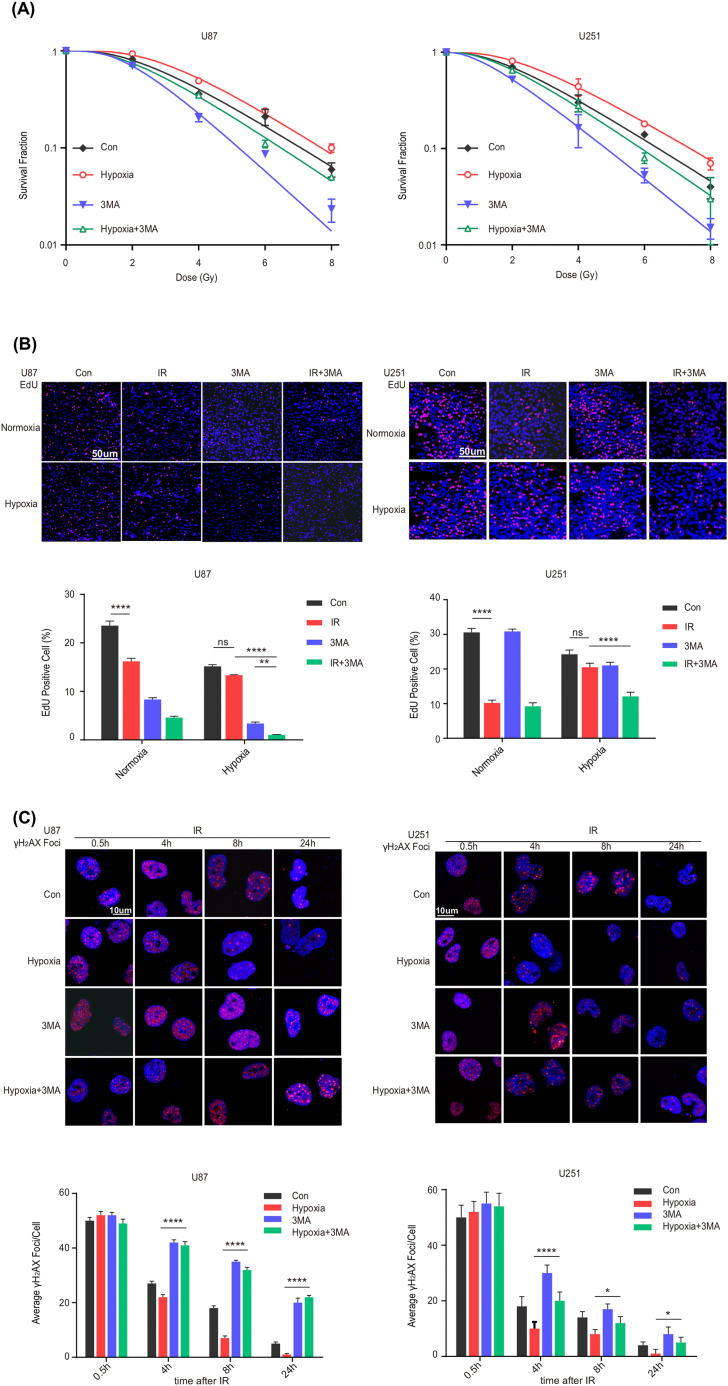
Radioresistance is the major factor of glioblastoma multiforme (GBM) treatment failure and relapse. Hypoxia and autophagy are linked to radioresistance and poor prognosis in solid tumors, but mechanisms remain unknown. Thus, we hypothesize that hypoxia may activate autophagy through two critical factors, HIF1A and Beclin-1, resulting in radioresistance of GBM in vitro and in vivo. In this study, we first demonstrated that HIF1A was overexpressed in GBM tissues and predicted a poor prognosis via bioinformatics. Secondly, we determined that hypoxia induced high expression of HIF1A and upregulated levels of Beclin-1 and autophagy, while HIF1A knockdown by shRNA reduced the expression of Beclin-1. Then we revealed the crosstalk and mechanisms of HIF1A-associated-Beclin-1 in three aspects: (a) transcriptional regulation, (b) protein interaction, and (c) HIF1A/BNIP3/Beclin-1 signaling pathway. Furthermore, we confirmed that silencing HIF1A enhanced the radiosensitivity of GBM in vitro and in vivo. Additionally, Beclin-1 suppression by 3-MA could reverse radioresistance induced by HIF1A under hypoxia. In conclusion, we demonstrated that hypoxia triggered autophagy via HIF1A-associated Beclin-1, resulting in radioresistance in GBM. HIF1A knockdown improved GBM radiosensitivity, and silencing Beclin-1 could reverse HIF1A-induced radioresistance under hypoxic conditions. These findings may help us comprehend the molecular underpinnings of hypoxia-induced autophagy and provide a novel perspective and prospective treatment for GBM radiosensitization.

Keywords: Autophagy; Beclin-1; Hypoxia; Hypoxia-inducible factor 1 alpha (HIF1A); Radiotherapy.


Conflict of interest statement

The authors declare that the research was conducted in the absence of any commercial or financial relationships that could be construed as a potential conflict of interest.

Figures

Figure 1
Figure 1
HIF1A is overexpressed in GBM and predicts an adverse prognosis. (A) The mRNA expression level of HIF1A in different cell lines based on normalized RNA sequencing data on the Human Protein Atlas (HPA) database. https://www.proteinatlas.org. NX: Normalized expression, the expression level of gene–specific transcripts is given as normalized expression (NX) values, and transcripts with NX values ≥1 are considered as detected. The dotted box and red arrows indicate the Glioblastoma cell lines. (B) Heat map of the HIF1A mRNA expression level in various tissues based on the data in Cancer Cell Line Encyclopedia (CCLE). https://www.broadinstitute.org/ccle/home. GraphPad Prism plotted the heat map. The red arrow indicates the normalized mean value of mRNA expression in glioma tissue datasets. (C) HIF1A mRNA expression was significantly increased in brain glioblastoma tissue compared with normal brain tissue, as revealed by Oncomine data mining analysis (in the reporter 200,989 at probe set in the TCGA brain dataset). https://www.oncomine.org. (D) Multivariate Cox regression analysis of HIF1A gene expression and Kaplan–Meier survival curves for overall survival outcomes in the TCGA glioblastoma and Lee Nelson study datasets (The red and green lines correspondingly indicate a gene expression level above and below the median). https://cancergenome.nih.gov. (E) Correlation Analysis between HIF1A and Beclin–1 in the transcriptional level of clinical samples in TCGA GBM Tumor database, visualized by GEPIA website. https://gepia.cancer-pku.cn; TPM: transcripts per million, a normalized unit to measure the transcript coding gene expression.
Figure 2
Figure 2
Hypoxia upregulates levels of Beclin–1 and autophagy. (A) The relative expression of Beclin–1 mRNA in GBM cells (U87 and U251) after exposure to hypoxia for 0, 4, 8, 16, 24, 48, and 72 h. Hypoxia for 16 or 24 h induced temporary upregulation of Beclin–1 mRNA expression in cells. BECN1: Beclin–1. *P < 0.05 compared with control cells (hypoxia for 0h). (B) The protein expression of Beclin–1 was increased after exposure to hypoxia for both 16 and 24 h. Left panel: Western blot analysis of Beclin–1 protein. Right panel: Quantification of the relative protein expression of Beclin–1. β–Actin was amplified for internal normalization. Con: control. *P < 0.05 compared with control cells. (C) Cells were incubated under normoxia and hypoxia for 16 h, and Beclin–1 staining was then visualized using fluorescence microscopy to detect its protein expression and localization. (D) Hypoxia induced the conversion of LC3–I to LC3–II. Left panel: Western blot analysis of LC3–I and LC3–II protein. Right panel: Quantification of the protein LC3–II/I conversion. *P < 0.05 compared with control cells. (E) Granular LC3–GFP puncta aggregated as the hypoxia time increased. Cells were transfected with GFP–LC3 and incubated under hypoxia for 0, 4, 8, 16, and 24 h. GFP–LC3 staining was visualized using confocal laser scanning fluorescence microscopy. (F) Hypoxia induced the accumulation of autophagosomes. Cells were incubated under hypoxia for 8 and 16 h, and autophagosomes were visualized by transmission electron microscopy.
Figure 3
Figure 3
HIF1A silencing downregulated Beclin–1 expression with multi–crosstalks behind. (A) Beclin–1 mRNA expression was downregulated when HIF1A was knocked down in U87 and U251. The relative expression of Beclin–1 mRNA was detected by qRT–PCR after exposure to normoxia and hypoxia for 16 h in KD, MOCK, and WT groups. KD: knock down; WT: wildtype. *P < 0.05, **P < 0.01 compared with MOCK, under normoxia or hypoxia; ns: no statistically significant difference (P > 0.05). (B) Beclin–1 protein expression was attenuated, and LC3–I to LC3–II conversion was suppressed in the HIF1A–KD group after exposure to normoxia and hypoxia for 16 h. Left panel: Quantification of Beclin–1 protein and LC3–II/I conversion. Right panel: Western blot analysis of Beclin–1, LC3–I, and LC3–II protein. *P < 0.05 compared with MOCK, under normoxia or hypoxia. (C) Endogenous HIF1A was coprecipitated in cells ectopically expressing Beclin–1 and vice versa. Coimmunoprecipitation experiments were performed in U87 and U251 cells after exposure to normoxia and hypoxia for 16 h. IP: immunoprecipitation; IB: immunoblotting. (D) Three pairs of primers were designed for potential binding sites in the Beclin–1 promoter. ChIP experiments were performed in U87 and U251 under hypoxia for 16 h. Bands were amplified for primers No. 1 and No. 3, in contrast to the Input and the negative control (NC). Furthermore, primer No. 3 successfully amplified specific bands in the experimental group compared to the Input of U87. However, all primers failed to amplify specific bands in U251. PC: positive control; NC: negative control. (E) BNIP3/Bcl–2 pathway components were evaluated after exposure to normoxia and hypoxia for 16 h. BNIP3 was downregulated when HIF1A was knocked down in U87 and U251, especially under hypoxic conditions. Bcl–2 expression was elevated in U87 HIF1A–KD group but decreased in U251 HIF1A–KD, compared with the corresponding MOCK groups. β–Actin was amplified for internal normalization. *P < 0.05 compared with MOCK cells, under normoxia or hypoxia.
Figure 4
Figure 4
HIF1A silencing enhances the radiosensitivity of GBM cellsin vitroandin vivo. (A) Hypoxia induced radioresistance of GBM cells. Colony formation after irradiation was significantly enhanced in hypoxia–exposed U87 and U251 cells. Colony formation assays were performed to evaluate the radiosensitivity of U87 and U251 after exposure to normoxia and hypoxia for 16h. The survival fraction curves were fitted by the multitarget one–click model equation SF=1–(1–e–D/D0) ^N. *P < 0.05, **P < 0.01, ****P < 0.0001 compared with normoxia cells, under the corresponding radiation doses. (B) Cellular proliferation was impaired, and radiosensitivity was enhanced in the HIF1A–KD group after exposure to normoxia and hypoxia for 16 h. Colony formation assays were performed in U87 and U251 incubated under normoxia or hypoxia for 16 h. (C) The proportion of EdU–positive cells was noticeably decreased in the HIF1A–KD group, especially under hypoxic conditions. Left panel: EdU incorporation was visualized using fluorescence microscopy after 24 h of X–ray irradiation (2Gy/1F). Right panel: quantification of EdU–positive cells. IR: irradiation. **P < 0.01, ****P < 0.0001. (D) The number of γ–H2AX foci was significantly increased in the KD group, especially under hypoxic conditions. Left panel: γ–H2AX foci were visualized using confocal laser scanning fluorescence microscopy after 0.5, 4, 8, and 24 h of X–ray irradiation (2Gy/1F). Right panel: quantification of γ–H2AX foci. * P < 0.05, ***P < 0.001, ****P < 0.0001. (E) In vivo, orthotopic glioblastoma xenografts were generated in nude mice, and brain tumors were measured weekly by in vivo fluorescence imaging. The tumor growth inhibition rates were calculated and were dramatically higher in the KD group than in MOCK and WT. *P < 0.0001 compared with MOCK and WT.
Figure 5
Figure 5
Beclin–1 suppression by 3–MA reverses radioresistance induced by HIF1A under hypoxia. (A) The survival rate was reduced and radiosensitivity was enhanced when Beclin–1 was suppressed by 3–MA, especially under hypoxic conditions. Colony formation assays were performed in U87 and U251 under normoxia or hypoxia for 16 h. Con: control. (B) The proportion of EdU–stained cells was noticeably decreased when Beclin–1 was suppressed by 3–MA, especially under hypoxic conditions. Upper panel: EdU incorporation was visualized using fluorescence microscopy after 24 h of X–ray irradiation (2Gy/1F). Lower panel: quantification of EdU–positive cells. **P < 0.01, ****P < 0.0001. (C) The number of γ–H2AX foci was significantly increased when Beclin–1 was suppressed by 3–MA, especially under hypoxic conditions. Upper panel: γ–H2AX foci were visualized using confocal laser scanning fluorescence microscopy after 0.5, 4, 8, and 24 h of X–ray irradiation (2Gy/1F). Lower panel: quantification of γ–H2AX foci. * P < 0.05, ****P < 0.0001.

References

    1. Bleeker F.E., Molenaar R.J., Leenstra S. Recent advances in the molecular understanding of glioblastoma. J. Neurooncol. 2012;108(1):11–27. doi: 10.1007/s11060–011–0793–0. - DOI - PMC - PubMed
    1. Young R.M., Jamshidi A., Davis G., Sherman J.H. Current trends in the surgical management and treatment of adult glioblastoma. Ann. Transl. Med. 2015;3(9):121. doi: 10.3978/j.issn.2305–5839.2015.05.10. - DOI - PMC - PubMed
    1. Nabors L.B., Portnow J., Ahluwalia M., Baehring J., Brem H., Brem S., et al. Central nervous system cancers, version 3.2020, NCCN clinical practice guidelines in oncology. J. Natl. Compr. Cancer Netw. 2020;18(11):1537–1570. doi: 10.6004/jnccn.2020.0052. - DOI - PubMed
    1. Stupp R., Mason W.P., van den Bent M.J., Weller M., Fisher B., Taphoorn M.J., et al. Radiotherapy plus concomitant and adjuvant temozolomide for glioblastoma. N. Engl. J. Med. 2005;352(10):987–996. doi: 10.1056/NEJMoa043330. - DOI - PubMed
    1. Perry J.R., Laperriere N., O’Callaghan C.J., Brandes A.A., Menten J., Phillips C., et al. Short–course radiation plus Temozolomide in elderly patients with glioblastoma. N. Engl. J. Med. 2017;376(11):1027–1037. doi: 10.1056/NEJMoa1611977. - DOI - PubMed

LinkOut - more resources