

Automated Detection of Posterior Vitreous Detachment on OCT Using Computer Vision and Deep Learning Algorithms
- PMID: 36691594
- PMCID: PMC9860346
- DOI: 10.1016/j.xops.2022.100254
Automated Detection of Posterior Vitreous Detachment on OCT Using Computer Vision and Deep Learning Algorithms
Abstract
Objective: To develop automated algorithms for the detection of posterior vitreous detachment (PVD) using OCT imaging.
Design: Evaluation of a diagnostic test or technology.
Subjects: Overall, 42 385 consecutive OCT images (865 volumetric OCT scans) obtained with Heidelberg Spectralis from 865 eyes from 464 patients at an academic retina clinic between October 2020 and December 2021 were retrospectively reviewed.
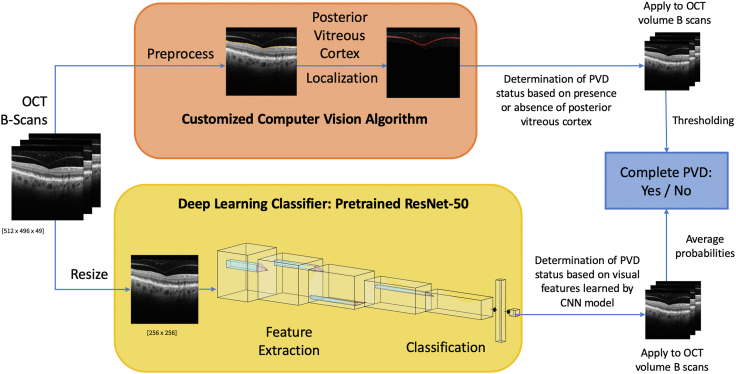
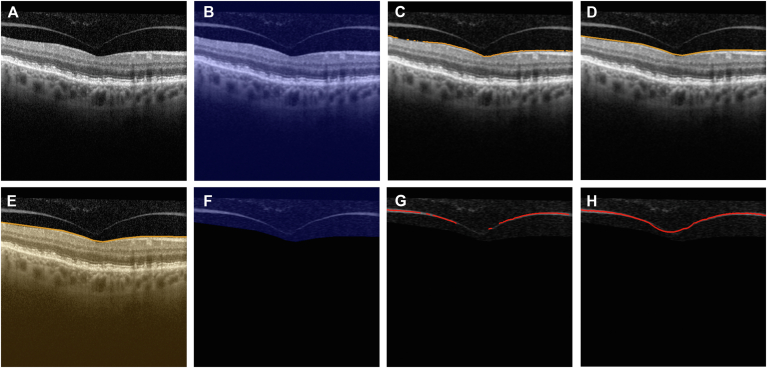
Methods: We developed a customized computer vision algorithm based on image filtering and edge detection to detect the posterior vitreous cortex for the determination of PVD status. A second deep learning (DL) image classification model based on convolutional neural networks and ResNet-50 architecture was also trained to identify PVD status from OCT images. The training dataset consisted of 674 OCT volume scans (33 026 OCT images), while the validation testing set consisted of 73 OCT volume scans (3577 OCT images). Overall, 118 OCT volume scans (5782 OCT images) were used as a separate external testing dataset.
Main outcome measures: Accuracy, sensitivity, specificity, F1-scores, and area under the receiver operator characteristic curves (AUROCs) were measured to assess the performance of the automated algorithms.
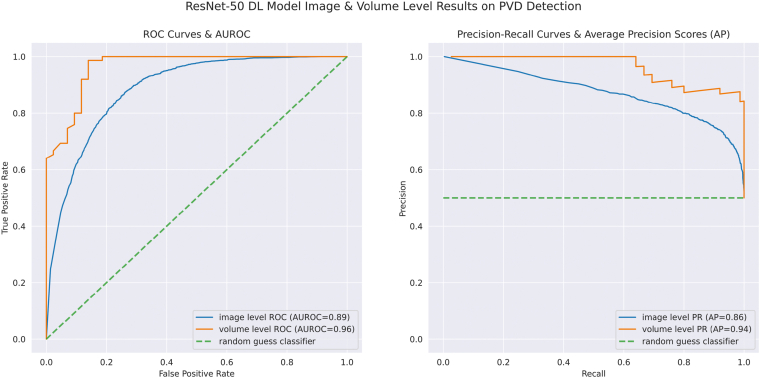
Results: Both the customized computer vision algorithm and DL model results were largely in agreement with the PVD status labeled by trained graders. The DL approach achieved an accuracy of 90.7% and an F1-score of 0.932 with a sensitivity of 100% and a specificity of 74.5% for PVD detection from an OCT volume scan. The AUROC was 89% at the image level and 96% at the volume level for the DL model. The customized computer vision algorithm attained an accuracy of 89.5% and an F1-score of 0.912 with a sensitivity of 91.9% and a specificity of 86.1% on the same task.
Conclusions: Both the computer vision algorithm and the DL model applied on OCT imaging enabled reliable detection of PVD status, demonstrating the potential for OCT-based automated PVD status classification to assist with vitreoretinal surgical planning.
Financial disclosures: Proprietary or commercial disclosure may be found after the references.
Keywords: AI, artificial intelligence; AUROC, area under the receiver operator characteristic curve; Automated detection; CNN, convolutional neural network; DL, deep learning; Deep Learning; ILM, internal limiting membrane; OCT; PVD, posterior vitreous detachment; Posterior vitreous detachment; ViT, vision transformers.
© 2022 Published by Elsevier Inc. on behalf of American Academy of Ophthalmology.
Figures
Similar articles
-
Detection of Nonexudative Macular Neovascularization on Structural OCT Images Using Vision Transformers.Ophthalmol Sci. 2022 Jul 8;2(4):100197. doi: 10.1016/j.xops.2022.100197. eCollection 2022 Dec. Ophthalmol Sci. 2022. PMID: 36531577 Free PMC article.
-
Standard 6-mm Compared with Widefield 16.5-mm OCT for Staging of Posterior Vitreous Detachment.Ophthalmol Retina. 2020 Nov;4(11):1093-1102. doi: 10.1016/j.oret.2020.05.006. Epub 2020 May 19. Ophthalmol Retina. 2020. PMID: 32442535
-
OCT-based deep learning algorithm for the evaluation of treatment indication with anti-vascular endothelial growth factor medications.Graefes Arch Clin Exp Ophthalmol. 2018 Jan;256(1):91-98. doi: 10.1007/s00417-017-3839-y. Epub 2017 Nov 10. Graefes Arch Clin Exp Ophthalmol. 2018. PMID: 29127485
-
Using AI for Detection, Prediction and Classification of Retinal Detachment.Stud Health Technol Inform. 2023 Jun 29;305:636-639. doi: 10.3233/SHTI230578. Stud Health Technol Inform. 2023. PMID: 37387112 Review.
-
A Systematic Review of the Applications of Deep Learning for the Interpretation of Positron Emission Tomography Images of Patients with Lymphoma.Cancers (Basel). 2024 Dec 29;17(1):69. doi: 10.3390/cancers17010069. Cancers (Basel). 2024. PMID: 39796698 Free PMC article. Review.
Cited by
-
Inter-rater reliability in labeling quality and pathological features of retinal OCT scans: A customized annotation software approach.PLoS One. 2024 Dec 18;19(12):e0314707. doi: 10.1371/journal.pone.0314707. eCollection 2024. PLoS One. 2024. PMID: 39693322 Free PMC article.
-
The role of artificial intelligence in the diagnosis of diabetic retinopathy through retinal lesion features: a narrative review.Quant Imaging Med Surg. 2025 May 1;15(5):4816-4846. doi: 10.21037/qims-24-1791. Epub 2025 Apr 16. Quant Imaging Med Surg. 2025. PMID: 40384679 Free PMC article. Review.
-
Multi-Dataset Comparison of Vision Transformers and Convolutional Neural Networks for Detecting Glaucomatous Optic Neuropathy from Fundus Photographs.Bioengineering (Basel). 2023 Oct 30;10(11):1266. doi: 10.3390/bioengineering10111266. Bioengineering (Basel). 2023. PMID: 38002390 Free PMC article.
-
Vision transformers: The next frontier for deep learning-based ophthalmic image analysis.Saudi J Ophthalmol. 2023 Jul 14;37(3):173-178. doi: 10.4103/sjopt.sjopt_91_23. eCollection 2023 Jul-Sep. Saudi J Ophthalmol. 2023. PMID: 38074310 Free PMC article.
-
RobOCTNet: Robotics and Deep Learning for Referable Posterior Segment Pathology Detection in an Emergency Department Population.Transl Vis Sci Technol. 2024 Mar 1;13(3):12. doi: 10.1167/tvst.13.3.12. Transl Vis Sci Technol. 2024. PMID: 38488431 Free PMC article.
References
-
- Abraham J.R., Ehlers J.P. Posterior vitreous detachment: methods for detection. Ophthalmol Retina. 2020;4:119–121. - PubMed
-
- Uchino E., Uemura A., Ohba N. Initial stages of posterior vitreous detachment in healthy eyes of older persons evaluated by optical coherence tomography. Arch Ophthalmol. 2001;119:1475–1479. - PubMed
-
- Seider M.I., Conell C., Melles R.B. Complications of acute posterior vitreous detachment. Ophthalmology. 2022;129:67–72. - PubMed
-
- Uhr J.H., Obeid A., Wibbelsman T.D., et al. Delayed retinal breaks and detachments after acute posterior vitreous detachment. Ophthalmology. 2020;127:516–522. - PubMed
