. 2022 Dec 5;26(1):105714.
doi: 10.1016/j.isci.2022.105714. eCollection 2023 Jan 20.

Digital twin demonstrates significance of biomechanical growth control in liver regeneration after partial hepatectomy

Affiliations

Digital twin demonstrates significance of biomechanical growth control in liver regeneration after partial hepatectomy

Stefan Hoehme et al. iScience. .

Abstract

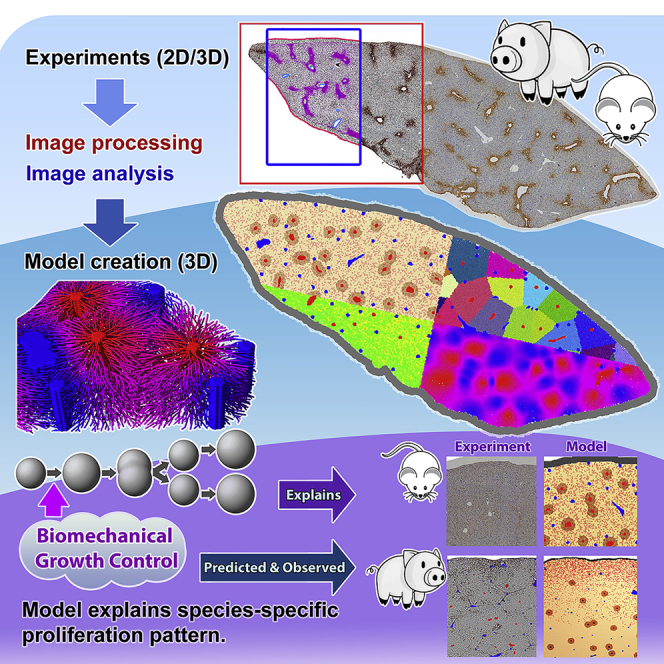
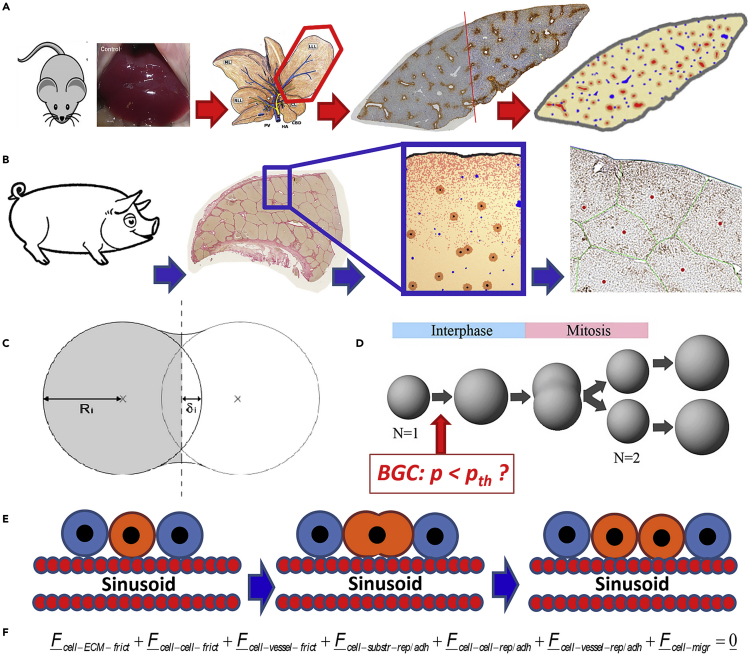
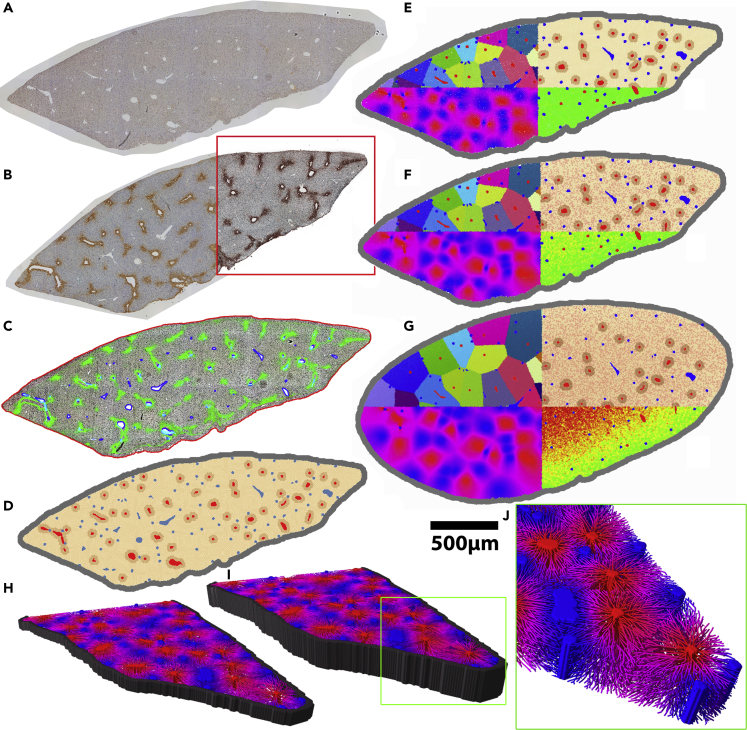
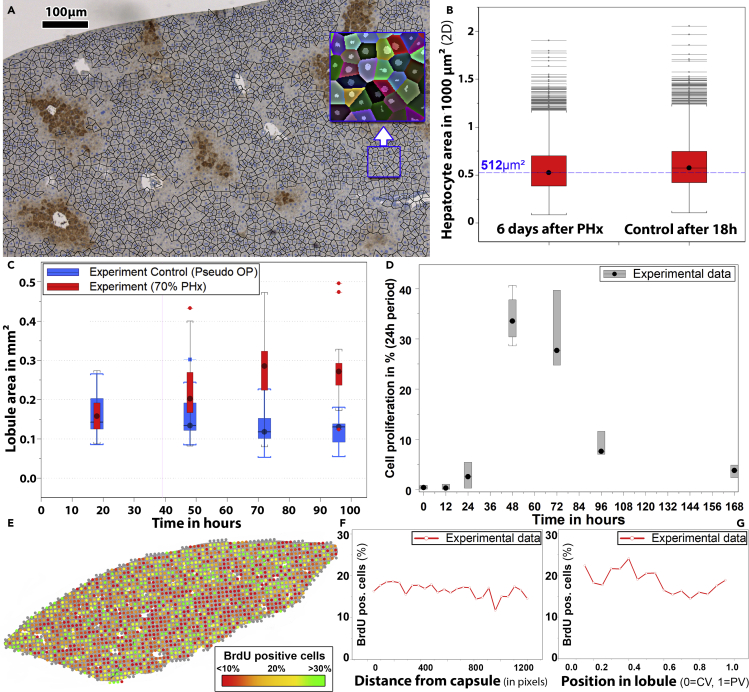
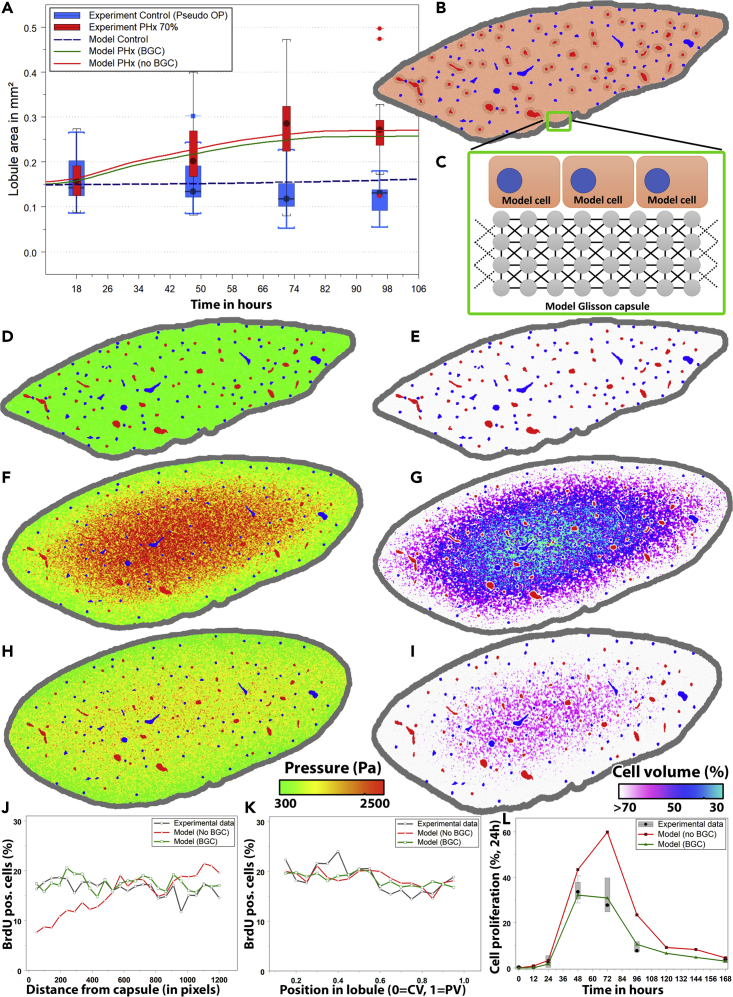
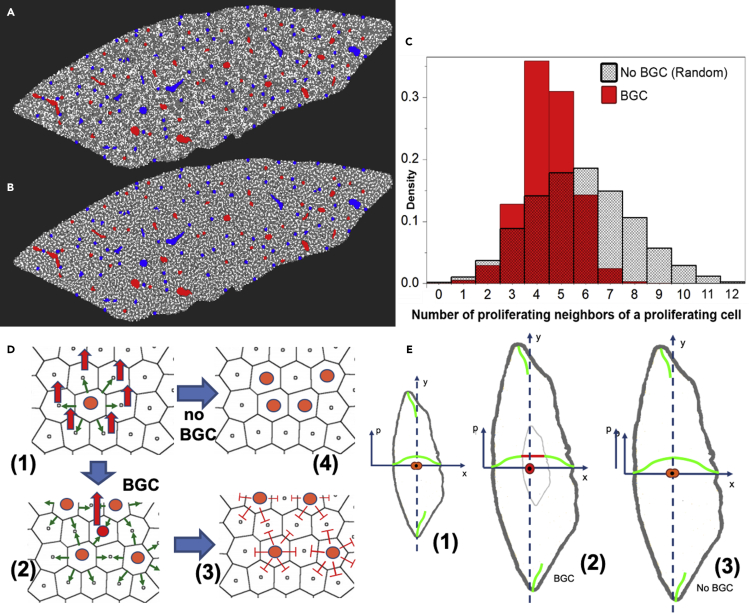
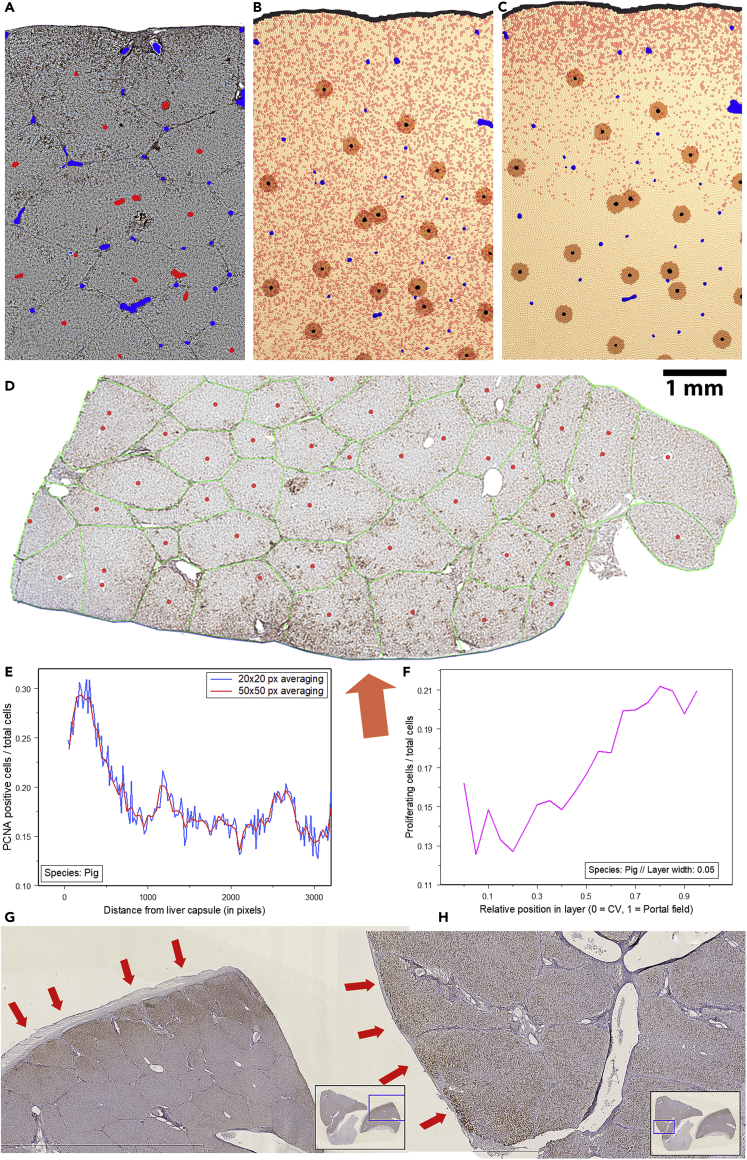
Partial liver removal is an important therapy option for liver cancer. In most patients within a few weeks, the liver is able to fully regenerate. In some patients, however, regeneration fails with often severe consequences. To better understand the control mechanisms of liver regeneration, experiments in mice were performed, guiding the creation of a spatiotemporal 3D model of the regenerating liver. The model represents cells and blood vessels within an entire liver lobe, a macroscopic liver subunit. The model could reproduce the experimental data only if a biomechanical growth control (BGC)-mechanism, inhibiting cell cycle entrance at high compression, was taken into account and predicted that BGC may act as a short-range growth inhibitor minimizing the number of proliferating neighbor cells of a proliferating cell, generating a checkerboard-like proliferation pattern. Model-predicted cell proliferation patterns in pigs and mice were found experimentally. The results underpin the importance of biomechanical aspects in liver growth control.

Keywords: Tissue engineering; mathematical biosciences; systems biology.


Conflict of interest statement

The authors declare no conflicts of interest.

Figures

None
Graphical abstract
Figure 1
Figure 1
Main components of the biophysical cell-based computational model and workflow of the article (A) Experimental data from the regeneration of liver lobules after partial hepatectomy in mice (removing part of the liver) have been used to calibrate a quantitative computational cell-based model of liver regeneration by a pipeline of imaging, image processing, and model development and simulation. (B) The computational model has been recalibrated with experimental data from pig and predictive simulations been performed on the regeneration scenario of a piece of pig tissue that includes the Glisson capsule. The simulated prediction has been confronted with a pilot experiment. (C) shows a sketch of two interacting cells for the definition of the indention δ and cell radius R i used to calculate the cell-cell interaction force. Each cell’s movement is calculated from all forces on that cell including active forces due to migration. (D) shows the implementation of cell growth in the interface by radius increase until cell volume doubled, and division by splitting. Biomechanical Growth Control (BGC) assumes that a cell does not enter the cell cycle if the pressure exerted on it exceeds a certain threshold value pth, while in absence of BGC such a constrained is absent. (2D sketch shown for simplicity; the model is 3D.). (E) Dividing cells align along the closest sinusoid, a mechanism we had named “HSA” (Hoehme et al., 2010). (F) The dynamics of cells have been simulated by solving a force balance equation for each cell and for each vessel element. Vessels have been mimicked in 3D as a chain of spheres connected by springs (details in text). The force balance equation for each cell includes friction forces between cells and extracellular matrix (including the Glisson capsule), among cells, of cells with vessel elements, as well as adhesion and repulsion forces between cells and substrate (here the Glisson capsule enclosing the liver lobe), among cells, and between cells and vessel elements, and finally an active force to mimic cell migration. Force balance for translational movement is complemented by cell rotations for which a Monte Carlo simulation scheme based on the total interaction energy for the entire system has been used.
Figure 2
Figure 2
Construction of a computational single-cell-based model from two whole slide scans of a liver lobe by an image processing and analysis chain (A) PCNA stained micrograph of a mouse liver lobe. (B) A neighboring slice stained for glutamine synthetase (GS). (C) Intermediate step in which the contrast of the micrographs was enhanced by contrast-limited adaptive histogram equalization (CLAHE). The localization of the capsule (red outline) and of larger vessels (blue/cyan) was determined. The effect of CLAHE is illustrated within the red rectangle in (B). GS permits distinguishing between central veins and portal veins or arteries. Each central vein of a liver lobule is circumvented by GS-positive hepatocytes. The green coloring shows the GS staining of (B) used to identify the central veins among the larger vessels in the image (red in (D)). (E–G) Growth simulation of a liver lobe. Time series of proliferating and growing lobe. (E) t = 0 days, (F) t = 2 days, (G) t = 5 days. (H–J) Exemplary 3D models automatically constructed from the dataset (A). (H-J) only differ in the height that is extrapolated from (A) (H: 3D with a height of 4 cell layers, I: 3D with a height of 10 cell layers). In (H–J) model cells were omitted to reveal the sinusoidal network. The coloring of the network in (H–J) illustrates the predicted oxygen concentration within the sinusoids (blue = high concentration in the portal field, red = low concentration near the central veins). All simulations were carried out for the whole lobe but only half of the lobe was visualized. (J) Magnified sinusoidal network within the lobe model. The sinusoids were not directly reconstructed from bright-field micrographs but are based on the statistical data obtained from the corresponding three-dimensional volume datasets obtained by confocal fluorescence microscopy (Hoehme et al., 2010).
Figure 3
Figure 3
Experimental parameters in regenerating liver tissue of mice (A) Representative DAPI and GS-stained bright-field micrograph. (B) A number of similar micrographs were used to study cell size distributions during regeneration after PHx. The blue line represents the model = 512 μm2. (C) Lobule size in control mice (blue) and mice that underwent PHx (red). The area of the lobules increased during regeneration by a factor of approximately two. Accordingly, the volume increased by about a factor of 3 as expected after 2/3 hepatectomy. (D) Kinetics of proliferation. (E) Bright-field micrograph with overlaid proliferation quantification averaged for square-shaped regions of 100 × 100 μm (one dot per region) within the lobe micrograph. The color of the dots represents the average fraction of proliferating cells within the corresponding region (green: >30% proliferating cells, red: <10% proliferating cells). (F and G) Distribution of BrdU-positive cells as a measure for proliferation within (F) the lobe, (G) the individual lobules.
Figure 4
Figure 4
Simulated liver lobule regeneration scenarios (A) Increase in liver lobule size comparing the model simulation to experimental data. (B) Model lobe architecture at t = 0 days (model initial state). (C–E) (C) Illustration of the model of the Glisson capsule (D) pressure and (E) cell volume visualization at t = 0. (F and G) (F) Pressure and (G) cell volume visualization at t = 4 days without BGC. (H and I) (H) Pressure and (I) cell volume visualization at t = 4 days with BGC enabled. Cell volume predictions were based on Voronoi space subdivision in the lobe model. Red = central veins, Blue = portal veins. Cell volume coloring: White: Cell volume of more than 70% of an isolated (uncompressed) cell, magenta: 50%, blue: 40%, cyan: 30% (see legend). Without BGC, the model shows unrealistically small cell volumes within the lobe. Pressure coloring: Green = Low pressure, Yellow = Intermediate, Red = High pressure. The compression in presence of BGC (H and I) is lower than in absence of BGC. Note also that in simulations with and without BGC the lobule shape is approximately conserved (i.e., mathematically “similar”) during lobe growth (compare E-G, E-I), while the borders are rounded off likely by the smoothing effect of the Glisson capsule. (J) Number of BrdU-positive cells by distance from capsule or (K) by position in lobule. (L) Cell proliferation per day by time after PHx.
Figure 5
Figure 5
Simulated spatial cell proliferation pattern in case cells enter the cell cycle (A–C) (A) randomly (proliferating cells in white) and (B) in the presence of BGC at time t = 3d (C) Corresponding frequency histograms for the number of proliferating cells in the vicinity of a proliferating cell for BGC (pressure-based) control of cell cycle entrance and for random entrance. (D) Illustration of mechanism. A cell entering the cell cycle (orange in (D, (1))) increases its volume (green arrows) hence increasing the pressure in its neighbor cells (indicated by the red arrows) and itself. In the presence of BGC, a cell (red in (D, (2))) surrounded by proliferating cells (orange in (D, (2))) experiences a high pressure, that, if the pressure exceeds a threshold value pth, will inhibit this cell to also enter the cell cycle. As a consequence, BGC acts as an inhibitor neighbor cell of proliferating cells favoring distance between proliferating cells (D, (3)). The result is a checkerboard-like proliferation pattern as in (B). With no BGC, cells would enter the cell cycle randomly, which can lead to locally much higher-pressure peaks (and compression forces) (D, (4)), resulting in the situation as in (A). (E) For sufficiently small liver lobules (E, (1)) the overall pressure can still remain under the threshold pressure of BGC (indicated by the green curves) hence all cells can divide, though inhibiting local pressure peaks by forming a checkerboard-like pattern at the cell scale, as the pressure can be released by the shift of the lobule border. A central dividing cell (orange in the center of the lobule in (E, (1))) can enter the cell cycle and push its neighbor cells toward the border, resulting after some time in a small displacement of the cells right at the Glisson capsule and release of the pressure at the position of the central dividing cell. The pressure is smallest at the lobe border (indicated by the green curves in (E)), as only by the expansion of the Glisson capsule, the lobe can gain volume. Beyond a certain lobule size the pressure release is not fast enough anymore (indicated by the light gray zone in which the red curve indicates the threshold pressure at which no cell cycle progression occurs anymore), hence a zone in the interior occurs in which the pressure gets so high that BGC does not permit proliferations anymore (indicated by the red cell in (E, (2)), unless each cell division would be balanced by a cell death event (which is not observed in liver regeneration). Without BGC, cell divisions would continue (E, (3)) leading to further increase in pressure, which is not observed. (Note that (E) is a schematic representation; in the simulations, the lobule shape during the regeneration simulation is approximately conserved (geometrically “similar”) with rounded-off borders probably arising by the smoothing effect of the Glisson capsule (see Figures 2 and 4)).
Figure 6
Figure 6
Simulated and experimentally found proliferation pattern in a pilot experiment in pig (A) Bright-field micrograph of pig liver t = 2 days after PHx (Red = Central veins detected by image processing and analysis, Blue = portal veins; height of sample: 3.5 mm, width: 2.5 mm). (B) Predicted proliferation scenario in pig during first proliferation wave (t = 1 day) and C) after t = 2 days. (D) PCNA stained micrograph (whole slide scan) of a part of a pig liver 14 days after PHx. Proliferation is mainly localized near the Glisson capsule (orange arrow). (E) (Lower left) Quantification of proliferation within the lobe in relation to the distance to the Glisson capsule. (F) Quantification of proliferation within the lobule shows increased periportal proliferation. (G and H) Proliferation pattern in further pig livers (2 days after PHx). This experimental data also indicates possible increased proliferation near the Glisson capsule (orange/red arrows).

Similar articles

Cited by

References

    1. Alessandri K., Sarangi B.R., Gurchenkov V.V., Sinha B., Kießling T.R., Fetler L., et al. Cellular capsules as a tool for multicellular spheroid production and for investigating the mechanics of tumor progression in vitro. Proc. Natl. Acad. Sci. USA. 2013;110:14843–14848. doi: 10.1073/pnas.1309482110. - DOI - PMC - PubMed
    1. Almet A.A., Maini P.K., Moulton D.E., Byrne H.M. Modeling perspectives on the intestinal crypt, a canonical system for growth, mechanics, and remodeling. Curr. Opin. Biomed. Eng. 2020;15:32–39.
    1. Ambrosi D., Preziosi L. Cell adhesion mechanisms and stress relaxation in the mechanics of tumours. Biomech. Model. Mechanobiol. 2009;8:397–413. doi: 10.1007/s10237-008-0145-y. - DOI - PubMed
    1. Ambrosi D., Preziosi L., Vitale G. The interplay between stress and growth in solid tumors. Mech. Res. Commun. 2012;42:87–91. doi: 10.1016/J.MECHRESCOM.2012.01.002. - DOI
    1. Anderson A.R.A., Chaplain M.A.J., Rejniak K.A., editors. Single-cell-based models in biology and medicine. Birkhäuser; 2007.

LinkOut - more resources