. 2022 Dec 30;26(1):105914.
doi: 10.1016/j.isci.2022.105914. eCollection 2023 Jan 20.

Graded spikes differentially signal neurotransmitter input in cerebrospinal fluid contacting neurons of the mouse spinal cord

Affiliations

Graded spikes differentially signal neurotransmitter input in cerebrospinal fluid contacting neurons of the mouse spinal cord

Emily Johnson et al. iScience. .

Abstract

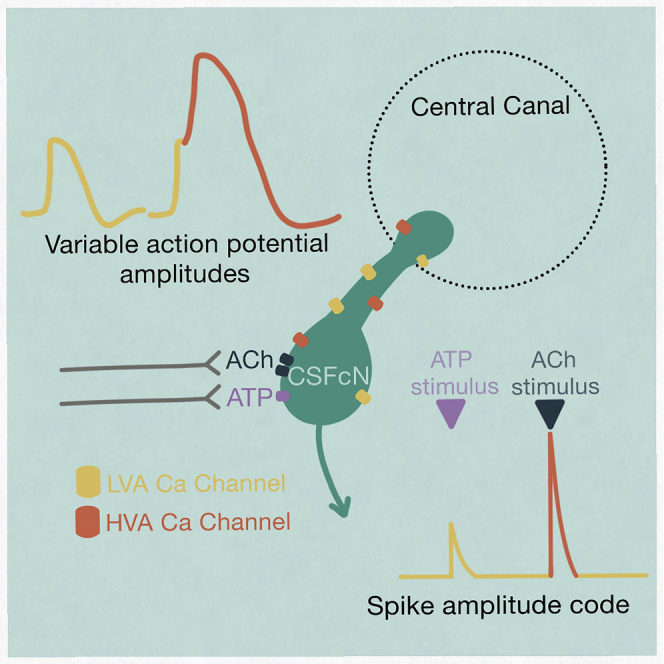
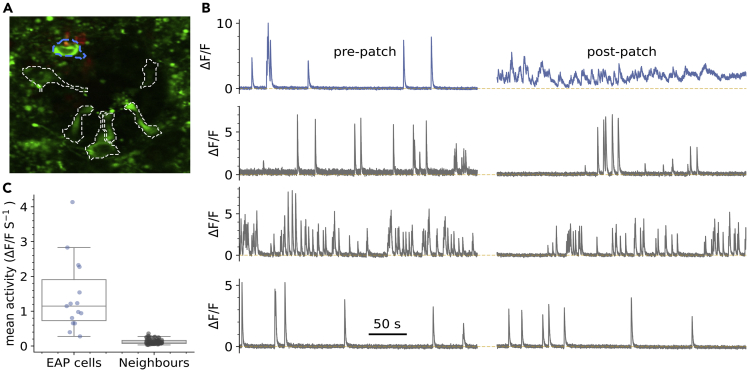
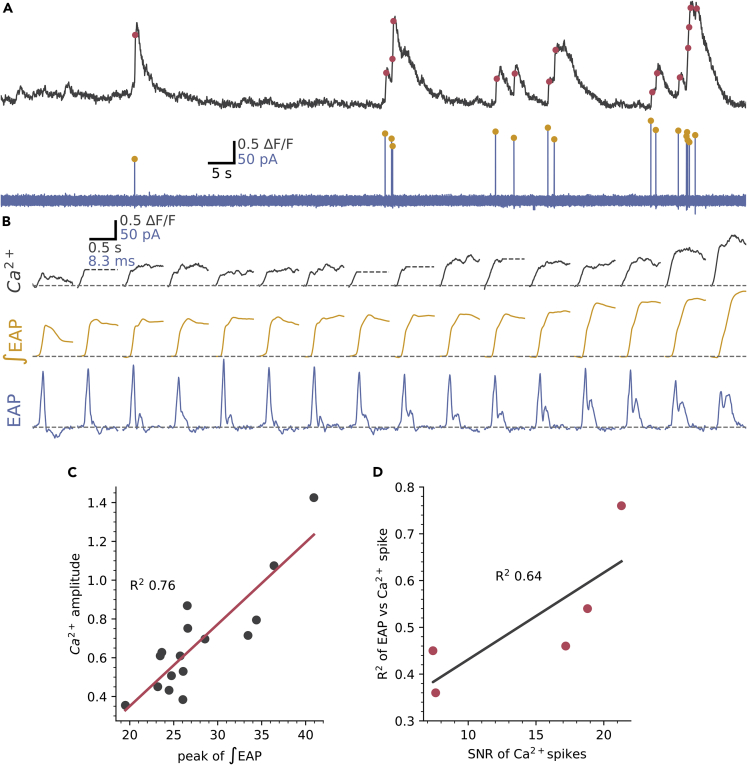
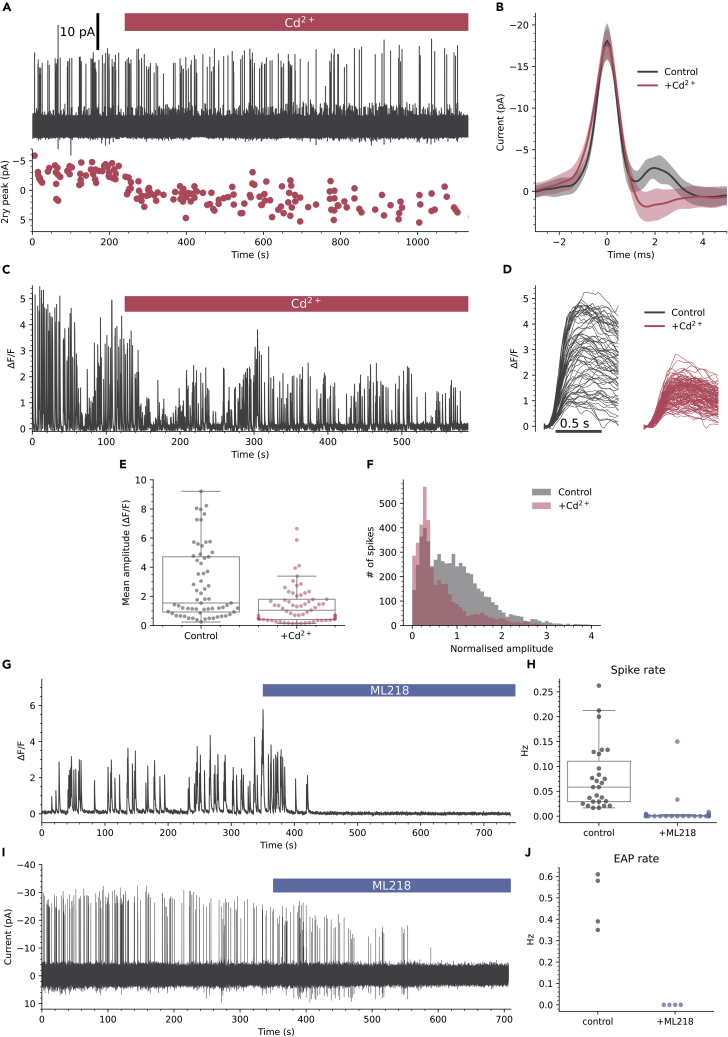
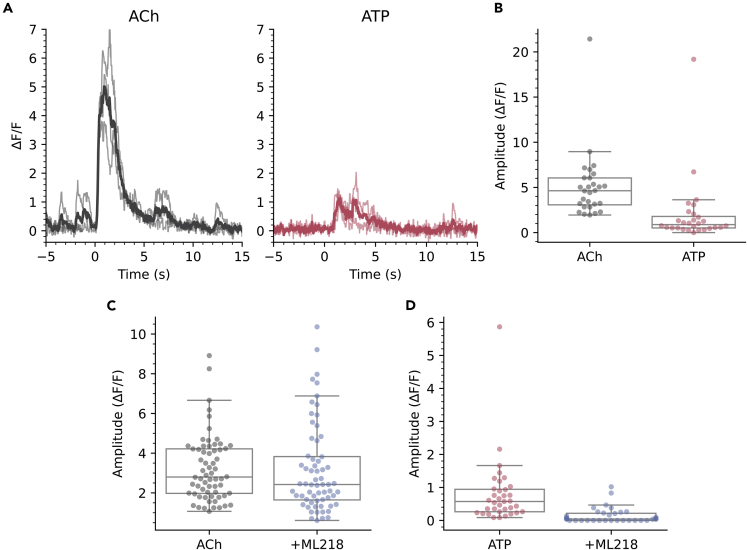
The action potential and its all-or-none nature is fundamental to neural communication. Canonically, the action potential is initiated once voltage-activated Na+ channels are activated, and their rapid kinetics of activation and inactivation give rise to the action potential's all-or-none nature. Here we demonstrate that cerebrospinal fluid contacting neurons (CSFcNs) surrounding the central canal of the mouse spinal cord employ a different strategy. Rather than using voltage-activated Na+ channels to generate binary spikes, CSFcNs use two different types of voltage-activated Ca2+ channel, enabling spikes of different amplitude. T-type Ca2+ channels generate small amplitude spikes, whereas larger amplitude spikes require high voltage-activated Cd2+-sensitive Ca2+ channels. We demonstrate that these different amplitude spikes can signal input from different transmitter systems; purinergic inputs evoke smaller T-type dependent spikes whereas cholinergic inputs evoke larger spikes that do not rely on T-type channels. Different synaptic inputs to CSFcNs can therefore be signaled by the spike amplitude.

Keywords: Cellular neuroscience; Molecular neuroscience; Systems neuroscience.


Conflict of interest statement

E.J. is currently employed by ApconiX. The authors declare no competing interests.

Figures

None
Graphical abstract
Figure 1
Figure 1
All PKD2L1 expressing CSFcNs are GABAergic left VGAT-GCaMP6 expression around the central canal of the spinal cord. Middle PKD2L1 expression in the same section. Right composite image showing 100% overlap between PKD2L1 and VGAT-GCaMP6. Dorsal side is at the top. Representative data from 6 animals, 12 sections per animal.
Figure 2
Figure 2
Spontaneous Ca2+ spikes in CSFcNs (A) Field of view containing CSFcNs showing segmentation of different CSFcNs. (B) Spontaneous activity of two example cells from A. (C) Spikes were detected on the differentiated trace (red) with an automatically determined threshold (see STAR Methods), gray arrows indicate amplitude measurements. (D and E) The parsed spikes from B, aligned to their onset E Amplitude histograms for the data in D. (F) Spontaneous spike rates from 127 CSFcNs from 15 animals had a median of 0.148 ±0.09 (IQR). (G) The coefficient of variation of the inter-spike intervals across the population was 1.13 ± 0.48 (median ±IQR, n = 127, N = 15). (H) The spike amplitudes within each cell was not normally distributed in 81 of 127 cells, gray shaded area shows critical value of the Jarque-Bera (JB) statistic, see STAR Methods. (I) Ca2+ recording of a CSFcN before and during application of 1 μM TTx. (J) TTx had no effect on CSFcN spontaneous spike rate, control 0.085 ±0.1 Hz versus TTx 0.104 ±0.1 Hz, median ±IQR, p = 0.32, Wilcoxon signed rank, n= 37, N = 4. (K) TTx had no effect on the amplitude of spikes, control 0.76 ±1.28 ΔF/F versus +TTx 0.63 ±1.36 ΔF/F, median ±IQR, p = 0.61, Wilcoxon signed rank, n= 37, N = 4. Box plots in F, G, J & K show the median and 25th and 75th percentiles.
Figure 3
Figure 3
CSFcNs display variable action potential waveforms with dual depolarizing peaks A(i) example of an EAP recorded from a non-CSFcN (mean and SD). (Aii) integral of the mean EAP in Ai. (B) EAPs from two CSFcNs, mean (dark red) and SD (light red) and two single examples of a large (blue) and small (green) 2ndry peak of the EAP. (C) Integrals of the traces shown in B, note the large variation in amplitude. (D) Amplitude histograms calculated for the ∫EAPs shown in C. (E) The coefficient of variation for ∫EAP amplitudes were significantly larger in CSFcNs (n = 16, N = 10) compared to non-CSFcNs (n = 4, N = 4, p = 0.0013, t-test). (F) The ∫EAP amplitudes within each cell were not normally distributed in 15 of 16 cells, gray shaded area shows critical value of the Jarque-Bera (JB) statistic, see STAR Methods.
Figure 4
Figure 4
Mechanical activation of CSFcNs via the patch pipette (A) VGAT-GCaMP6 image of CSFcNs (green and dashed outlines) with an EAP electrode against the blue dashed cell. (B) Top: spontaneous activity of the blue cell in A before and after placement of the EAP electrode. Bottom gray rows show 3 neighboring CSFcNs recorded simultaneously in the same field of view that did not have an electrode placed against them. (C) Ca2+ activity was higher in all cells with a EAP electrode compare to their neighbors (1.43 ± 1.01 vs 0.13 ±0.7 ΔF/F s-1, p = 1.4 × 10-9, Mann–Whitney U test, EAP n = 15, neighbors n = 66). Box plots in C show the median and 25th and 75th percentiles.
Figure 5
Figure 5
The EAP waveform is correlated with Ca2+spike amplitude (A) Simultaneous recording of Ca2+ activity (gray) and EAPs (blue). Detected EAPs indicated by yellow dots and Ca2+ spikes detected as in Figure 2 are indicated by red dots. (B) The detected spikes from A with expanded time base and ordered by the integral of the EAP. For clarity, Ca2+ spikes were truncated (gray dashed line) at the point of a subsequent Ca2+ spike. (C) The correlation between the peak of the EAP integral and the Ca2+ spike amplitude for the cell in A had a R2 of 0.76. (D) The mean R2 for the correlation between EAP integral and Ca2+ spike amplitude was 0.51 ±0.14 (n = 5, N = 5) and the strength of this relationship depended on the signal-to-noise ratio (SNR) of the Ca2+ recordings, see STAR Methods.
Figure 6
Figure 6
Two types of voltage-activated Ca2+ channels mediate different amplitude spikes in CSfcNs (A) EAP recording from a CSFcN during application of 100 μM Cd2+ with the amplitude of the 2ndry peak shown below (red dots). (B) The mean ± SD EAP waveform for the first 50 events before Cd2+ application (black) and the last 50 events in the presence of Cd2+ (red). Cd2+ caused a hyperpolarizing shift in the secondary peak of 5.4 ±1.9 pA (n = 4, N = 4). (C) Ca2+ spikes recorded from a CSFcN during application of 100 μM Cd2+. (D) The Ca2+ spikes from C parsed out before (black) and after Cd2+ application (red). Note the variable amplitudes in control (black) which become smaller and less variable in Cd2+. (E) 100 μM Cd2+ significantly reduced the mean amplitude of CSFcN Ca2+ spikes (n = 65, N = 5, p = 1.18 × 10−6, Wilcoxon signed rank). (F) Histograms of CSFcN amplitudes normalized to their mean amplitude in control. A significant reduction in large amplitude events occurs with Cd2+ (n = 65, N = 5, p = 9.33 × 10-15, Kolmogorov-Smirnov test). (G) Ca2+ recording from a CSFcN before and during application of 3 μM ML218. (H) ML218 caused a significant reduction in spontaneous firing in CSFcNs, p = 5.6 × 10−6, Wilcoxon signed rank test, n = 27, N = 4. (I) EAP recording from a CSFcN before and during application of 3 μM ML218. (J) ML218 caused a significant reduction in spontaneous EAPs in CSFcNs, p = 0.005, n = 4, N = 4. Box plots in E & H show the median and 25th and 75th percentiles.
Figure 7
Figure 7
CSFcNs signal acetylcholine and ATP inputs with different amplitude spikes (A) The response of a CSFcN to focal application of Acetylcholine (Ach 1 mM, black traces), the same CSFcN responding to focal application of ATP (300 μM, red traces). 3 trials are overlain with the average shown in dark. Experiment was conducted in the presence of 20 μM NBQX, 50 μM APV, 10 μM GABAzine, 1 μM strychnine and 1 μM atropine. (B) CSFcNs generated larger spikes to ACh (4.63 ΔF/F IQR 2.98) compared to ATP (0.88 ΔF/F IQR 1.28, n = 28, N = 3, p = 4.716 × 10-6, Wilcoxon signed rank. (C) 3 μM ML218 had minimal effect on Ach evoked responses, 2.80 ΔF/F IQR 2.24 vs 2.42 ΔF/F IQR 2.18, n = 64, N = 3, p = 0.536, Wilcoxon signed rank. (D) ML218 caused a significant reduction in ATP evoked responses, 0.57 ΔF/F IQR 0.68 vs ATP + ML218: 0.04 ΔF/F IQR 0.22, n = 35, N = 4. Box plots in B-D show the median and 25th and 75th percentiles.

Similar articles

Cited by

References

    1. Djenoune L., Khabou H., Joubert F., Quan F.B., Nunes Figueiredo S., Bodineau L., Del Bene F., Burcklé C., Tostivint H., Wyart C. Investigation of spinal cerebrospinal fluid-contacting neurons expressing PKD2L1: evidence for a conserved system from fish to primates. Front. Neuroanat. 2014;8:26. doi: 10.3389/fnana.2014.00026. - DOI - PMC - PubMed
    1. Humphrey T. Sensory ganglion cells within the central canal of the embryonic human spinal cord. J. Comp. Neurol. 1947;86:1–35. doi: 10.1002/cne.900860102. - DOI - PubMed
    1. Orts-Del’Immagine A., Trouslard J., Airault C., Hugnot J.P., Cordier B., Doan T., Kastner A., Wanaverbecq N. Postnatal maturation of mouse medullo-spinal cerebrospinal fluid-contacting neurons. Neuroscience. 2017;343:39–54. doi: 10.1016/j.neuroscience.2016.11.028. - DOI - PubMed
    1. Orts-Del’immagine A., Wanaverbecq N., Tardivel C., Tillement V., Dallaporta M., Trouslard J. Properties of subependymal cerebrospinal fluid contacting neurones in the dorsal vagal complex of the mouse brainstem. J. Physiol. 2012;590:3719–3741. doi: 10.1113/jphysiol.2012.227959. - DOI - PMC - PubMed
    1. Kolmer W. Das “sagittalorgan” der Wirbeltiere. Z. Anat. Entwickl. Gesch. 1921;60:652–717. doi: 10.1007/bf02593657. - DOI

LinkOut - more resources