

Genetic and functional odorant receptor variation in the Homo lineage
- PMID: 36691623
- PMCID: PMC9860384
- DOI: 10.1016/j.isci.2022.105908
Genetic and functional odorant receptor variation in the Homo lineage
Abstract
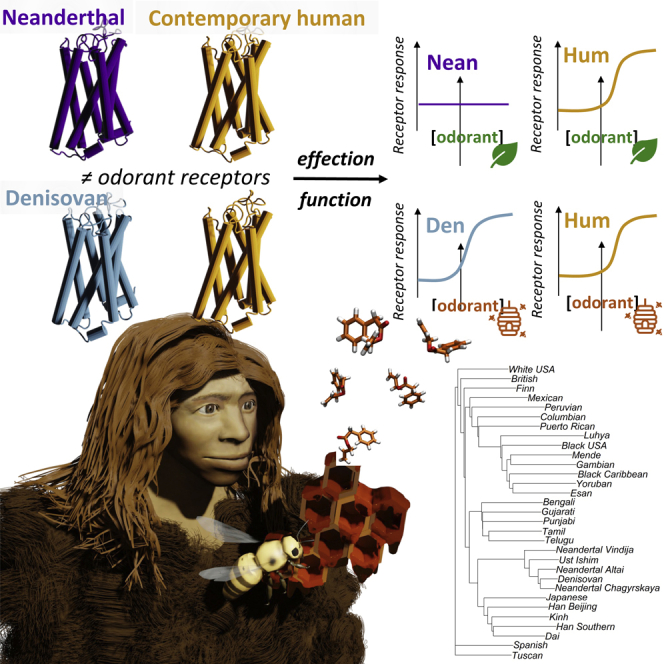
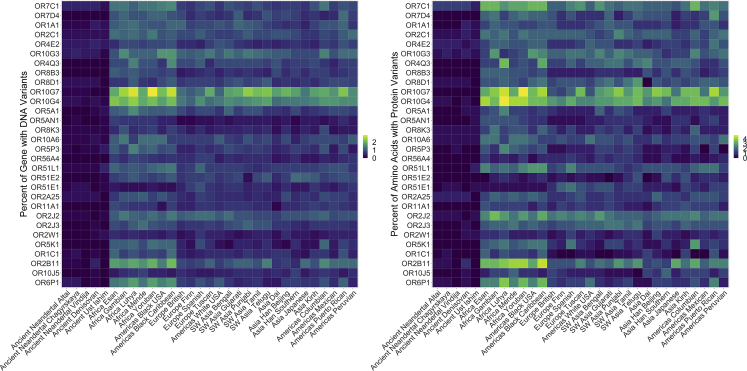
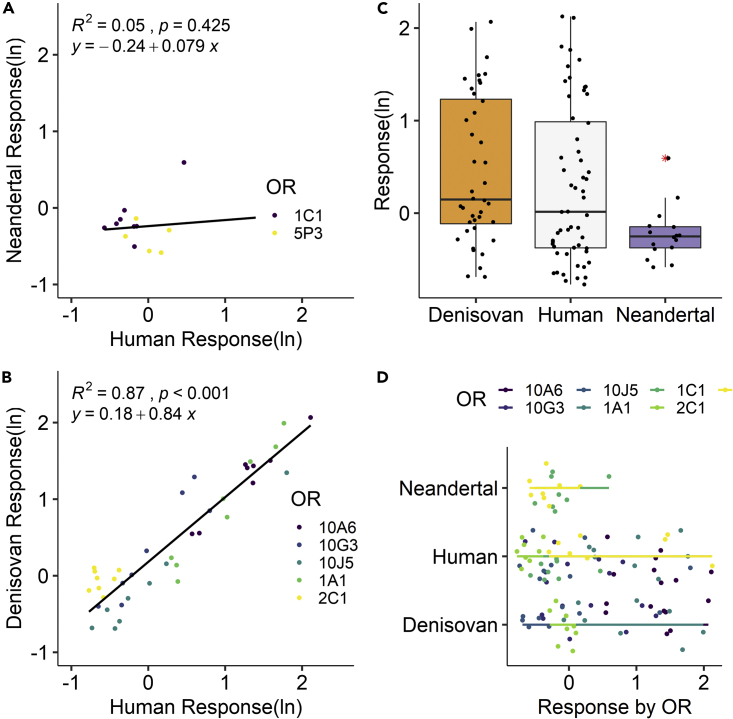
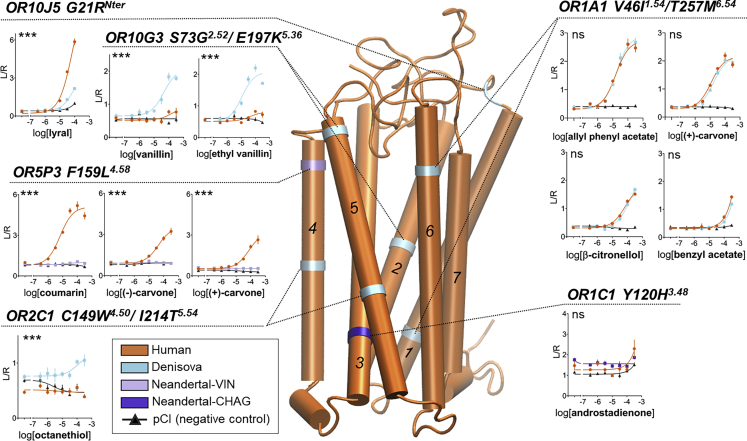
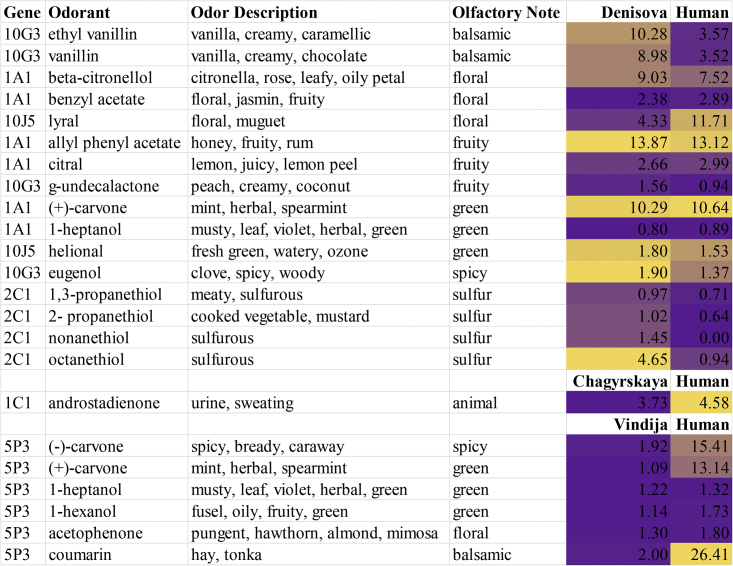
Humans, Neanderthals, and Denisovans independently adapted to a wide range of geographic environments and their associated food odors. Using ancient DNA sequences, we explored the in vitro function of thirty odorant receptor genes in the genus Homo. Our extinct relatives had highly conserved olfactory receptor sequence, but humans did not. Variations in odorant receptor protein sequence and structure may have produced variation in odor detection and perception. Variants led to minimal changes in specificity but had more influence on functional sensitivity. The few Neanderthal variants disturbed function, whereas Denisovan variants increased sensitivity to sweet and sulfur odors. Geographic adaptations may have produced greater functional variation in our lineage, increasing our olfactory repertoire and expanding our adaptive capacity. Our survey of olfactory genes and odorant receptors suggests that our genus has a shared repertoire with possible local ecological adaptations.
Keywords: Anthropology; Archeology; Evolutionary biology; Molecular biology.
© 2023 The Authors.
Conflict of interest statement
H.M. has received royalties from Chemcomm. H.M. has received research grants from Givaudan. H.M. has received consultant fees from Kao.
Figures
Similar articles
-
Deleterious variants in genes regulating mammalian reproduction in Neanderthals, Denisovans and extant humans.Hum Reprod. 2021 Feb 18;36(3):734-755. doi: 10.1093/humrep/deaa347. Hum Reprod. 2021. PMID: 33417716
-
Loss of olfactory receptor function in hominin evolution.PLoS One. 2014 Jan 2;9(1):e84714. doi: 10.1371/journal.pone.0084714. eCollection 2014. PLoS One. 2014. PMID: 24392153 Free PMC article.
-
Genetic variation across the human olfactory receptor repertoire alters odor perception.Proc Natl Acad Sci U S A. 2019 May 7;116(19):9475-9480. doi: 10.1073/pnas.1804106115. Epub 2019 Apr 30. Proc Natl Acad Sci U S A. 2019. PMID: 31040214 Free PMC article.
-
Odor discrimination by G protein-coupled olfactory receptors.Microsc Res Tech. 2002 Aug 1;58(3):135-41. doi: 10.1002/jemt.10131. Microsc Res Tech. 2002. PMID: 12203691 Review.
-
Hominin interbreeding and the evolution of human variation.J Biol Res (Thessalon). 2016 Jul 16;23:17. doi: 10.1186/s40709-016-0054-7. eCollection 2016 Dec. J Biol Res (Thessalon). 2016. PMID: 27429943 Free PMC article. Review.
Cited by
-
Conserved pattern-based classification of human odorant receptor multigene family.Sci Rep. 2024 Nov 8;14(1):27271. doi: 10.1038/s41598-024-79183-8. Sci Rep. 2024. PMID: 39516664 Free PMC article.
-
Changes in paranasal sinus volumes, temporal bone pneumatization, internal acoustic canal and olfactory cleft dimensions over the centuries: a comparison of skulls from different epochs in Anatolia.Eur Arch Otorhinolaryngol. 2024 Nov;281(11):5983-5990. doi: 10.1007/s00405-024-08804-9. Epub 2024 Jul 8. Eur Arch Otorhinolaryngol. 2024. PMID: 38977474 Free PMC article.
-
Did Down-Regulated Instincts Enable Human Gene-Culture Coevolution?Evol Anthropol. 2025 Sep;34(3):e70015. doi: 10.1002/evan.70015. Evol Anthropol. 2025. PMID: 40811454 Free PMC article. Review.
-
Nature and human well-being: The olfactory pathway.Sci Adv. 2024 May 17;10(20):eadn3028. doi: 10.1126/sciadv.adn3028. Epub 2024 May 15. Sci Adv. 2024. PMID: 38748806 Free PMC article. Review.
References
-
- Boughman J.W. How sensory drive can promote speciation. Trends Ecol. Evol. 2002;17:571–577. doi: 10.1016/S0169-5347(02)02595-8. - DOI
-
- Matsumoto T., Terai Y., Okada N., Tachida H. Sensory drive speciation and patterns of variation at selectively neutral genes. Evol. Ecol. 2014;28:591–609. doi: 10.1007/s10682-014-9697-8. - DOI
-
- Saraiva L.R., Riveros-McKay F., Mezzavilla M., Abou-Moussa E.H., Arayata C.J., Makhlouf M., Trimmer C., Ibarra-Soria X., Khan M., Van Gerven L., et al. A transcriptomic atlas of mammalian olfactory mucosae reveals an evolutionary influence on food odor detection in humans. Sci. Adv. 2019;5:eaax0396. doi: 10.1126/sciadv.aax0396. - DOI - PMC - PubMed
LinkOut - more resources
Full Text Sources
