. 2023 Feb 14;17(3):2328-2340.
doi: 10.1021/acsnano.2c09008. Epub 2023 Jan 24.

A Heterocatalytic Metal-Organic Framework to Stimulate Dispersal and Macrophage Combat with Infectious Biofilms

Affiliations

A Heterocatalytic Metal-Organic Framework to Stimulate Dispersal and Macrophage Combat with Infectious Biofilms

Renfei Wu et al. ACS Nano. .

Abstract

Eradication of infectious biofilms is becoming increasingly difficult due to the growing number of antibiotic-resistant strains. This necessitates development of nonantibiotic-based, antimicrobial approaches. To this end, we designed a heterocatalytic metal-organic framework composed of zirconium 1,4-dicarboxybenzene (UiO-66) with immobilized Pt nanoparticles (Pt-NP/UiO-66). Pt-NP/UiO-66 enhanced singlet-oxygen generation compared with Pt nanoparticles or UiO-66, particularly in an acidic environment. Singlet-oxygen generation degraded phosphodiester bonds present in eDNA gluing biofilms together and therewith dispersed biofilms. Remaining biofilms possessed a more open structure. Concurrently, Pt-NP/UiO-66 stimulated macrophages to adapt a more M1-like, "fighting" phenotype, moving faster toward their target bacteria and showing increased bacterial killing. As a combined effect of biofilm dispersal and macrophage polarization, a subcutaneous Staphylococcus aureus biofilm in mice was more readily eradicated by Pt-NP/UiO-66 than by Pt nanoparticles or UiO-66. Therewith, heterocatalytic Pt-NP/UiO-66 metal-organic frameworks constitute a nonantibiotic-based strategy to weaken protective matrices and disperse infectious biofilms, while strengthening macrophages in bacterial killing.

Keywords: Metal organic framework; antibacterial; extracellular DNA; immunomodulation; wound healing.


Conflict of interest statement

The authors declare the following competing financial interest(s): H.J.B. is also the director of a consulting company, SASA BV (GN Schutterlaan 4, 9797 PC Thesinge, The Netherlands). The authors declare no potential conflicts of interest with respect to authorship and/or publication of this Article. Opinions and assertions contained herein are those of the authors and are not construed as necessarily representing views of their respective employers.

Figures

Figure 1
Figure 1
Characterization of Pt nanoparticles and MOFs. (A) TEM micrographs of Pt nanoparticles and UiO-66 and Pt-NP/UiO-66 MOFs. Insets represent the diameter distributions derived from the micrographs. Three TEM images were used to measure the diameters of the nanoparticles and MOFs, comprising a total of 200 nanoparticles and MOFs for each measurement. Diameters were plotted in histograms with 1 and 10 nm binning size for Pt nanoparticles and MOFs, respectively. Average diameters and standard deviations of the distributions were calculated by fitting a log-normal function to the data. (B) High-resolution TEM micrograph and corresponding fast Fourier transform (FFT) image (inset) of a Pt nanoparticle. (C) High-angle annular dark-field (HAADF), scanning TEM micrograph of single Pt-NP/UiO-66 MOFs, and corresponding energy-dispersive X-ray spectroscopy mapping of Zr and Pt. (D) X-ray diffraction patterns of UiO-66 and Pt-NP/UiO-66 MOFs. (E) Nitrogen (N2) sorption isotherms at 77 K of UiO-66 and Pt-NP/UiO-66 MOFs. The solid and open symbols represent adsorption and desorption, respectively. (F) Zeta potentials of Pt nanoparticles and UiO-66 and Pt-NP/UiO-66 MOFs in water. Data represent means over triplicate experiments with error bars indicating standard deviations.
Figure 2
Figure 2
Catalytic activity and generation of singlet oxygen by Pt-NP/UiO-66 MOFs at acidic pH (pH 4). (A) The catalytic activity of suspended Pt nanoparticles and UiO-66 and Pt-NP/UiO-66 MOFs as a function of time, derived from TMB oxidation and expressed as the UV–vis absorbance at 652 nm (see Figure S2). The suspensions contained 0.4 μg/mL Pt nanoparticles or 20 μg/mL UiO-66 or Pt-NP/UiO-66 MOFs. (B) Generation of singlet oxygen measured from the oxidation of ABDA in the presence of Pt nanoparticles and UiO-66 and Pt-NP/UiO-66 MOFs as a function of time, derived from oxidation of ABDA into ABDA endoperoxide and expressed as a reduction in UV–vis absorbance at 400 nm (see Figure S5). Data represent means over triplicate experiments with error bars indicating standard deviations.
Figure 3
Figure 3
Degradation of phosphodiester bonds by Pt-NP/UiO-66 MOFs at pH 4 and 7. Degradation of the phosphodiester bond in BNPP by suspended Pt nanoparticles and UiO-66 and Pt-NP/UiO-66 MOFs was derived from the generation of nitrophenolate and the measurement of UV–vis absorbance at 400 nm (see Figure S6). The suspensions contained 2 μg/mL Pt nanoparticles or 100 μg/mL UiO-66 or Pt-NP/UiO-66 MOFs and were mixed for 5 min with BNPP (0.4 mM) in Tris buffer (50 mM). Shaded bars represent data pertaining to pH 4. Data represent means over triplicate experiments with error bars indicating standard deviations. *** indicates statistical significance (p < 0.001, two-tailed Student’s t-test) over the differences indicated by the spanning bar.
Figure 4
Figure 4
Cytokine secretion by macrophages upon exposure to Pt-NP/UiO-66 MOFs. Macrophages in DMEM-HG were exposed to Pt nanoparticles (8 μg/mL), UiO-66 (400 μg/mL), Pt-NP/UiO-66 MOFs (400 μg/mL), lipopolysaccharides (LPS, 10 μg/mL), or bacterial fragments (100 μg/mL) for 24 h. Secretion of IL-6, IL-12, and Arg-1 was measured using an enzyme-linked immunosorbent assay (see Figure S7 for calibration curves). (A) IL-6 secretion. (B) IL-12 secretion. (C) Arg-1 secretion. Data represent means over triplicate experiments with error bars indicating standard deviations. Error bars were taken from three parallel experiments. *p < 0.05 and ***p < 0.001 indicate statistical significance (two-tailed Student’s t-test) over the differences indicated by the spanning bars.
Figure 5
Figure 5
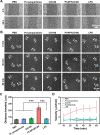
Displacement of macrophages on a nonbiological glass surface without adhering bacteria and on a biofilm surface in the presence of Pt-NP/UiO-66 MOFs. (A) 100,000 macrophages suspended in DMEM-HG supplemented with 8 μg/mL Pt nanoparticles or 400 μg/mL UiO-66 or Pt-NP/UiO-66 MOFs were sedimented on a circular glass coverslip in a confocal dish for 24 h after which a 1.5 mm scratch was made in the macrophage film. Bright field images were taken after another 24 h, showing that the scratch had closed for 49% and 53% by macrophages exposed to LPS or Pt-NP/UiO-66, respectively. (B) Biofilms grown for 24 h on a circular glass coverslip in a confocal dish were exposed for another 24 h to 8 μg/mL Pt nanoparticles or 400 μg/mL UiO-66 or Pt-NP/UiO-66 MOFs and suspended in TSB. Subsequently, after removal of TSB, 100,000 macrophages suspended in DMEM-HG were added. After sedimentation of the macrophages for 30 min, the migration distances were tracked by live imaging for 1 h. The numbers in the bright field images refer to individual macrophages (indicated by arrows) tracked over time. (C) Total distance traveled by macrophages on a surface with adhering bacteria. Data represent means over triplicate experiments with error bars indicating standard deviations. Error bars were taken from three parallel experiments. ***p < 0.001 indicates statistical significance (two-tailed Student’s t-test) over the differences indicated by the spanning bars. (D) Velocity of macrophage displacement on a surface with adhering bacteria in the presence of Pt-NP/UiO-66 MOFs as a function of time. Each data point represents the average over 20 macrophages in one experiment, with error bars indicating standard deviations.
Figure 6
Figure 6
Dispersal of a 24 h S. aureus Xen36 biofilm upon 24 h of exposure to different concentrations of Pt-NP/UiO-66 MOFs in 2 mL of TSB and macrophage (mφ) action. Biofilms exposed to MOFs were stained with green-fluorescent SYTO9 and red-fluorescent propidium iodide for 3D confocal laser scanning microscopy (CLSM). In a separate experiment, MOFs pre-exposed staphylococcal biofilms were subsequently exposed to macrophages at MOF concentration up to 800 μg/mL. (A) 3D CLSM cross-sectional and overlayer images of staphylococcal biofilms exposed to selected concentrations of MOFs. (B) Similar as panel A, now after subsequent macrophage exposure. (C) Biofilm thickness, derived from 3D CLSM images as presented in panels (A) and (B), as a function of MOF concentration. (D) Similar as panel (C), now for volumetric bacterial densities. Volumetric bacterial densities in biofilms were calculated as the ratio of the number of CFUs cultured from a biofilm volume divided by the volume of biofilm derived from the 3D CLSM images in panels (A) and (B). Data represent means over triplicate experiments with separately prepared bacterial cultures and error bars indicating standard deviations. *p < 0.05 and **p < 0.01 indicate statistical significance (two-tailed Student’s t-test) over the differences indicated by the spanning bars.
Figure 7
Figure 7
Healing of S. aureus Xen36 infected wounds in mice treated with Pt-NP/UiO-66 MOFs. (A) Time-line of S. aureus Xen36 infection, treatment, and imaging of the mice. Mice were treated by irrigation with 100 μL of PBS, 100 μL of 4 μg/mL Pt nanoparticles, and 100 μL of 200 μg/mL UiO-66 or Pt-NP/UiO-66 MOFs. (B) Infective wound area relative to the wound area on day 0. (C) Average body weight of mice after different treatments. (D) Bioluminescence images of infected wounds at different points in time after initiating infection. (E) The number of CFUs cultured from 100 mg of skin tissue taken from the initial wound site. Error bars were taken from three mice per group. p-values were calculated by the two-tailed Student’s t-test. **p < 0.01 and ***p < 0.001, compared with the UiO-66 group.

Similar articles

Cited by

References

    1. Kuehn B. Antibiotic Resistance Threat Grows. JAMA 2019, 322, 2376.10.1001/jama.2019.19975. - DOI - PubMed
    1. Willyard C. The Drug-Resistant Bacteria that pose the Greatest Health Treats. Nature 2017, 543, 15.10.1038/nature.2017.21550. - DOI - PubMed
    1. Makabenta J. M. V.; Nabawy A.; Li C.; Schmidt-Malan S.; Patel R.; Rotello V. M. Nanomaterial-Based Therapeutics for Antibiotic-Resistant Bacterial Infections. Nat. Rev. Microbiol. 2021, 19, 23–36. 10.1038/s41579-020-0420-1. - DOI - PMC - PubMed
    1. Gupta A.; Mumtaz S.; Li C.; Hussain I.; Rotello V. M. Combatting Antibiotic-Resistant Bacteria using Nanomaterials. Chem. Soc. Rev. 2019, 48, 415–427. 10.1039/C7CS00748E. - DOI - PMC - PubMed
    1. Richter A. P.; Brown J. S.; Bharti B.; Wang A.; Gangwal S.; Houc K.; Hubal E. A. C.; Paunov V. N.; Stoyanov S. D.; Velev O. D. An Environmentally Benign Antimicrobial Nanoparticle based on a Silver-Infused Lignin Core. Nat. Nanotechnol. 2015, 10, 817–823. 10.1038/nnano.2015.141. - DOI - PubMed

Publication types