

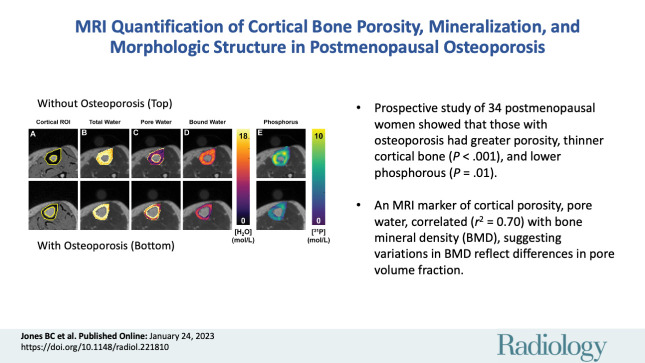
MRI Quantification of Cortical Bone Porosity, Mineralization, and Morphologic Structure in Postmenopausal Osteoporosis
- PMID: 36692396
- PMCID: PMC10102628
- DOI: 10.1148/radiol.221810
MRI Quantification of Cortical Bone Porosity, Mineralization, and Morphologic Structure in Postmenopausal Osteoporosis
Abstract
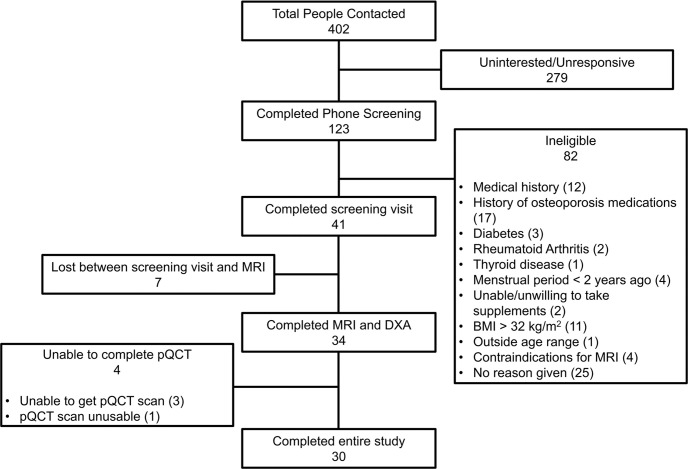
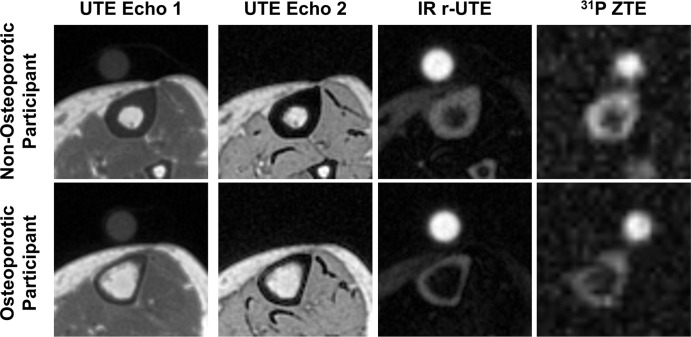
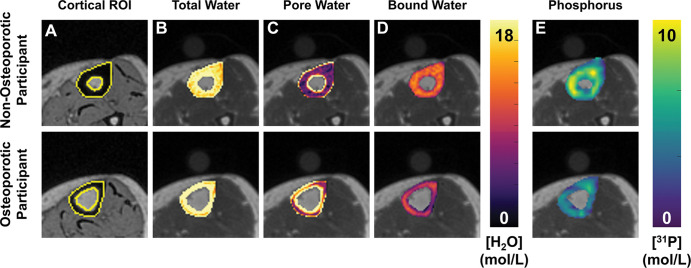
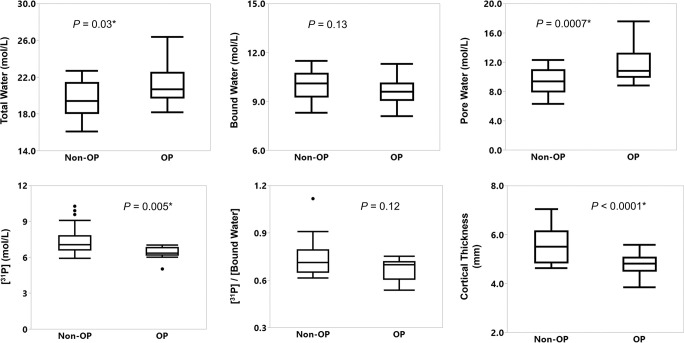
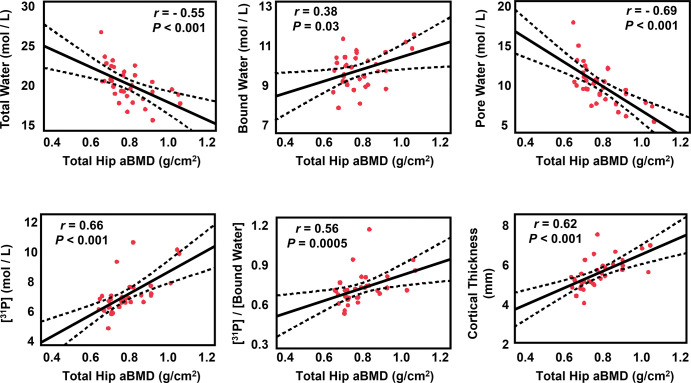
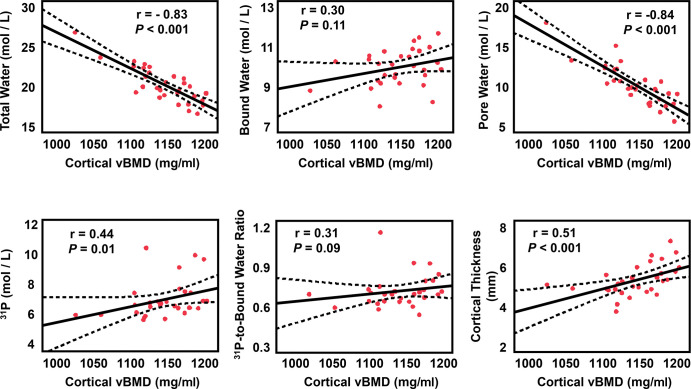
Background Preclinical studies have suggested that solid-state MRI markers of cortical bone porosity, morphologic structure, mineralization, and osteoid density are useful measures of bone health. Purpose To explore whether MRI markers of cortical bone porosity, morphologic structure, mineralization, and osteoid density are affected in postmenopausal osteoporosis (OP) and to examine associations between MRI markers and bone mineral density (BMD) in postmenopausal women. Materials and Methods In this single-center study, postmenopausal women were prospectively recruited from January 2019 to October 2020 into two groups: participants with OP who had not undergone treatment, defined as having any dual-energy x-ray absorptiometry (DXA) T-score of -2.5 or less, and age-matched control participants without OP (hereafter, non-OP). Participants underwent MRI in the midtibia, along with DXA in the hip and spine, and peripheral quantitative CT in the midtibia. Specifically, MRI measures of cortical bone porosity (pore water and total water), osteoid density (bound water [BW]), morphologic structure (cortical bone thickness), and mineralization (phosphorous [P] density [31P] and 31P-to-BW concentration ratio) were quantified at 3.0 T. MRI measures were compared between OP and non-OP groups and correlations with BMD were assessed. Results Fifteen participants with OP (mean age, 63 years ± 5 [SD]) and 19 participants without OP (mean age, 65 years ± 6) were evaluated. The OP group had elevated pore water (11.6 mol/L vs 9.5 mol/L; P = .007) and total water densities (21.2 mol/L vs 19.7 mol/L; P = .03), and had lower cortical bone thickness (4.8 mm vs 5.6 mm; P < .001) and 31P density (6.4 mol/L vs 7.5 mol/L; P = .01) than the non-OP group, respectively, although there was no evidence of a difference in BW or 31P-to-BW concentration ratio. Pore and total water densities were inversely associated with DXA and peripheral quantitative CT BMD (P < .001), whereas cortical bone thickness and 31P density were positively associated with DXA and peripheral quantitative CT BMD (P = .01). BW, 31P density, and 31P-to-BW concentration ratio were positively associated with DXA (P < .05), but not with peripheral quantitative CT. Conclusion Solid-state MRI of cortical bone was able to help detect potential impairments in parameters reflecting porosity, morphologic structure, and mineralization in postmenopausal osteoporosis. © RSNA, 2023 Supplemental material is available for this article. See also the editorial by Bae in this issue.
Conflict of interest statement
Figures
Comment in
-
Advances and Shortfalls in MRI Evaluation of Osteoporosis.Radiology. 2023 Apr;307(2):e223144. doi: 10.1148/radiol.223144. Epub 2023 Jan 24. Radiology. 2023. PMID: 36692406 Free PMC article. No abstract available.
References
-
- Bouxsein ML . Technology insight: noninvasive assessment of bone strength in osteoporosis . Nat Clin Pract Rheumatol 2008. ; 4 ( 6 ): 310 – 318 . - PubMed
-
- Seeman E , Delmas PD . Bone quality--the material and structural basis of bone strength and fragility . N Engl J Med 2006. ; 354 ( 21 ): 2250 – 2261 . - PubMed
-
- Seeman E . Age- and menopause-related bone loss compromise cortical and trabecular microstructure . J Gerontol A Biol Sci Med Sci 2013. ; 68 ( 10 ): 1218 – 1225 . - PubMed
-
- Hansen S , Hauge EM , Beck Jensen JE , Brixen K . Differing effects of PTH 1-34, PTH 1-84, and zoledronic acid on bone microarchitecture and estimated strength in postmenopausal women with osteoporosis: an 18-month open-labeled observational study using HR-pQCT . J Bone Miner Res 2013. ; 28 ( 4 ): 736 – 745 . - PubMed
Publication types
MeSH terms
Substances
Grants and funding
LinkOut - more resources
Full Text Sources
Miscellaneous
