

Mapping myelin in white matter with T1-weighted/T2-weighted maps: discrepancy with histology and other myelin MRI measures
- PMID: 36692695
- PMCID: PMC9944377
- DOI: 10.1007/s00429-022-02600-z
Mapping myelin in white matter with T1-weighted/T2-weighted maps: discrepancy with histology and other myelin MRI measures
Abstract
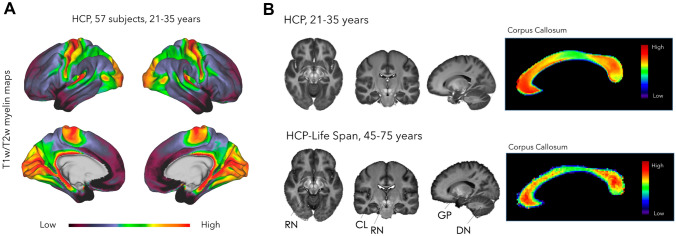
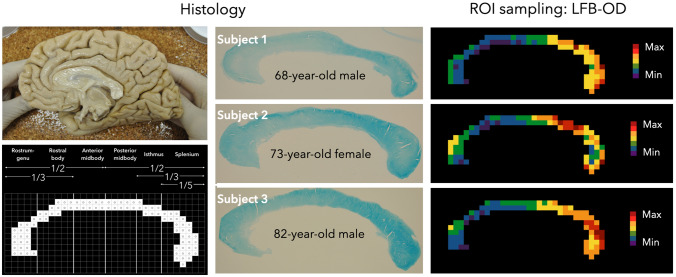
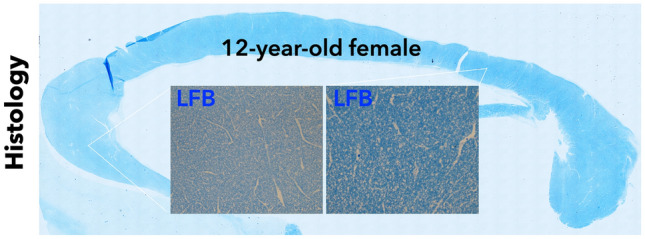
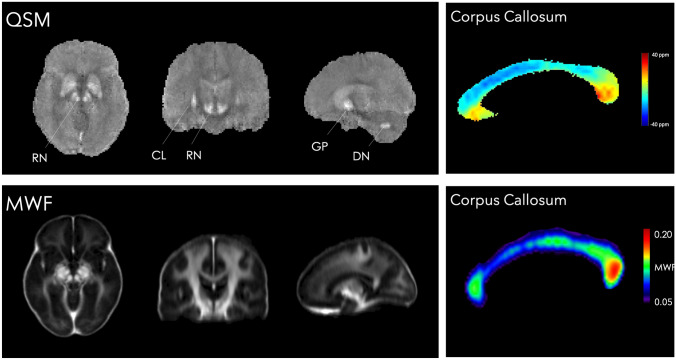
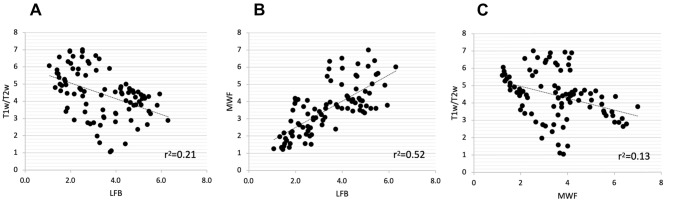
The ratio of T1-weighted/T2-weighted magnetic resonance images (T1w/T2w MRI) has been successfully applied at the cortical level since 2011 and is now one of the most used myelin mapping methods. However, no reports have explored the histological validity of T1w/T2w myelin mapping in white matter. Here we compare T1w/T2w with ex vivo postmortem histology and in vivo MRI methods, namely quantitative susceptibility mapping (QSM) and multi-echo T2 myelin water fraction (MWF) mapping techniques. We report a discrepancy between T1w/T2w myelin maps of the human corpus callosum and the histology and analyse the putative causes behind such discrepancy. T1w/T2w does not positively correlate with Luxol Fast Blue (LFB)-Optical Density but shows a weak to moderate, yet significant, negative correlation. On the contrary, MWF is strongly and positively correlated with LFB, whereas T1w/T2w and MWF maps are weakly negatively correlated. The discrepancy between T1w/T2w MRI maps, MWF and histological myelin maps suggests caution in using T1w/T2w as a white matter mapping method at the callosal level. While T1w/T2w imaging may correlate with myelin content at the cortical level, it is not a specific method to map myelin density in white matter.
Keywords: Corpus callosum; Myelin mapping; Myelin water fraction; Neuroanatomy; Neuroimaging; Quantitative susceptibility mapping; Validation.
© 2023. The Author(s).
Conflict of interest statement
Stefano Sandrone has no relevant financial or non-financial interests to disclose.
Figures
Similar articles
-
Comparisons between multi-component myelin water fraction, T1w/T2w ratio, and diffusion tensor imaging measures in healthy human brain structures.Sci Rep. 2019 Feb 21;9(1):2500. doi: 10.1038/s41598-019-39199-x. Sci Rep. 2019. PMID: 30792440 Free PMC article.
-
Use of T1-weighted/T2-weighted magnetic resonance ratio images to elucidate changes in the schizophrenic brain.Brain Behav. 2015 Sep 25;5(10):e00399. doi: 10.1002/brb3.399. eCollection 2015 Oct. Brain Behav. 2015. PMID: 26516617 Free PMC article.
-
Effect of echo time and T2-weighting on GRASE-based T1w/T2w ratio measurements at 3T.Magn Reson Imaging. 2018 Sep;51:35-43. doi: 10.1016/j.mri.2018.04.012. Epub 2018 Apr 20. Magn Reson Imaging. 2018. PMID: 29680454
-
New insights into the dynamic development of the cerebral cortex in childhood and adolescence: Integrating macro- and microstructural MRI findings.Prog Neurobiol. 2021 Sep;204:102109. doi: 10.1016/j.pneurobio.2021.102109. Epub 2021 Jun 18. Prog Neurobiol. 2021. PMID: 34147583 Review.
-
Towards in vivo g-ratio mapping using MRI: Unifying myelin and diffusion imaging.J Neurosci Methods. 2021 Jan 15;348:108990. doi: 10.1016/j.jneumeth.2020.108990. Epub 2020 Oct 28. J Neurosci Methods. 2021. PMID: 33129894 Free PMC article. Review.
Cited by
-
Correlations between postmortem quantitative MRI parameters and demyelination, axonal loss and gliosis in multiple sclerosis: A systematic review and meta-analysis.Brain Imaging Behav. 2025 Apr;19(2):323-335. doi: 10.1007/s11682-025-00971-5. Epub 2025 Jan 27. Brain Imaging Behav. 2025. PMID: 39871045
-
Complementary MR measures of white matter and their relation to cardiovascular health and cognition.Sci Rep. 2025 Aug 7;15(1):28890. doi: 10.1038/s41598-025-13610-2. Sci Rep. 2025. PMID: 40775500 Free PMC article.
-
Linking neuron-axon-synapse architecture to white matter vasculature using high-resolution multimodal MRI in primate brain.Imaging Neurosci (Camb). 2025 Jul 17;3:IMAG.a.77. doi: 10.1162/IMAG.a.77. eCollection 2025. Imaging Neurosci (Camb). 2025. PMID: 40800782 Free PMC article.
-
Interplay between MRI-based axon diameter and myelination estimates in macaque and human brain.Imaging Neurosci (Camb). 2025 May 12;3:imag_a_00576. doi: 10.1162/imag_a_00576. eCollection 2025. Imaging Neurosci (Camb). 2025. PMID: 40800960 Free PMC article.
-
Brain maps of general cognitive function and spatial correlations with neurobiological cortical profiles.bioRxiv [Preprint]. 2024 Dec 18:2024.12.17.628670. doi: 10.1101/2024.12.17.628670. bioRxiv. 2024. PMID: 39764021 Free PMC article. Preprint.
References
-
- Alberts B, Alberts B, Johnson A, Lewis J, Raff M, Roberts K, Walter P. Molecular biology of the cell. New York: Garland Science; 2014.
MeSH terms
Substances
LinkOut - more resources
Full Text Sources
