

Antibody levels following vaccination against SARS-CoV-2: associations with post-vaccination infection and risk factors in two UK longitudinal studies
- PMID: 36692910
- PMCID: PMC9940912
- DOI: 10.7554/eLife.80428
Antibody levels following vaccination against SARS-CoV-2: associations with post-vaccination infection and risk factors in two UK longitudinal studies
Abstract
Background: Severe acute respiratory syndrome coronavirus 2 (SARS-CoV-2) antibody levels can be used to assess humoral immune responses following SARS-CoV-2 infection or vaccination, and may predict risk of future infection. Higher levels of SARS-CoV-2 anti-Spike antibodies are known to be associated with increased protection against future SARS-CoV-2 infection. However, variation in antibody levels and risk factors for lower antibody levels following each round of SARS-CoV-2 vaccination have not been explored across a wide range of socio-demographic, SARS-CoV-2 infection and vaccination, and health factors within population-based cohorts.
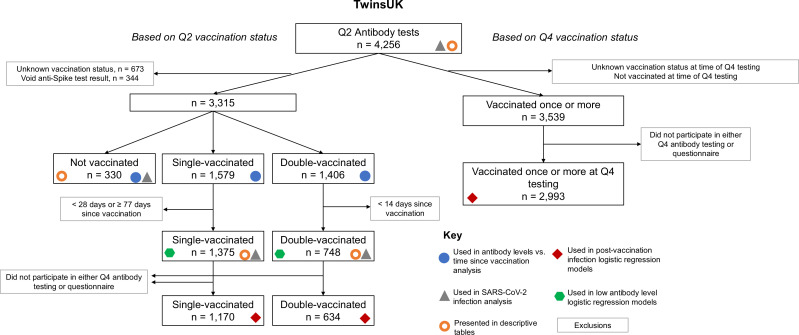
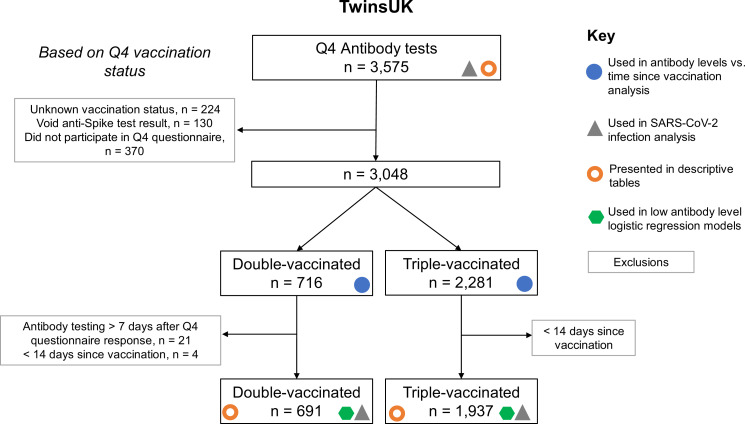
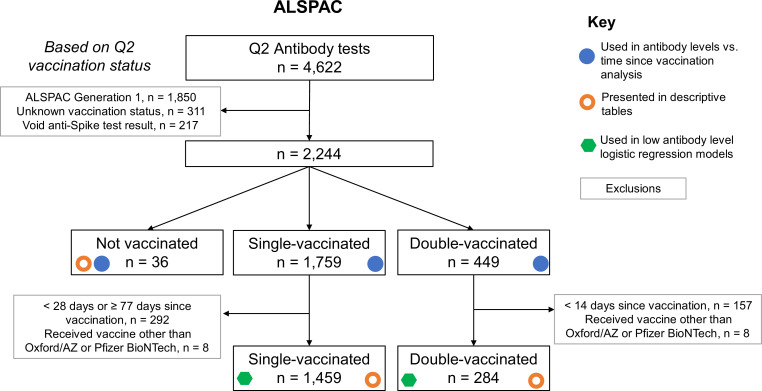
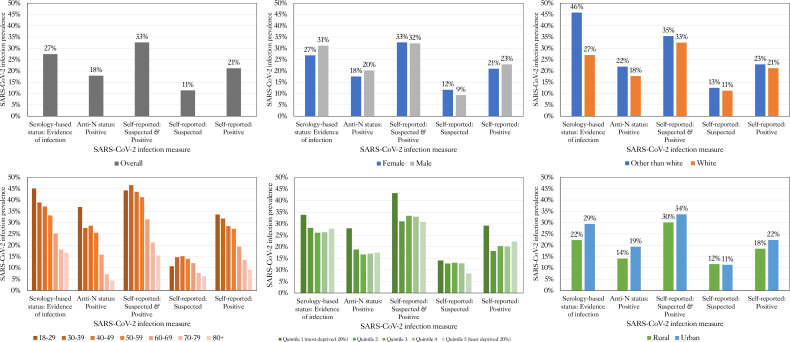
Methods: Samples were collected from 9361 individuals from TwinsUK and ALSPAC UK population-based longitudinal studies and tested for SARS-CoV-2 antibodies. Cross-sectional sampling was undertaken jointly in April-May 2021 (TwinsUK, N=4256; ALSPAC, N=4622), and in TwinsUK only in November 2021-January 2022 (N=3575). Variation in antibody levels after first, second, and third SARS-CoV-2 vaccination with health, socio-demographic, SARS-CoV-2 infection, and SARS-CoV-2 vaccination variables were analysed. Using multivariable logistic regression models, we tested associations between antibody levels following vaccination and: (1) SARS-CoV-2 infection following vaccination(s); (2) health, socio-demographic, SARS-CoV-2 infection, and SARS-CoV-2 vaccination variables.
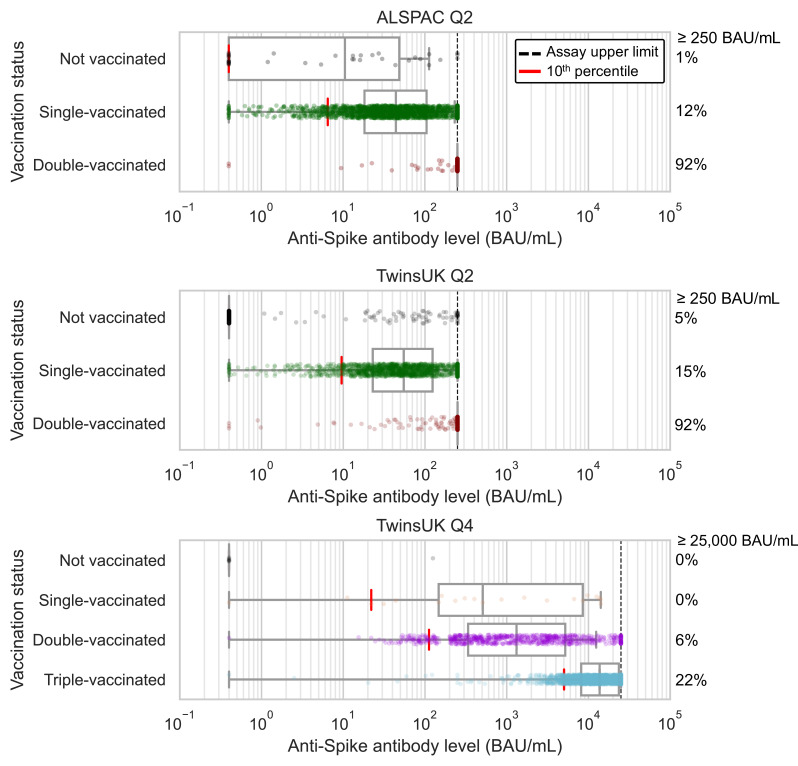
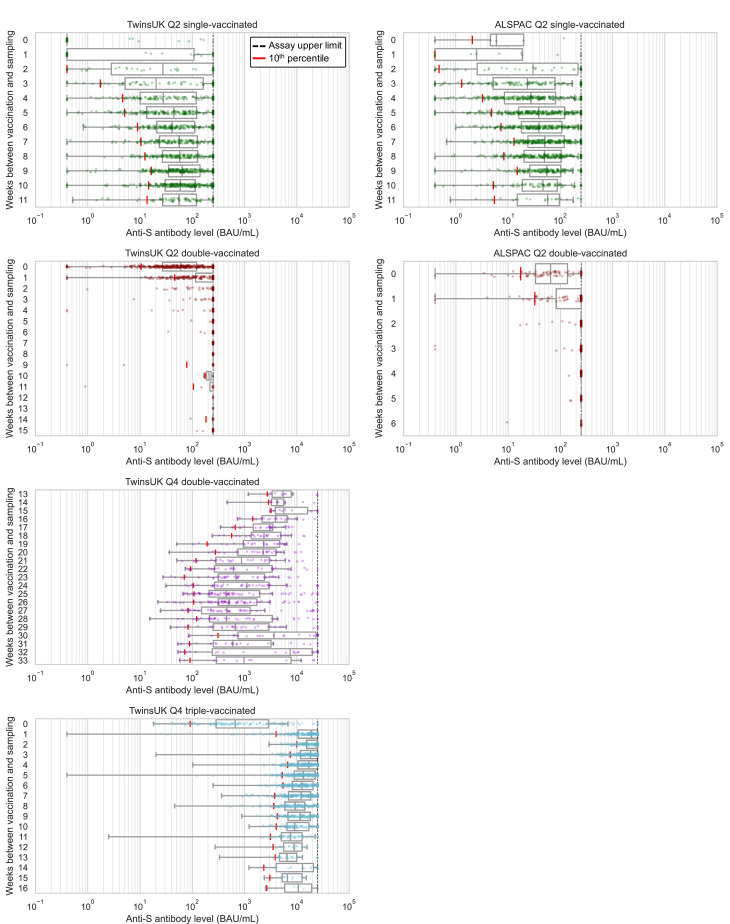
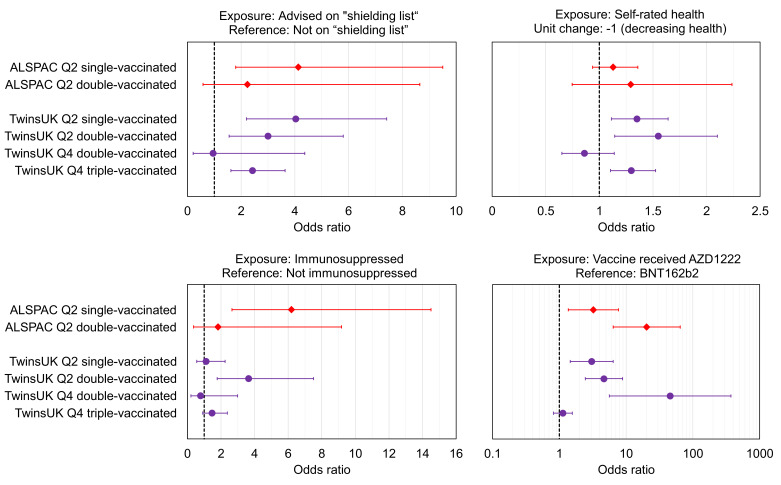
Results: Within TwinsUK, single-vaccinated individuals with the lowest 20% of anti-Spike antibody levels at initial testing had threefold greater odds of SARS-CoV-2 infection over the next 6-9 months (OR = 2.9, 95% CI: 1.4, 6.0), compared to the top 20%. In TwinsUK and ALSPAC, individuals identified as at increased risk of COVID-19 complication through the UK 'Shielded Patient List' had consistently greater odds (two- to fourfold) of having antibody levels in the lowest 10%. Third vaccination increased absolute antibody levels for almost all individuals, and reduced relative disparities compared with earlier vaccinations.
Conclusions: These findings quantify the association between antibody level and risk of subsequent infection, and support a policy of triple vaccination for the generation of protective antibodies.
Funding: Antibody testing was funded by UK Health Security Agency. The National Core Studies program is funded by COVID-19 Longitudinal Health and Wellbeing - National Core Study (LHW-NCS) HMT/UKRI/MRC ([MC_PC_20030] and [MC_PC_20059]). Related funding was also provided by the NIHR 606 (CONVALESCENCE grant [COV-LT-0009]). TwinsUK is funded by the Wellcome Trust, Medical Research Council, Versus Arthritis, European Union Horizon 2020, Chronic Disease Research Foundation (CDRF), Zoe Ltd and the National Institute for Health Research (NIHR) Clinical Research Network (CRN) and Biomedical Research Centre based at Guy's and St Thomas' NHS Foundation Trust in partnership with King's College London. The UK Medical Research Council and Wellcome (Grant ref: [217065/Z/19/Z]) and the University of Bristol provide core support for ALSPAC.
Keywords: ALSPAC; COVID-19; SARS-CoV-2; TwinsUK; antibodies; epidemiology; global health; human; medicine; vaccination.
Plain language summary
Vaccination against the virus that causes COVID-19 triggers the body to produce antibodies that help fight future infections. But some people generate more antibodies after vaccination than others. People with lower levels of antibodies are more likely to get COVID-19 in the future. Identifying people with low antibody levels after COVID-19 vaccination is important. It could help decide who receives priority for future vaccination. Previous studies show that people with certain health conditions produce fewer antibodies after one or two doses of a COVID-19 vaccine. For example, people with weakened immune systems. Now that third booster doses are available, it is vital to determine if they increase antibody levels for those most at risk of severe COVID-19. Cheetham et al. show that a third booster dose of a COVID-19 vaccine boosts antibodies to high levels in 90% of individuals, including those at increased risk. In the experiments, Cheetham et al. measured antibodies against the virus that causes COVID-19 in 9,361 individuals participating in two large long-term health studies in the United Kingdom. The experiments found that UK individuals advised to shield from the virus because they were at increased risk of complications had lower levels of antibodies after one or two vaccine doses than individuals without such risk factors. This difference was also seen after a third booster dose, but overall antibody levels had large increases. People who received the Oxford/AstraZeneca vaccine as their first dose also had lower antibody levels after one or two doses than those who received the Pfizer/BioNTech vaccine first. Positively, this difference in antibody levels was no longer seen after a third booster dose. Individuals with lower antibody levels after their first dose were also more likely to have a case of COVID-19 in the following months. Antibody levels were high in most individuals after the third dose. The results may help governments and public health officials identify individuals who may need extra protection after the first two vaccine doses. They also support current policies promoting booster doses of the vaccine and may support prioritizing booster doses for those at the highest risk from COVID-19 in future vaccination campaigns.
© 2023, Cheetham et al.
Conflict of interest statement
NC, AW, RS, AK, DW, OH, PL, GD, JZ, GP, ET, RB, XZ, GA, DH, JS, CG, NK, SA, MM, RM, KN, DM, SM, TB, MC, LM, AK, KD, ED, NT No competing interests declared, MK received payment for attending the Health and Safety Executive (HSE) symposium. The author has no other competing interests to declare, CB received an ESRC and NIHR funded Grant, and MRC Funded Studentship. The author has no other competing interests to declare, SK participates on the Scottish Government Expert Reference Group on Ethnicity and COVID-19, and UK Scientific Advisory Group on Emergencies (SAGE) subgroup on Ethnicity. The author has no other competing interests to declare, MG is a member of the King's College London Health Faculties Research Ethics Subcommittee (Purple), and a Chair of the TwinsUK Volunteer Advisory Panel. The author has no other competing interests to declare, NC received payment for clinical trials of a diabetes drug from AstraZeneca. Nishi Chaturvedi is Chair of British Heart Foundation Fellowships Committee, a member of Diabetes UK research committee and a member of NWO Gravitational Awards Committee. The author has no other competing interests to declare, CS received payment for consultancy work for Zoe Ltd. The author has no other competing interests to declare
Figures
References
-
- Bates TA, McBride SK, Leier HC, Guzman G, Lyski ZL, Schoen D, Winders B, Lee J-Y, Lee DX, Messer WB, Curlin ME, Tafesse FG. Vaccination before or after SARS-cov-2 infection leads to robust humoral response and antibodies that effectively neutralize variants. Science Immunology. 2022;7:eabn8014. doi: 10.1126/sciimmunol.abn8014. - DOI - PMC - PubMed
-
- Benjamini Y, Hochberg Y. Controlling the false discovery rate: a practical and powerful approach to multiple testing. Journal of the Royal Statistical Society. 1995;57:289–300. doi: 10.1111/j.2517-6161.1995.tb02031.x. - DOI
-
- Boyd A, Golding J, Macleod J, Lawlor DA, Fraser A, Henderson J, Molloy L, Ness A, Ring S, Davey Smith G. Cohort profile: the '’Children of the 90s’’-- the index offspring of the avon longitudinal study of parents and children. International Journal of Epidemiology. 2013;42:111–127. doi: 10.1093/ije/dys064. - DOI - PMC - PubMed
-
- Brochot E, Demey B, Touzé A, Belouzard S, Dubuisson J, Schmit JL, Duverlie G, Francois C, Castelain S, Helle F. Anti-spike, anti-nucleocapsid and neutralizing antibodies in SARS-cov-2 inpatients and asymptomatic individuals. Frontiers in Microbiology. 2020;11:584251. doi: 10.3389/fmicb.2020.584251. - DOI - PMC - PubMed
Publication types
MeSH terms
Substances
Grants and funding
- MC_UU_00022/3/MRC_/Medical Research Council/United Kingdom
- MC_UU_00022/2/MRC_/Medical Research Council/United Kingdom
- BRC-1215-2001/DH_/Department of Health/United Kingdom
- C18281/A29019/CRUK_/Cancer Research UK/United Kingdom
- MC_PC_20030/MRC_/Medical Research Council/United Kingdom
- MC_PC_15018/MRC_/Medical Research Council/United Kingdom
- SCAF/15/02/CSO_/Chief Scientist Office/United Kingdom
- MC_UU_00032/1/MRC_/Medical Research Council/United Kingdom
- G9815508/MRC_/Medical Research Council/United Kingdom
- 217065/Z/19/Z/WT_/Wellcome Trust/United Kingdom
- MC_PC_19009/MRC_/Medical Research Council/United Kingdom
- SPHSU18/CSO_/Chief Scientist Office/United Kingdom
- MR/P023444/1/MRC_/Medical Research Council/United Kingdom
- WT_/Wellcome Trust/United Kingdom
- SPHSU17/CSO_/Chief Scientist Office/United Kingdom
- COV-LT-0009/DH_/Department of Health/United Kingdom
- MR/W021315/1/MRC_/Medical Research Council/United Kingdom
- MC_PC_20059/MRC_/Medical Research Council/United Kingdom
- 202802/Z/16/Z/WT_/Wellcome Trust/United Kingdom
- MC_UU_12017/11/MRC_/Medical Research Council/United Kingdom
- MC_UU_00011/1/MRC_/Medical Research Council/United Kingdom
- MC_PC_20051/MRC_/Medical Research Council/United Kingdom
LinkOut - more resources
Full Text Sources
Medical
Miscellaneous
