

Supramolecular organization and dynamics of mannosylated phosphatidylinositol lipids in the mycobacterial plasma membrane
- PMID: 36693100
- PMCID: PMC9945971
- DOI: 10.1073/pnas.2212755120
Supramolecular organization and dynamics of mannosylated phosphatidylinositol lipids in the mycobacterial plasma membrane
Abstract
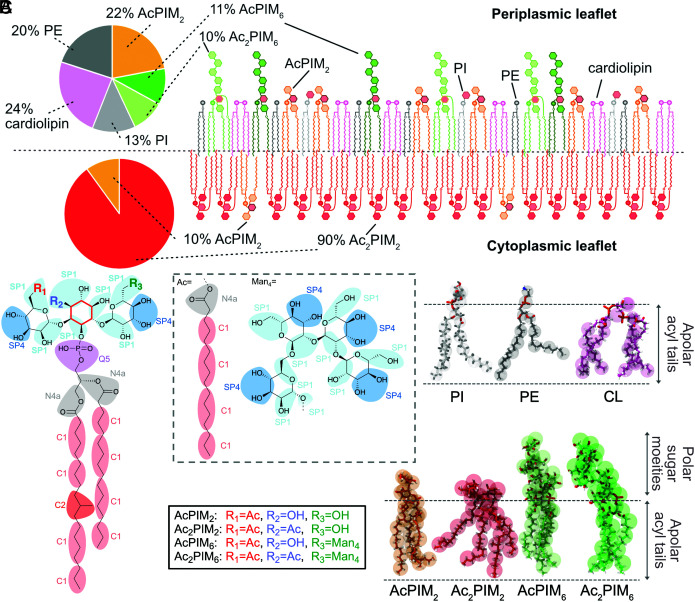
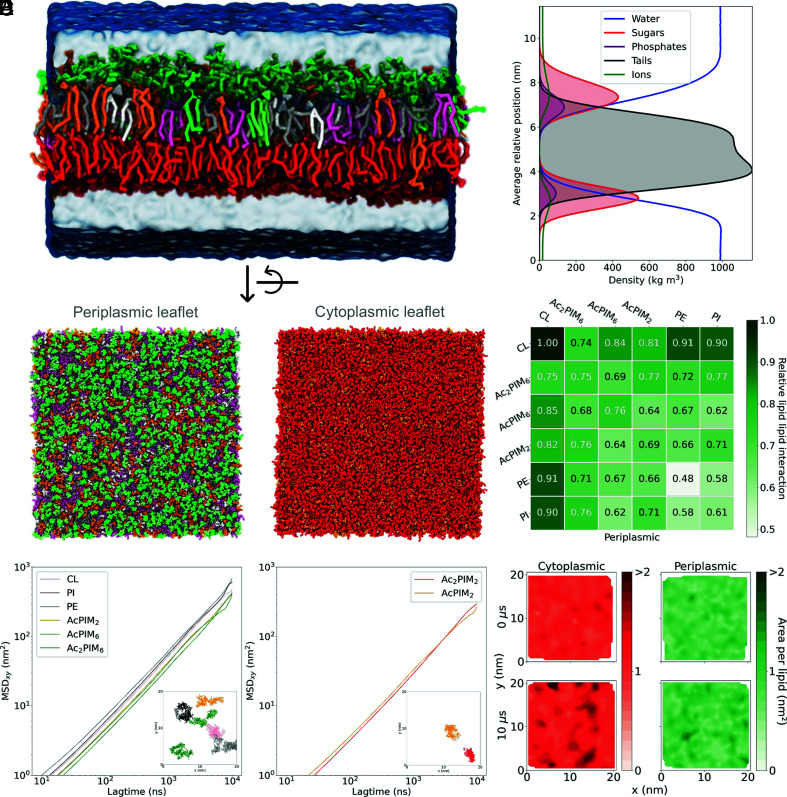
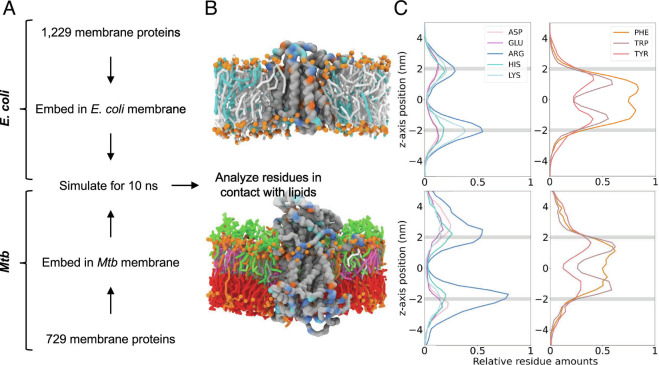
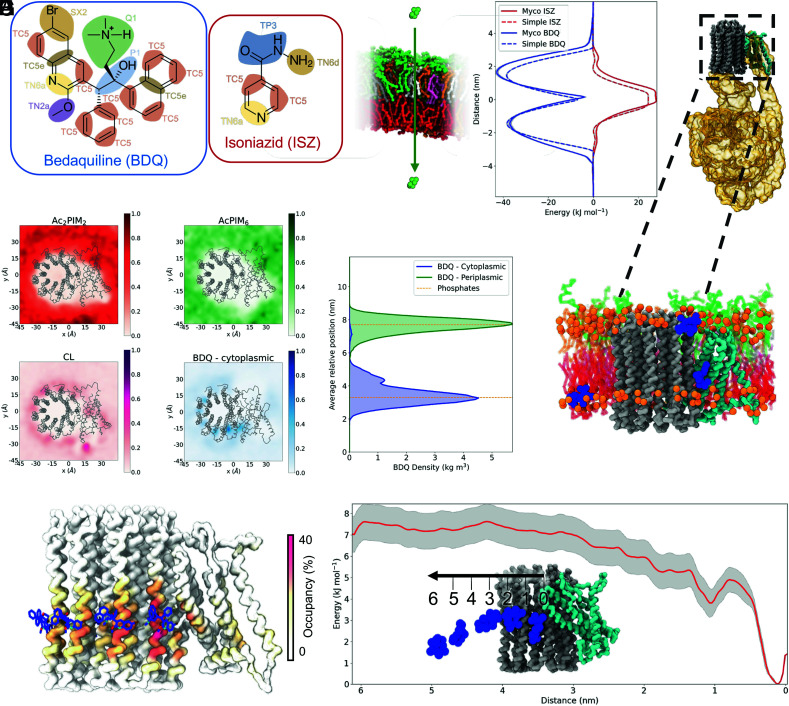
Mycobacterium tuberculosis (Mtb) is the causative agent of tuberculosis (TB), a disease that claims ~1.6 million lives annually. The current treatment regime is long and expensive, and missed doses contribute to drug resistance. Therefore, development of new anti-TB drugs remains one of the highest public health priorities. Mtb has evolved a complex cell envelope that represents a formidable barrier to antibiotics. The Mtb cell envelop consists of four distinct layers enriched for Mtb specific lipids and glycans. Although the outer membrane, comprised of mycolic acid esters, has been extensively studied, less is known about the plasma membrane, which also plays a critical role in impacting antibiotic efficacy. The Mtb plasma membrane has a unique lipid composition, with mannosylated phosphatidylinositol lipids (phosphatidyl-myoinositol mannosides, PIMs) comprising more than 50% of the lipids. However, the role of PIMs in the structure and function of the membrane remains elusive. Here, we used multiscale molecular dynamics (MD) simulations to understand the structure-function relationship of the PIM lipid family and decipher how they self-organize to shape the biophysical properties of mycobacterial plasma membranes. We assess both symmetric and asymmetric assemblies of the Mtb plasma membrane and compare this with residue distributions of Mtb integral membrane protein structures. To further validate the model, we tested known anti-TB drugs and demonstrated that our models agree with experimental results. Thus, our work sheds new light on the organization of the mycobacterial plasma membrane. This paves the way for future studies on antibiotic development and understanding Mtb membrane protein function.
Keywords: antibiotics diffusion; multi-scale molecular dynamics; mycobacteria inner membrane; phosphatidyl-myoinositol mannosides.
Conflict of interest statement
The authors declare no competing interest.
Figures
Similar articles
-
[Development of antituberculous drugs: current status and future prospects].Kekkaku. 2006 Dec;81(12):753-74. Kekkaku. 2006. PMID: 17240921 Review. Japanese.
-
The Phosphatidyl-myo-Inositol Dimannoside Acyltransferase PatA Is Essential for Mycobacterium tuberculosis Growth In Vitro and In Vivo.J Bacteriol. 2021 Mar 8;203(7):e00439-20. doi: 10.1128/JB.00439-20. Print 2021 Mar 8. J Bacteriol. 2021. PMID: 33468587 Free PMC article.
-
Editorial: Current status and perspective on drug targets in tubercle bacilli and drug design of antituberculous agents based on structure-activity relationship.Curr Pharm Des. 2014;20(27):4305-6. doi: 10.2174/1381612819666131118203915. Curr Pharm Des. 2014. PMID: 24245755
-
DC-SIGN and mannosylated surface structures of Mycobacterium tuberculosis: a deceptive liaison.Eur J Cell Biol. 2010 Jan;89(1):95-101. doi: 10.1016/j.ejcb.2009.10.004. Epub 2009 Nov 4. Eur J Cell Biol. 2010. PMID: 19892432 Review.
-
The cell envelope glycoconjugates of Mycobacterium tuberculosis.Crit Rev Biochem Mol Biol. 2014 Sep-Oct;49(5):361-99. doi: 10.3109/10409238.2014.925420. Epub 2014 Jun 10. Crit Rev Biochem Mol Biol. 2014. PMID: 24915502 Free PMC article. Review.
Cited by
-
Insights into substrate transport and water permeation in the mycobacterial transporter MmpL3.Biophys J. 2023 Jun 6;122(11):2342-2352. doi: 10.1016/j.bpj.2023.03.018. Epub 2023 Mar 16. Biophys J. 2023. PMID: 36926696 Free PMC article.
-
Molecular Modeling and Simulation of the Mycobacterial Cell Envelope: From Individual Components to Cell Envelope Assemblies.J Phys Chem B. 2023 Dec 28;127(51):10941-10949. doi: 10.1021/acs.jpcb.3c06136. Epub 2023 Dec 13. J Phys Chem B. 2023. PMID: 38091517 Free PMC article. Review.
-
Top five unanswered questions in bacterial cell wall research.Cell Surf. 2024 Feb 21;11:100122. doi: 10.1016/j.tcsw.2024.100122. eCollection 2024 Jun. Cell Surf. 2024. PMID: 38425882 Free PMC article. Review. No abstract available.
-
Mechanistic studies of mycobacterial glycolipid biosynthesis by the mannosyltransferase PimE.Nat Commun. 2025 Apr 29;16(1):3974. doi: 10.1038/s41467-025-57843-1. Nat Commun. 2025. PMID: 40301322 Free PMC article.
-
Systematic Approach to Parametrization of Disaccharides for the Martini 3 Coarse-Grained Force Field.J Chem Inf Model. 2025 Feb 10;65(3):1537-1548. doi: 10.1021/acs.jcim.4c01874. Epub 2025 Jan 17. J Chem Inf Model. 2025. PMID: 39818849 Free PMC article.
References
-
- WHO, “Global tuberculosis report 2022” Report Number: 27 (World Health Organization, Geneva, 2022).
-
- Horsburgh C. R., Barry C. E., Lange C., Treatment of tuberculosis. New Engl. J. Med. 373, 2149–2160 (2015). - PubMed
-
- WHO, “Global tuberculosis report 2021” Report Number: 26 (World Health Organization, Geneva, 2021).
-
- WHO, “The end TB strategy” Report Number: 1 WHO Press, World Health Organization; (2022).
-
- WHO, “1.4 million with tuberculosis, lost out on treatment during first year of COVID-19” (2021). https://news.un.org/en/story/2021/03/1087962UNNews
Publication types
MeSH terms
Substances
Grants and funding
LinkOut - more resources
Full Text Sources
Medical
